Super Is A Lottery – Productivity Commission

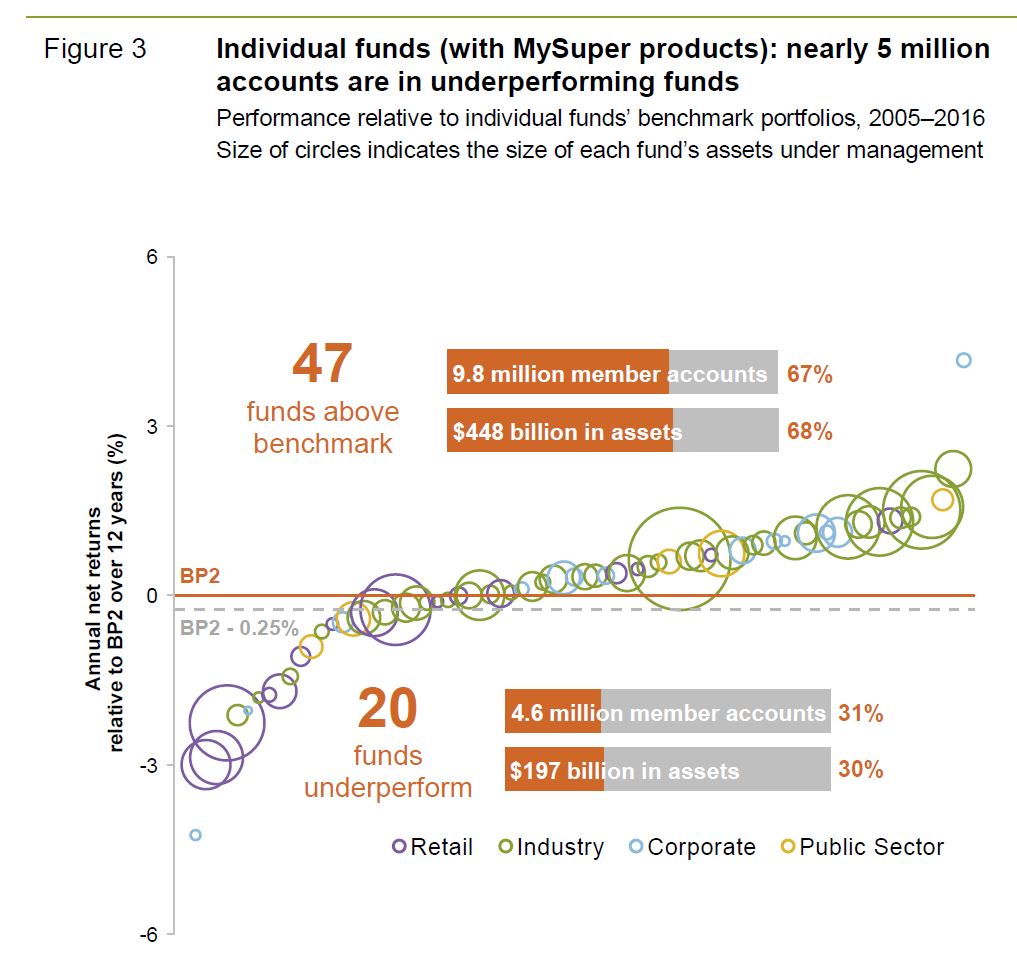
The Productivity Commission has released their draft report on the $2.6 trillion superannuation system.  And they have done it again! A powerful ~500 pages of insight which cuts to the heart of the system. They raise some very imp0ortant points which shows the system is a lottery. They call for substantial reform. Five million member accounts are being shortchanged.

We see some similar patterns of behaviour  to those revealed in the current Royal Commission.  Not working for the best outcomes of members. Poor governance. Excessive fees. Poor disclosure and hidden charges and commissions. No wonder more households have chosen self managed super alternatives! They also question the current regulatory framework.

Performance varies thanks to fees

Embedded fees and multiple funds erode returns significantly, especially from “retail” funds. Australians pay over $30 billion a year in fees on their super (excluding insurance premiums).

Fees can have a substantial impact on members — for example, an increase in fees of just 0.5 per cent can cost a typical full-time worker about 12 per cent of their balance (or $100 000) by the time they reach retirement.

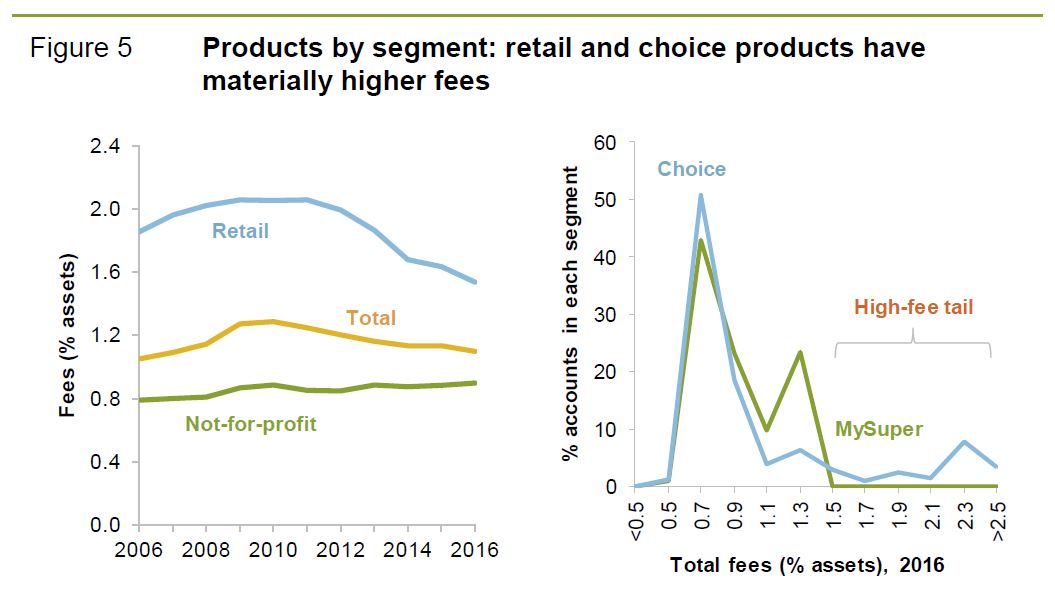
Fees charged by retail funds remain relatively high, at least for choice products. Roughly 14 per cent of member accounts appear to be paying annual fees in excess of 1.5 per cent of their balances. Fees can explain a
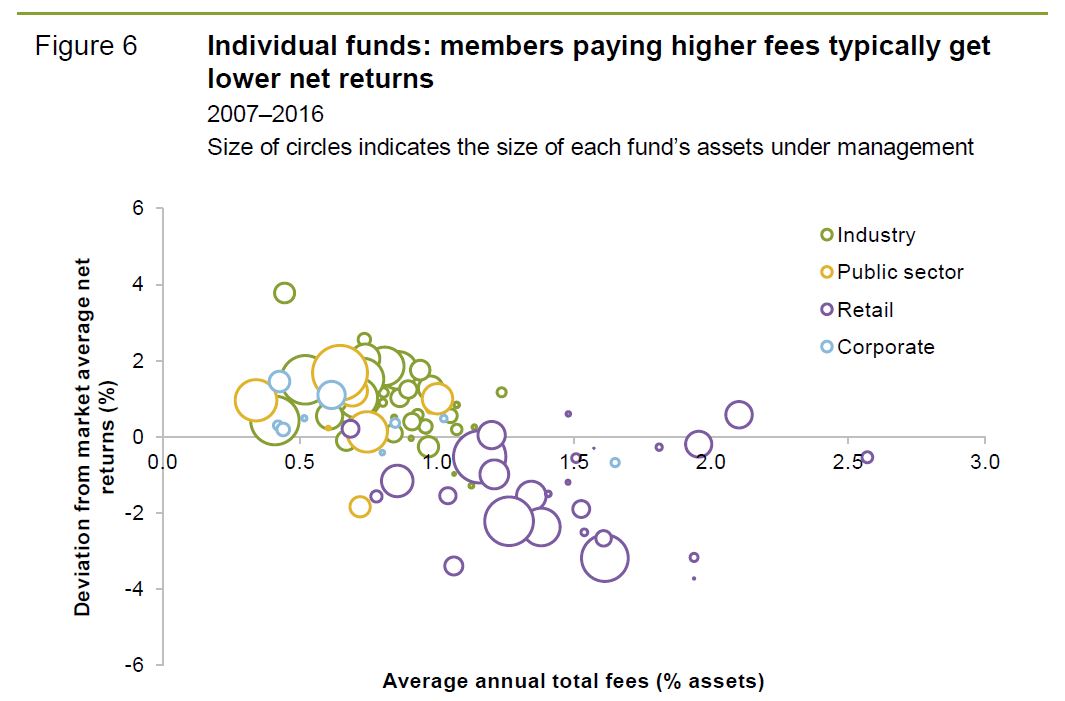
significant amount of the variation in net returns across super funds. Funds that charge higher fees tend to deliver lower returns, once both investment and administration fees have been netted off. Moreover, at least 2 per cent of accounts are still subject to trailing adviser commissions — despite such commissions being banned for new accounts by the Future of Financial Advice laws.

The Government says this highlights that some superfund operators have their snout firmly in the trough! Many of these reside within the big banks!

There is no shortage of regulation in the super system. Regulation is essential for a complex system holding large amounts of money and characterised by many disengaged members and potential conflicts of interest. But at times the regulators appear too focused on funds and their interests rather than on what members need.

Regulators need to focus more on member outcomes

The key regulators — APRA and ASIC — are doing well in their core duties of prudential regulation (APRA) and financial product and advice regulation (ASIC). There have been improvements over many years, and these will continue with recently proposed reforms to boost each regulator’s toolkit. Legislating an ‘outcomes test’ for MySuper products will give APRA greater scope to lift standards and remove authorisation from funds that are failing to act in the best interests of members (especially on mergers). And ASIC’s new product intervention powers will strengthen its ability to guard against upselling.

However, there is some confusion around the two regulators’ respective roles, given both have long held powers to police bad behaviour by trustee boards. For example, ASIC has traditionally been responsible for regulating conflicts of interest, but APRA has increasingly encroached on this role through its prudential standard setting. While much of APRA’s work is pre-emptive and out of public view, ASIC has traditionally been reactive (responding to misconduct only after the fact) and public. It has become increasingly unclear which regulator has primary responsibility for trustee conduct — with the risk of misconduct falling between the cracks and a lack of clear regulator accountability.

Strategic conduct regulation appears at times to be missing in action. Ideally, this would involve a regulator proactively identifying actual or potential instances of material member harm, investigating the underlying conduct and taking enforcement action in a way that provides a valuable public deterrent to future poor conduct. To date, there has been a deficit of public exposure of poor conduct (and associated penalties) to demonstrably discourage similar behaviour by others — now and in the future.

There are yawning gaps in data

A further area of weakness is how data on the system are collected. The regulators’ data collections are largely focused on funds and products, with a deficiency of member-based data. And there are major gaps and inconsistencies in the datasets held by regulators — such as the returns and fees experienced by members of individual choice products, funds’ outsourcing arrangements and details of the insurance members hold through super. Our funds survey was designed to plug some of these gaps, but — as noted above — many responses fell well short of ‘best endeavours’, which of itself proved revealing .

Regulators have done much to improve the breadth and depth of their data holdings in recent years, but this has been off a low base. Major differences in definitions persist across regulators, and poor quality disclosure by funds appears to go unpunished. Progress has been slow in some areas because of industry opposition (largely on the basis of short-term compliance costs) and the lack of a strong member voice to give impetus to change.

The result is poor transparency, which leaves members in the dark as to what they are really paying for and makes it harder for engaged members to compare products and identify the best performing funds. This suppresses competitive pressure on the demand side, and gives rise to the perverse risk of worse outcomes for members who do get engaged. The lack of transparency also makes it hard for regulators to effectively monitor the system and to hold funds to account for the outcomes they

The draft report makes the following key points:

  • Australia’s super system needs to adapt to better meet the needs of a modern workforce and a growing pool of retirees. Currently, structural flaws — unintended multiple accounts and entrenched underperformers — harm a significant number of members, and regressively so. Fixing these twin problems could benefit members to the tune of $3.9 billion each year. Even a 55 year old today could gain $61 000 by retirement, and lift the balance for a new job entrant today by $407 000 when they retire in 2064.
  • Our unique assessment of the super system reveals mixed performance. While some funds consistently achieve high net returns, a significant number of products (including some defaults) underperform markedly, even after adjusting for differences in investment strategy. Most (but not all) underperforming products are in the retail segment. Fees remain a significant drain on net returns. Reported fees have trended down on average, driven mainly by administration costs in retail funds falling from a high base. A third of accounts (about 10 million) are unintended multiple accounts. These erode members’ balances by $2.6 billion a year in unnecessary fees and insurance.The system offers products and services that meet most members’ needs, but members lack access to quality, comparable information to help them find the best products.  Not all members get value out of insurance in super. Many see their retirement balances eroded — often by over $50 000 — by duplicate or unsuitable (even ‘zombie’) policies.
  • Inadequate competition, governance and regulation have led to these outcomes. Rivalry between funds in the default segment is superficial, and there are signs of unhealthy competition in the choice segment (including the proliferation of over 40 000 products). The default segment outperforms the system on average, but the way members are allocated to default products leaves some exposed to the costly risk of being defaulted into an underperforming fund (eroding over 36 per cent of their super balance by retirement). Regulations (and regulators) focus too much on funds rather than members. Subpar data and disclosure inhibit accountability to members and regulators.
  • Policy initiatives have chipped away at some of the problems, but more changes are needed.
  • A new way of allocating default members to products should make default the exemplar.Members should only ever be allocated to a default product once, upon entering the workforce. They should also be empowered to choose their own super product by being provided a ‘best in show’ shortlist, set by a competitive and independent process.An elevated threshold for MySuper authorisation (including an enhanced outcomes test) would look after existing default members, and give those who want to get engaged products they can easily and safely choose from (and compare to others in the market). This is superior to other default models — it sidesteps employers and puts decision making back with members in a way that supports them with safer, simpler choice.
  • These changes need to be implemented in parallel to other essential improvements. Stronger governance rules are needed, especially for board appointments and mergers.  Funds need to do more to provide insurance that is valuable to members. The industry’s code of practice is a small first step, but must be strengthened and made enforceable.  Regulators need to become member champions — confidently and effectively policing trustee conduct, and collecting and using more comprehensive and member-relevant data.

Written submissions can be made by Friday 13 July 2018.

Home Ownership Foundations Are Being Shaken

From The Conversation.

The nature of the centrepiece of the Australian housing system – owner occupation – is quietly undergoing a profound transformation.

Once taken for granted by the mainstream, home ownership is increasingly precarious. At the margins, which are wide, it is as if a whole new form of tenure has emerged.

Whatever the drivers, significant and lasting shifts are shaking the foundations of home ownership. The effects are far-reaching and could undermine both the financial and wider well-being of all Australian households.

Over the course of 100 years, Australians became accustomed to smooth housing pathways from leaving the parental home to owning their house outright. However, not only did the 2008-09 global financial crisis (GFC) underline the risk of dropping out along the way, but more recent Australian evidence has shown that the old pathways have been displaced by more uncertain routes that waver between owning and renting.

The Household, Income and Labour Dynamics in Australia (HILDA) Survey indicates that, during the first decade of the new millennium, 1.9 million spells of home ownership ended with a move into renting (one-fifth of all home ownership spells that were ongoing in that period). It also shows that among those who dropped out, nearly two-thirds had returned to owning by 2010. Astonishingly, some 7% “churned” in and out of ownership more than once. Many households no longer either own or rent; they hover between sectors in a “third” way.

The drivers of this transformation include an ongoing imperative to own, vying with the factors that oppose this – rising divorce rates, soaring house prices, growing mortgage debt, insecure employment and other circumstances that make it difficult to meet home ownership’s outlays.

Those who use the family home as an “ATM” are at added risk. This relatively new way of juggling mortgage payments, savings and pressing spending needs makes some styles of owner occupation more marginal – as the tendency is to borrow up, rather than pay down, mortgage debts over the life course.

A retirement incomes system under threat

Since its inception, the means-tested age pension system has been set at a low fixed amount. Retired Australians could nevertheless get by provided they achieved outright home ownership soon enough. The low housing costs associated with outright ownership in older age were effectively a central plank of Australian social policy.

This worked well from the 1950s for nearly half a century. But now growing numbers of people retire with a mortgage debt overhang or as lifetime renters grappling with the costs of insecure private rental tenancies.

Moreover, developments in the Australian housing system could undermine a second retirement incomes pillar – the superannuation guarantee. An important goal of the superannuation guarantee is financial independence in old age. But if superannuation pay-outs are used to repay mortgage debts on retirement, reliance on age pensions will grow rather than recede.

A shrinking asset base for welfare

Home ownership is retreating at a time when income inequalities are the highest in nearly seven decades and governments are eyeing housing wealth as an asset base for welfare.

Such policy interest is not surprising. Housing wealth dominates the asset portfolios of the majority of Australian households, boosted by soaring house prices. If home owners can be encouraged or even compelled to draw on their housing assets to fund spending needs in retirement, this will ease fiscal pressures in an era of population ageing.

However, the welfare role of home ownership is already important in the earlier stages of life cycles. Financial products are increasingly being used to release housing equity in pre-retirement years. This adds to the debt overhang as retirement age approaches. It also increases exposure to credit and investment risks that could undermine stability in housing markets.

A gender equity issue

A commonly overlooked angle relates to gender equity. Australian women own less wealth than men, and they also hold more housing-centric asset portfolios.

Estimates from the 2014 HILDA Survey wealth module show that the family home makes up nearly half of the total assets owned by single women, compared to 39% for single men. Women are also more likely to sell their family home to pay for financial emergencies.

Hence, women are more exposed to housing market instability associated with precarious home ownership. Single women are especially vulnerable to investment risk when they seek to realise their assets.

A neglected economic lever

Housing and mortgage markets played a central role in the GFC. Today, it is widely agreed that resilient housing and mortgage markets are important for overall economic and financial stability. There are also concerns that the post-GFC debt overhang is a drag on economic growth.

However, the policy stance in the wake of the GFC has been “business as usual”. There has been very little real innovation in the world of housing finance or mortgage contract design in recent years. This might change if housing were steered from the periphery to a more central place in national economic debates.

Forward-looking policy response is needed

Growing numbers of Australians clearly face an uncertain future in a changing housing system. The traditional tenure divide has been displaced by unprecedented fluidity as people juggle with costs, benefits, assets and debts “in between” renting and owning.

This expanding arena is strangely neglected by policy instruments and financial products. Politicians cling to an outdated vision of linear housing careers that does little to meet the needs of “at risk” home owners, locked-out renters, or churners caught between the two.

The hazards of a destabilising home ownership sector are wide-ranging, rippling well beyond the realm of housing. Part of the answer is a new drive for sustainability, based on a housing system for Australia that is more inclusive and less tenure-bound.

Author: Rachel Ong, Professor of Economics, School of Economics and Finance, Curtin University; Gavin Wood, Emeritus Professor of Housing and Housing Studies, RMIT University; Susan Smith,
Honorary Professor of Geography, University of Cambridge

Australian SMSF investors remained red hot for equity in 2017 – NAB

NAB says that appetite for equity investing among Australian Self-Managed Super Fund (SMSF) investors surged in 2017, with international shares, domestic exchange traded funds, mFunds and partially paid shares the top new investment picks for investors.

The nabtrade data, which looked at the equity trading patterns of SMSFs in the 12 months to 15 December, showed this group of investors had almost tripled their investment in mFunds, and raised their holdings in ETFs and partially paid shares by 55 per cent and 51 per cent respectively.

Preference shares were equally popular with SMSF investors, with holdings up 34 per cent. Traditional equity holdings were also solid, up 13.5 per cent, while SMSFs retreated from investing in floating rate notes and options over the same period.

NAB Director of SMSF and Customer Behaviour, Gemma Dale, said SMSF investors were overall very active in equity markets in 2017, with total portfolios up more than 15 per cent on the previous year.

“The analysis shows that investors are getting comfortable with the more exotic equity instruments in the market and are prepared to spread risk. Low levels of volatility and the strong performance of domestic and international markets gave investors’ confidence to look for new opportunities,’’ Ms Dale said.

“As with previous years, financials and materials were the most heavily traded sectors, accounting for 36 per cent and 17 per cent of the turnover in 2017. NAB, Commonwealth Bank and Telstra were the most traded stocks in 2017.

“Telecommunication services, healthcare and consumer discretionary stocks were also popular among investors.”

The data also showed SMSF investors are also getting more confident in international equity investing and prepared to take bets on new and innovative sectors such as robotics and aerospace using ETFs.

“International trading surged nearly 100 per cent over the previous year, with US equities and US ETF’s the most traded equity instruments on international markets throughout the year,’’ Ms Dale said.

‘’Like retail investors, SMSF investors are turning to offshore markets to diversify their portfolios and to access high growth sectors in the US.’’

Most popular equity investments by SMSF Investors in 2017
Top Ten Domestic Equity instruments in 2017
NATIONAL AUSTRALIA BANK. Ordinary Fully Paid
COMMONWEALTH BANK OF AUSTRALIA. Ordinary Fully Paid
WESTPAC BANKING CORPORATION. Ordinary Fully Paid
AUSTRALIA AND NEW ZEALAND BANKING GROUP. Ordinary Fully Paid
TELSTRA CORPORATION. Ordinary Fully Paid
BHP BILLITON. Ordinary Fully Paid
WESFARMERS. Ordinary Fully Paid
CSL. Ordinary Fully Paid
WOOLWORTHS GROUP. Ordinary Fully Paid
WOODSIDE PETROLEUM. Ordinary Fully Paid
Source: nabtrade

Top Ten International Equity instruments in 2017
AMAZON COM ORD Common Stock
APPLE ORD Common Stock
FACEBOOK CL A ORD Common Stock
ALIBABA GROUP HOLDING ADR REP 1 ORD Depositary Receipt
ENPHASE ENERGY ORD Common Stock
TENCENT ORD Common Stock
TESLA ORD Common Stock
NVIDIA ORD Common Stock
MICROSOFT ORD Common Stock
BANK OF AMERICA ORD Common Stock
Source: nabtrade

SMSF Funds Growing, And Performing

The ATO published the latest data on Self-managed superannuation funds to 2016. The number and balance of funds continues to grow and contributions are growing faster than to retail or industry funds.  More property is held and under limited recourse borrowing arrangement.

In 2015–16, estimated average return on assets for SMSFs was positive (2.9%), a decrease from the estimated returns in 2014–15 (6.0%). This was the same as the investment performance for APRA funds of more than four members (2.9%) and remains consistent with the trend for APRA funds over the five years to 2016.

We also see a rise in property investment within SMSFs, with 7% of SMSFs reported $25.4 billion assets held under limited recourse borrowing arrangement  (LRBAs), which is slightly higher than in 2015 (6%). The majority of these funds held LRBA investments in residential real property and non-residential real property.

The estimated average total expense ratio of SMSFs in 2016 was 1.21% and the average total expenses value was $13,700.  This would be lower than the typical costs in a retail fund.

SMSF’s make up 30% of all superannuation assets which in total are worth $2.3 billion. There were 597,000 SMSFs holding $697 billion in assets, with more than 1.1 million SMSF members as at 30 June 2017. Over the five years to 30 June 2017, growth in the number of SMSFs averaged almost 5% annually.

At 30 June 2016 the average SMSF member balance was $599,000 and the median balance was $362,000, an increase of 26% and 32% respectively over the five years to 2016.

The average member balances for female and male members were $511,000 and $641,000 respectively. The female average member balance increased by 30% over the five-year period, while the male average member balance increased by 22% over the same period.

Over the five years to 2016, the proportion of members with balances of $200,000 or less decreased from 42% to 32% of all members.

In 2016, the majority of members had balances of between $200,001 and $1 million.

53% of SMSFs have been established for more than 10 years, and 16% have been established for three years or less.

For the 2015–16 income year, the average assets of SMSFs were just over $1.1 million, a growth of 25% over five years and 3% from 2015.  Total contributions to SMSFs increased by 21% over the five years to 2016. This is significantly higher than the growth of total contributions to all superannuation funds (16%) over the same period. The majority of SMSFs continued to be solely in the accumulation phase (53%) with the remaining 47% making pension payments to some of or all members.

At 30 June 2017, 57% of all SMSFs had a corporate trustee rather than individual trustees.

Of newly registered SMSFs in 2015 to 2017, on average 81% were established with a corporate trustee.

At 30 June 2017 there were 1.1 million SMSF members, of whom 53% were male and 47% female.

The trend continued for members of new SMSFs to be from younger age groups. The median age of SMSF members of newly established funds in 2016 was 47 years, compared to 59 years for all SMSF members as at 30 June 2017.

SMSFs directly invested 80% of their assets, mainly in cash and term deposits and Australian-listed shares (a total of 54%).

In the five years to 2016, cash and term deposits decreased (by 7%) to 25% of total SMSF assets.

In 2016, 7% of SMSFs reported $25.4 billion assets held under Limited recourse borrowing arrangement (LRBAs), which is slightly higher than in 2015 (6%). The majority of these funds held LRBA investments in residential real property and non-residential real property. In terms of value, real property assets held under LRBAs collectively made up 93% or $23.7 billion of all SMSF LRBA asset holdings in 2016.

The estimated average total expense ratio of SMSFs in 2016 was 1.21% and the average total expenses value was $13,700.

The average ‘investment expense’ and ‘administration and operating expense’ ratios were consistent at 0.65% and 0.56% respectively.

Australians in for a Boon With New Super Changes in 2018

NAB says that Australians who are looking to buy their first home or are preparing for retirement could be in for a windfall in 2018, with a number of key superannuation changes expected to come into effect.

NAB Director of SMSF and Customer Behaviour, Gemma Dale said a number of key super reforms are expected to come into effect this year, so it’s important consumers stay on top of these change to ensure they capitalise on the opportunities.

“One of the big changes this year is the Downsizer contribution, which allows individuals aged 65 years plus to make non-concessional contributions of up to $300,000 per person to their super from the proceeds of selling their main residences,” Ms Dale said.

“But it is important to note that these contributions only apply to contracts of sale entered into from 1 July 2018, and the property also needs to be owned for at least 10 years before disposal.’’

Another key change is the first home super saver scheme.

“This scheme will allow eligible individuals who make voluntary super contributions from 1 July 2017 to withdraw these contributions, together with associated earnings for the purpose of purchasing their first home,” Ms Dale said.

“These voluntary contributions will be limited to $15,000 per year, up to a total of $30,000, and count towards the relevant contribution cap.

“Eligible individuals will be able to have up to 100 per cent of non-concessional and 85 per cent of concessional contributions plus associated earnings withdrawn from super to purchase their first home from 1 July.

“However, it is important to note, that the legislation for this scheme is yet to be passed, so there is a risk any voluntary contributions made in anticipation of it could be locked into individuals’ super.”

From 1 July, individuals with super balances of less than $500,000 on 30 June of the prior financial year will be able to access a higher annual cap and contribute their remaining unused concessional contribution cap on a rolling basis for a period of five years. But only unused amounts accrued from 1 July 2018 can be carried forward.

“This measure will enable customers who take time out of work or work part-time to make catch-up contributions when they accumulate lumpy income or decide to work full-time,’’ Ms Dale said.

Ms Dale encouraged Australians to seek advice before making any decisions to ensure it is in their best interest.

Some key super changes expected to come into effect from 1 July 2018

  • First home super saver scheme – This scheme allows eligible individuals who make voluntary super contributions on or after 1 July 2017 to withdraw these contributions, together with associated earnings for the purpose of purchasing their first home. These voluntary contributions are limited to $15,000 per year, up to a total of $30,000 and count towards the relevant contribution cap.
  • Downsizer contributions – The Government introduced a Bill in September 2017 allowing individuals aged 65 years or over to make non-concessional contributions of up to $300,000 (per person) to their superannuation from proceeds of selling their main residences
  • Catch-up contribution concessions – Individuals with super balances less than $500,000 on 30 June of the prior financial year will be able to access a higher annual cap and contribute their remaining unused concessional contribution cap on a rolling basis for a period of five years. Only unused amounts accrued from 1 July 2018 can be carried forward.

Chat bots, AI and superannuation

From InvestorDaily.

Long criticised as a laggard in digital technology, 2017 marks the year the super industry got serious says Willis Towers Watson.

Since 2013, we’ve surveyed superannuation funds on their use of digital. Four short years ago, the rate of uptake was slow and funds didn’t allocate significant budget to invest in technologies aimed at member education or engagement.

In 2017, our study showed 94 per cent of funds are increasing their use of digital – and their budgets – with a focus on developing new technologies and refining existing ones.

Nonetheless, the increased investment is still being stretched across a wide range of tools.

The big jump in this survey was in the use of social media – 88 per cent of funds in 2017, up from 47 per cent in 2015 and 35 per cent in 2013.

The reason? Members are driving the platforms that funds are using, rather than the other way around.

Social media is proving valuable to funds to leverage sponsored content and build brand awareness and trust – even if they aren’t talking about superannuation specifically.

It’s a big step forward to making super more approachable and relevant to the widest possible demographic.

But social media is not new – Facebook was founded 13 years ago, while Twitter launched in 2006. How funds embrace innovations that leverage social media platforms is something they need to address on a biannual basis at a minimum. This is a dynamic medium where a set-and-forget strategy will not work.

Innovation means different things to different funds. Compared to previous surveys, fewer funds consider themselves to be laggards. Early adopters of digital technology grew from 24 per cent to 31 per cent in 2017.

No-one is denying the clearly visible benefits of digital in creating personalised and targeted communication. But funds are questioning what needs to come next.

Regulation and compliance have always been issues with super funds in adopting technology and while some funds have started to use chat bots and are actively exploring AI, how exactly this may be used is still something for the future.

Problem solving a member’s simple queries using a chat bot seems like an effective use of technology but the industry remains convinced there will always be a need for human interaction.

Other financial services industries have embraced aspects of AI. StartUpCover, a joint venture between Willis Towers Watson and insurer CGU, launched a world-first Facebook Messenger chat bot this year.

It provides 24/7 insurance information and indicative quote within five minutes of messaging.

Clearly the technology is there to be leveraged, and its application for the superannuation industry is being worked through.

The 2016 Global Mobile Messaging Report, published by US communications company Twilio, showed that 46 per cent of consumers would like to learn about new products through messaging, while 85 per cent of consumers would like to reply to a message from a business or engage in conversation, noting that messaging is not a one-way communication channel.

Further research from the Centre for Generational Kinetics shows 41 per cent of Millennials would describe themselves as ‘truly satisfied’ if they could use messaging or SMS to connect with companies where they do business.

So, are super funds ready to support two-way communication via messaging? It’s another important question to be addressed.

Is there a digital saturation point?

We hosted a roundtable with fund marketing officers, heads of member engagement and digital experts where they talked a lot about following digital trends more broadly and using this as a way to influence their own future direction.

This means funds need to utilise their internal resources to be watching, learning and trialling new technologies that become popular and to assess what sticks with members.

Following the broader digital trends can be beneficial. It allows funds not to need to invent their own technology but rather adapt technology that is already being utilised.

But technology can’t just be used for technology’s sake. Like the debate over the use of apps by super funds, it needs to contribute to a fund’s member experience and create positive outcomes for their retirement strategy to assist funds to justify their investment in a new technology.

Do members want to check their super like they check their bank account balance?

With so much development in the digital space over the past five years, it makes sense that funds are continuing to test a number of digital options to see what works best for their members.

It’s a challenge for funds, servicing a huge and diverse group of members with varying attitudes, habits and priorities.We know that superannuation isn’t like other services. You don’t need to check your super account daily or weekly like you do with a bank account.

With an ageing demographic, and more members in retirement spending their savings, we’ll see a change in this behaviour.

However, long-term engagement, trust and loyalty are all things funds crave. So finding the right balance of tools that provide this to members is critical. A social media strategy is particularly crucial here.

Personalising super communication will continue to grow to a point where it is the norm rather than the exception.

Will data analytics have a greater role to play?

Data analytics will feed funds’ knowledge to understand the best tools to use for their members and where to focus their budgets. The use of data analytics can only increase.

The more funds can learn about how the digital tools their members are using are driving member outcomes, the more they can target their communication to make it more personal and engaging. Data analytics can reveal what is working already and what can be improved.

It will also assist funds in managing resources and budgets.

Digital tools can also be used in a more targeted manner, as we have seen with social media, which tends to be used for brand awareness rather than as a member education tool.

Do we have to be everywhere for everyone?

Consolidation of digital tools will come – it has to. However, this will bring a greater focus on an omni-channel approach to ensure a more consistent and co-ordinated member experience.

In the short term, funds will continue to explore a range of digital tools, but longer term, given limited resources, only those that drive member engagement and contribute to a fund’s overall strategy will survive.

What will this look like? AI, chat-bots or something we haven’t thought of yet? Watch this space. What we do know is there will be more to come.

Rick Body is head of digital solutions Australasia and Asia for Willis Towers Watson.

Could we nationalise the superannuation system even if we wanted to?

From The Conversation.

Two decades of reforms, reviews and inquiries appear to have better served the financial sector than the interests of super fund members.

At first glance Australia’s 214 major superannuation funds are performing well, giving a healthy 9.2% return on the A$1.4 trillion we have deposited with them. But there are issues with our publicly mandated but privately controlled superannuation system.

Admittedly, our current system provides a range of benefits – increasing retirement incomes, giving us plenty of choice between funds (in theory if not in practice), and investing in the Australian economy.

But the operating expenses for Australian funds consistently and significantly outstrip those in other OECD countries. Fees are high and there is little evidence that higher fees lead to better services.

In 2009 the Inquiry into Financial Products and Services in Australia recommended there be an annual check on the quality of advice. The only superannuation-related survey that has been undertaken to date found that 39% of advice was poor and only 3% was good quality. No further surveys have been conducted.

Australians are forced to contribute to superannuation funds, without the right of exit, but they aren’t protected from high fees or bad investment strategies. A nationalised superannuation system, or one that combines private and public super funds, could simplify the system and reduce costs.

Baked in problems

Australia’s system wasn’t originally intended to be entirely privately-run, which has left us without many necessary protections (such as appropriate disclosure of fees and charges).

Australia was almost alone among OECD countries in reaching the 1980s with no national employment-related retirement income scheme. There had been at least ten attempts to set one up between the 1890s to the 1970s. All failed to win support from employers, existing superannuation funds, life offices and state governments.

An additional attempt was made in the last Parliament of the Liberal government in 1972. The incoming Whitlam Labor government also tried to introduce a national superannuation scheme in 1973, establishing the Hancock inquiry.

Consistent with its recommendations, the Hawke/Keating Labor government intended to move forward with a national scheme. However, against the backdrop of past nationalisation failures, recession, high inflation, a wage freeze, strikes, declining union membership, and the increasing discontinuation of superannuation products, the government instead privatised it.

Thus, the Hawke/Keating Labor government was a major winner of a privatised scheme gaining electoral support from a coalition of private interests.

Absent from this coalition were the fund members. There is no evidence of any consultation process with either the fund members themselves and/or any consumer representative groups prior to the development of our present, privatised regime.

The Superannuation Guarantee scheme introduced a minimum employer contribution to superannuation for most employees. This scheme was a windfall for the financial sector, as they received a guaranteed, trillion-dollar stream of superannuation contributions to look after with no exit rights for members.

The union movement would also appear to be a winner from privatisation. The privatised system allowed the unions to expand the number of their existing industry funds to earn more administration and investment-based fees. The 41 industry funds currently hold A$545.2 billion, compared to the A$587.8 billion held by the 128 for-profit retail funds.

It could be argued that the losers in this mandatory regime are the fund members who were marginalised from the outset. As it was originally intended to be a government-run system, many of the administrative processes necessary for an efficient and effective privatised system were originally absent.

For example, there were no codified accounting, reporting and disclosure requirements. No mandatory requirements for the disclosure of fees and charges. No codified audit report requirements. And, for nearly a decade, the regulator did not have appropriate constitutional powers to enforce civil and criminal penalties against non-complying trustees.

Two-decades of reforms have remedied the constitutional, auditing and accounting issues. But significant issues remain, including limitations in the disclosure of fees and charges and the related issue of conflicted payments.

Alternative super systems

In theory, there are alternative superannuation models for Australia to consider. For example, there are nationalised schemes such as the government-run Canadian Pension Plan.

All of the funds from the Canadian Pension Plan are invested by Canada’s Pension Plan Investment Board, which operates with a clear mandate to maximise returns, without undue risk of loss.

Nationalising the superannuation industry in this way appears to have benefits – members would receive the same return for equal contributions, employers and employees would only have to deal with one fund, and the amount spent on running the fund (for example on administration, marketing) would be reduced.

There is also the option of adopting a combined system, as in Norway, which features both national and privately-run superannuation funds.

In reality however, given the coalition of vested interests that have forged Australia’s existing, publicly mandated, privatised system, only the voice of the members themselves can force an honest and open debate on this important issue.

Author: Suzanne Taylor, Lecturer/Co-Ordinator, Queensland University of Technology

Assets of world’s largest fund managers passes US$80 trillion for the first time

Total assets under management (AuM) of the world’s largest 500 managers grew to US$ 81.2 trillion in 2016, representing a rise of 5.8% on the previous year, according to latest figures from Willis Towers Watson’s Global 500 research.

Looking at the Australian players in the global list, Macquarie Group was in 52nd place with assets of US$362,511m, Colonial State was at 102 with US$147,154m, AMP Capital was at 120 with US$119,476m, BT Investment at 182 with US$60,699 and QIC at 193 with US$57,455m.

The research, which takes into account data up to the end of 2016, found that AuM for North American managers increased by 7.7% over the period and now stand at US$ 47.4 trillion, whilst assets managed by European managers, including the UK, increased by 2.8% to US$ 25.8 trillion. However, UK-based firms saw AuM decline for the second consecutive year, falling by 4.5% in 2016 to US$ 6.3 trillion.

Although the majority of total assets1 (78.4%) are still managed actively, its share has declined from 79.7% from end of last year as passive management continues to make inroads.

Luba Nikulina, global head of manager research at Willis Towers Watson, said: “It is encouraging to see a return to growth in total global assets, suggesting that managers are finding success in attracting investors towards innovative solutions to achieve superior risk-adjusted returns. Whilst passive assets remain significantly smaller than actively managed assets, the proportion of passively managed assets has grown from 16.5% to 21.6% over the last five years alone. We expect that this trend will continue to put downward pressure on traditional fee structures, particularly amongst active managers seeking to remain competitive and to maximise value to investors.”

The 20 largest asset managers experienced a 6.7% increase in AuM, which now stands at US$ 34.3 trillion, compared to US$ 26.0 trillion ten years ago and US$ 20.5 trillion in 2008. The share of total assets managed by this group of 20 largest managers increased for the third year in a row, rising from 41.9% in 2015 to 42.3% by the end of 2016. Despite this, the bottom 250 managers experienced a superior growth rate in assets managed, rising by 7.3% over the year.

As with previous years, equity and fixed income assets have continued to dominate, with a 78.7% share of total assets1 (44.3% equity, 34.4% fixed income), experiencing an increase of 3% combined during 2016. Continuing from the strong growth they experienced in 2015, assets1 in alternatives saw a 5.1% increase by the end of 2016, closely followed by equities at 4.1%.

Luba Nikulina said: “Alternatives continue to grow in popularity, with investors remaining under pressure to find effective means of diversification in an environment of lower expected returns from traditional asset classes. These strategies often come with greater complexity and require superior risk management. We see this as linked to the growth in assets managed by managers in the bottom half of our list, suggesting that investors favour smaller investment houses with specialist investment skills.”

“Our research has also highlighted awareness in sustainable investing, with 78% of the firms surveyed acknowledging a growing interest from their clients for these sorts of strategies as they continue to look for ways to add value for clients,” said Luba Nikulina.

Whilst BlackRock retains its position at the top of the manager rankings for the eighth consecutive year, further insight shows the main gainers, by rank, in the top 50 during the past five years include, Dimensional Fund Advisors (+31 [76 to 45]), Affiliated Managers Group (+20 [52 to 32]), Nuveen (+16 [36 to 20]), New York Life Investments (+15 [55 to 40]) and Schroder Investment Management, (+15 [59 to 44]).

The world’s largest money managers

Ranked by total assets under management, in U.S. millions, as of Dec. 31, 2016

Rank Manager Country Total assets
1 BlackRock U.S. $5,147,852
2 Vanguard Group U.S. $3,965,018
3 State Street Global U.S. $2,468,456
4 Fidelity Investments U.S. $2,130,798
5 Allianz Group Germany $1,971,211
6 J.P. Morgan Chase U.S. $1,770,867
7 Bank of New York Mellon U.S. $1,647,990
8 AXA Group France $1,505,537
9 Capital Group U.S. $1,478,523
10 Goldman Sachs Group U.S. $1,379,000
11 Prudential Financial U.S. $1,263,765
12 BNP Paribas France $1,215,482
13 UBS Switzerland $1,208,275
14 Deutsche Bank Germany $1,190,523
15 Amundi France $1,141,000
16 Legal & General Group U.K. $1,099,919
17 Wellington Mgmt. U.S. $979,210
18 Northern Trust Asset Mgmt. U.S. $942,452
19 Wells Fargo U.S. $936,900
20 Nuveen U.S. $881,748

Source: P&I/Willis Towers Watson World 500

Half Of Pre-Retirees Risk Significant Shortfalls

Almost half of Australians between the ages of 50 and 70 are at risk of falling short of a comfortable retirement, according to new research released by MLC.

The research explored the thoughts and habits of the “forgotten” low super balance Boomers, and revealed nearly half (43 per cent) of those surveyed admitted to having a superannuation balance of less than $100,000.

Additionally, 33 per cent of this age group reported having $50,000 or less in their super account, falling extremely short of what is recommended a single retiree needs for a comfortable retirement (over $545,000).

Lara Bourguignon, General Manager of Customer Experience, Superannuation at MLC, believes that all Australians should enjoy retirement – regardless of their financial situation.

“Australia has a high level of poverty among retirees, and we believe that super is one of the greatest tools we have to change this.”

“While these results are concerning, we want to remind people in this age group that it’s not too late for them to take action and better understand their holistic wealth position as they prepare for retirement.”

Ms Bourguignon said there are a number of steps Australians can take to maximise their super balance in their final years of work, and to structure their portfolios to make the most of what they do have when they’re in retirement.

“For example, we know some of the people in this age group have other assets such as property in their name beyond super, which is an important factor for them to consider when planning for retirement.”

“If they don’t have other assets, engaging with their super fund may prove to be a cost effective way for them to access advice in lieu of seeing a financial adviser,” Ms Bourguignon said.

Of those with a retirement saving of under $100,000, the research also revealed 42 per cent only became concerned about the balance of their retirement savings in their 50s, while over 30 per cent admitted they never checked their super balance.

“Sticking your head in the sand will often lead to unnecessary stress”.

Super fees set to become more transparent and easier to understand

ASIC says from 30 September there will be significant changes to the way superannuation and managed investment funds disclose the fees and charges that affect consumers.

The new requirement follows the Australian Securities and Investments Commission (ASIC) identifying a significant amount of under-reporting of fees, as well as considerable inconsistency in the way fees and charges are listed by funds. ASIC found this made it very difficult for consumers to understand how much they were paying, what they were paying for, and to compare funds.

The changes will help bring industrywide consistency to exactly what must be included in the product disclosure statement (PDS). And, from later in 2018, the changes will also ensure that the information in PDS and in periodic statements will match more clearly. As a result, consumers will be better able to understand the fees and costs. The consistency and more accurate disclosure of fees will also help ensure that funds are competing more fairly.

ASIC also noted that the fees consumers are being charged may reflect the type of investment, with some higher cost investments also bringing higher returns in the long term. This change to reporting will also make it easier for consumers to identify when this may be the case.

ASIC will make amendments to provide more certainty around the relevant requirements and undertake compliance checks throughout the industry, to ensure funds are meeting their obligations.

Following extensive consultation with industry on the introduction of these changes, ASIC has agreed to extend the deadline for disclosure of property operating costs in the investment fee or indirect costs to 30 September 2018. The extension on this component will help provide additional time for discussions between ASIC and industry about how to calculate these fees.

ASIC has also extended the deadline for certain disclosures in periodic statements that require changes to the internal systems of funds. This is to ensure the change can be made in a cost effective manner.  Those requirements will have effect for annual statements for the year ending 30 June 2018.

Background

These changes to reporting of superannuation and managed funds fees arise from ASIC’s concerns with inconsistency and underreporting of fees. This issue was investigated in Report 398 Fee and cost disclosure: Superannuation and managed investment products, which identified the following key issues:

  • underdisclosure of fees and costs associated with investing indirectly through other vehicles
  • tax treatment of fees and costs
  • performance fees
  • under disclosure of management costs

Following the release of Report 398, in November 2015 ASIC issued updated Regulatory Guide 97 Disclosing fees and costs in PDSs and periodic statements to bring greater consistency and transparency to fees reporting. These changes are due to come into force from 30 September 2017, as outlined above.