Global Dividends Were Higher in 2017 (Australia Up 9.7%)

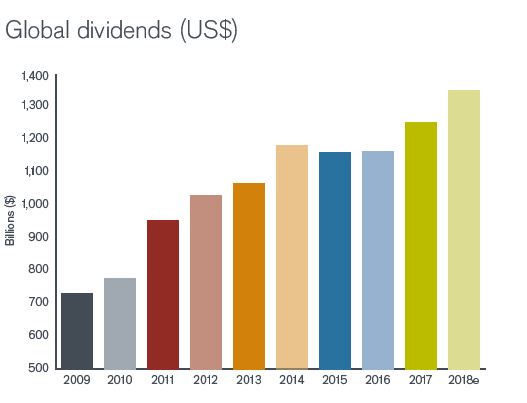
A strengthening world economy and rising corporate confidence pushed global dividends to a new high in 2017, according to the latest Janus Henderson Global Dividend Index. They rose 7.7% on a headline basis, the fastest rate of growth since 2014, and reached a total of $1.252 trillion.

Underlying growth, which adjusts for movements in exchange rates, one-off special dividends and other factors, was an impressive 6.8%, and showed less divergence than in previous years across the different regions of the world, reflecting the broadly based global economic recovery.

Every region of the world and almost every industry saw an increase. Moreover, records were broken in 11 of the index’s 41 countries, among them the United States, Japan, Switzerland, Hong Kong, Taiwan, and the Netherlands.

In Australia, dividends rose to $53.3bn, an increase of 9.7% on an underlying basis. The big story was the return of the mining companies, following rapid improvements in their profits and balance sheet. Between them, BHP and Rio Tinto added $2.9bn, accounting for two-thirds of all Australia’s dividend growth.

Among the banks, which pay more than half of all Australian dividends, and which have very high payout ratios, only Commonwealth Bank increased slightly year-on-year. Even so, no Australian company in our index cut its dividend, though QBE Insurance further reduced the tax credit it was able to provide, meaning that investors received less year-on-year after tax.

In 2017, CBA was the world’s 13th dividend payer (down from 12th the previous year), the only Australian firm in the top 20 according to the JH research.

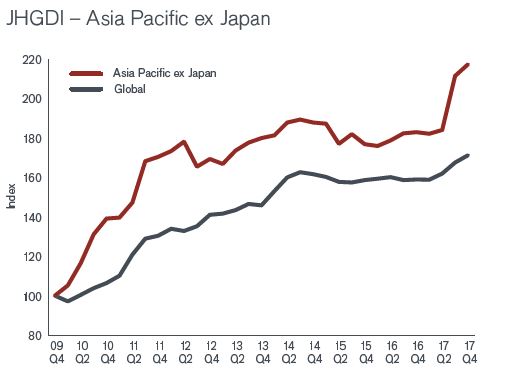
2017 was a record year for Asia Pacific ex Japan. The total paid
jumped 18.8% to $139.9bn, boosted by exceptionally large special dividends in Hong Kong, of which the biggest by far was from China Mobile. Even allowing for these, and other factors elsewhere in the region, underlying growth was impressive at 8.6%. The jump in dividends paid in the region was just enough to push it ahead of North America as the fastest growing region since 2009.

They say that strong earnings growth around the world in 2018 will support continued dividend increases, with 6.1% underlying growth, with every region seeing an increase, plus a weaker dollar means expected headline growth of 7.7%, bringing total global dividends of $1.348 trillion in 2018.

Methodology.

Each year Janus Henderson analyses dividends paid by the 1,200 largest firms by market capitalisation (as at 31/12 before the start of each year). Dividends are included in the model on the date they are paid. Dividends are calculated gross, using the share count prevailing on the pay-date (this is an approximation because companies in practice fix the exchange rate a little before the pay date), and converted to USD using the prevailing exchange rate.


Housing Affordability and Employment – The Property Imperative Weekly 27 Jan 2018

Housing in Australia is severely unaffordable, and despite the growth in jobs, unemployment in some centres is rising. We look at the evidence. Welcome the Property Imperative Weekly to 27th January 2018.

Thanks to checking out this week’s edition of our property and finance digest.   Watch the video or read the transcript.

Today we start with employment data. CommSec looked at employment across regions over the last year. Despite the boom in jobs, the regional variations are quite stark, with some areas showing higher rates of unemployment, and difficult economic conditions. Unemployment has increased in several Queensland regional centres in recent years. Queensland’s coastal regional centres such as Bundaberg, Gympie, Bundaberg and Hervey Bay, known more broadly as Wide Bay (average 9.0 per cent), together with Townsville (albeit lower at 8.5 per cent) have elevated jobless rates. Unemployment also increased along the suburban fringes and city ‘spines’ such as Ipswich (8.1 per cent) in Brisbane and the western suburbs of Melbourne (9.0 per cent). In Western Australia, Mandurah, south of Perth, experienced a significant decline in the jobless rate to an average of 7.0 per cent in December from 11.2 per cent a year ago. Higher income metropolitan areas, especially in Sydney’s coastal suburbs, dominate the regions with the lowest unemployment rates. However, the corridor between Broken Hill and Dubbo has Australia’s lowest regional unemployment rate at 2.9 per cent, benefitting from agricultural, tourism and mining-related jobs growth. You will find there is a strong correlation with mortgage stress, as we will discuss next week.

The Victorian Government has reaffirmed their intent to shortly accept applications for its shared equity scheme known as HomesVic from up to 400 applicants. We do not think such schemes help affordability, they simply lift prices higher, but looks good politically.  This was first announced in March 2017. The $50-million pilot initiative aims to make it easier for first-home buyers to enter the market by reducing the size of their loan, hence reducing the amount they need to save for a deposit. The initiative targets single first-home buyers earning an annual income of less than $75,000 and couples earning less than $95,000. Eligible applicants must buy in so-called “priority areas” which include 85 Melbourne suburbs, seven fringe towns and 130 regional towns and suburbs. In Melbourne, the list includes suburbs around Box Hill, Broadmeadows, Dandenong, Epping, Fishermen’s Bend, Footscray, Fountain Gate, Frankston, LaTrobe, Monash, Pakenham, Parkville, Ringwood, Sunshine and Werribee. Regional centres on the list include Ballarat, Bendigo, Castlemaine, Geelong, La Trobe, Mildura, Seymour, Shepparton, Wangaratta, Warrnambool and Wodonga. The state government said the locations were chosen in growth areas where there was a high demand for housing and access to employment and public transport. Some of these locations are where mortgage stress, on our modelling is highest – we will release the January results next week. The scheme is not available in most of Melbourne’s bayside suburbs, the leafy inner eastern suburbs or some pockets of the inner north.

Overseas, the US Mortgage Rates continue to rise, heading back to the worst levels in more than 9 months.  Rates have risen an eighth of a percentage point since last week, a quarter of a point from 2 weeks ago, and 3/8ths of a point since mid-December.  That makes this the worst run since the abrupt spike following 2016’s presidential election. While this doesn’t necessarily mean that rates will continue a linear trend higher in the coming months, the trajectory is up, reflecting movements in the capital markets, and putting more pressure on funding costs globally.

The Bank for International Settlements (BIS) has published an important reportStructural changes in banking after the crisis“. The report highlights a “new normal” world of lower bank profitability, and warns that banks may be tempted to take more risks, and leverage harder in an attempt to bolster profitability. This however, should be resisted. They also underscore the issues of banking concentration and the asset growth, two issues which are highly relevant to Australia. The report says that in some countries the 2007 banking crisis brought about the end of a period of fast and excessive growth in domestic banking sectors.  Worth noting the substantial growth in Australia, relative to some other markets and of particular note has been the dramatic expansion of the Chinese banking system, which grew from about 230% to 310% of GDP over 2010–16 to become the largest in the world, accounting for 27% of aggregate bank assets.

Back home, an ASIC review of financial advice provided by the five biggest vertically integrated financial institutions (the big four banks and AMP) has identified areas where improvements are needed to the management of conflicts of interest. 68% of clients’ funds were invested in in-house products. ASIC also examined a sample of files to test whether advice to switch to in-house products satisfied the ‘best interests’ requirements. ASIC found that in 75% of the advice files reviewed the advisers did not demonstrate compliance with the duty to act in the best interests of their clients. Further, 10% of the advice reviewed was likely to leave the customer in a significantly worse financial position. This highlights the problems in vertically integrated firms, something which the Productivity Commission is also looking at. The real problem is commission related remuneration, and cultural norms which put interest of customers well down the list of priorities.

The Financial Services Royal Commission has called for submissions, demonstrating poor behaviour and misconduct. It will hold an initial public hearing in Melbourne on Monday 12 February 2018. The not-for-profit consumer organisation, the Consumer Action Law Centre (CALC) said the number of Aussie households facing mortgage stress has “soared” nearly 20 per cent in the last six months, and argued that lenders are to blame. Referencing Digital Finance Analytics’ prediction that homes facing mortgage stress will top 1 million by 2019, CALC said older Australians are at particular risk. The organisation explained: “Irresponsible mortgage lending can have severe consequences, including the loss of the security of a home. “Consumer Action’s experience is that older people are at significant risk, particularly where they agree to mortgage or refinance their home for the benefit of third parties. This can be family members or someone who holds their trust.” Continuing, CALC said a “common situation” features adult children persuading an older relative to enter into a loan contract as the borrower, assuring them that they will execute all the repayments. “[However] the lack of appropriate inquiries into the suitability of a loan only comes to light when the adult child defaults on loan repayments and the bank commences proceedings for possession of the loan in order to discharge the debt,” CALC said. We think poor lending practice should be on the Commissions Agenda, and we will be making our own submission shortly.

The latest 14th edition of the Annual Demographia International Housing Affordability Survey: 2018, continues to demonstrate the fact that we have major issues here in Australia. There are no affordable or moderately affordable markets in Australia. NONE! Sydney is second worst globally in terms of affordability after Hong Kong, with Melbourne, Sunshine Coast, Gold Coast, Geelong, Adelaide, Brisbane, Hobart, Perth, Cains and Canberra all near the top of the list. You can watch our separate video where we discuss the findings and listen to our discussion with Ben Fordham on 2GB.  When this report comes out each year, we get the normal responses from industry, such as Australia is different or the calculations are flawed. I would simply say, the trends over time show the relative collapse in affordability, and actually the metrics are well researched.

Fitch Ratings published its Global Home Prices report. They say price growth is expected to slow in most markets and risks are growing as the prospect of gradually rising mortgage rates comes into view this year. Their data on Australia makes interesting reading. Fitch expects Sydney and Melbourne HPI to stabilise in 2018, due to low interest rates, falling rental yields, increasing supply, limited investment alternatives and growing dwelling completions, partially offset by high population growth. Fitch expects the increase in FTB to be temporary; low income growth, tighter underwriting and rising living costs will maintain pressure on affordability for FTB. As mortgage rates are currently low, any material rate rise will weigh further on mortgage affordability and serviceability. The rising cost of living and sluggish wage growth are likely to increase pressure on recent borrowers who have little disposable income. Fitch expects mortgage lending growth to slow to around 4% in 2018, based on continued record low interest rates and stable unemployment. This will once again be offset by continued underemployment, reduced investor demand and tougher lending practices.

Finally, the latest weekly data from CoreLogic underscores the weakness in the property market. First prices are drifting lower, with Sydney down 0.4% in the past week and Melbourne down 0.1%.  The indicator of mortgage activity is also down, suggesting demand is easing as lending rules tighten. But then we always have a decline over the summer break. The question is, are we seeing a temporary blip, over the holiday season, or something more structural? We think the latter is more likely, but time will tell.

So that’s the Property Imperative Weekly to 27th January 2018. If you found this useful, do like the post, add a comment and subscribe to receive future editions. Many thanks for taking the time to watch.



Saving Less, Income Flat, Home Ownership Dream Fading – MLC

The latest MLC Wealth Sentiment Survey contains further evidence of the pressure on households and their finances.

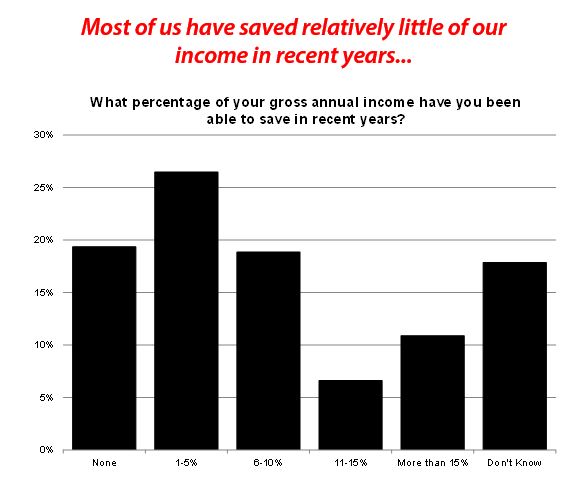
Being able to save has been a challenge for a number of Australians – almost 1 in 5 of us have been unable to save any of our income in recent years, and for more than 1 in 4 of us only 1-5%.

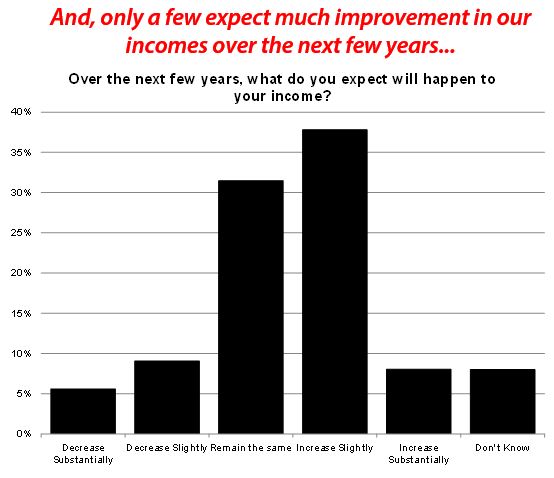
Expectations for future income growth are very conservative – nearly 1 in 3 Australians expect no change in income over the next few years and 15% expect it to fall.

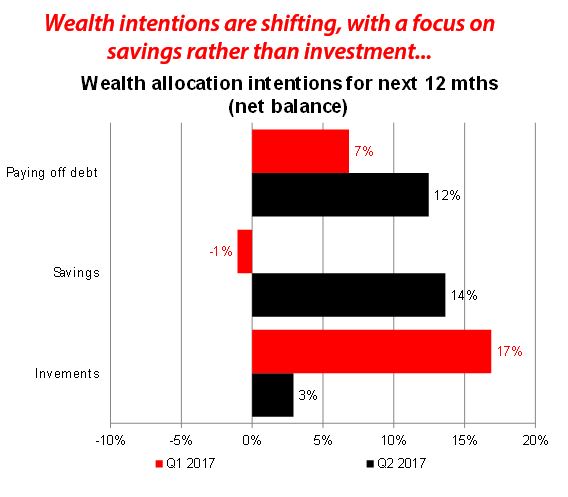
So, not surprisingly, our savings expectations for the future are also very conservative – with more than 1 in 5 Australians believing their savings will fall.

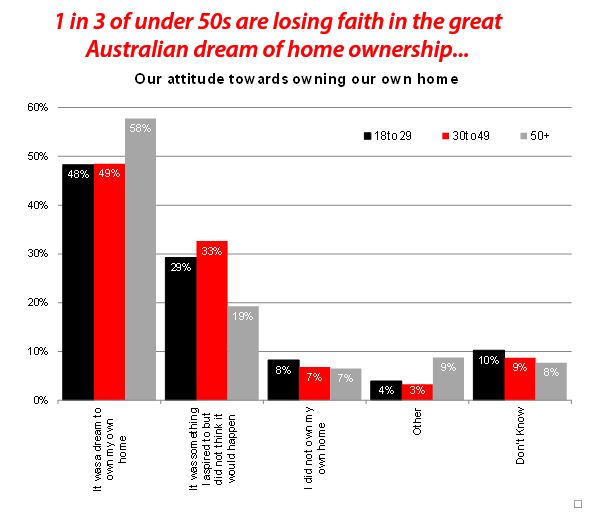
The “great Australian dream” of home ownership is still a reality for many, but for some it’s just a dream – fewer than 1 in 10 Australians said they didn’t want to own their own home, but 1 in 4 said home ownership was something they aspired to but did not think it would happen. Young people still have broadly similar aspirations around home ownership as middle-aged Australians.

Most of us wait and save more before buying our first home and many are prepared to buy some way out of the city – almost 1 in 3 would/did wait longer to have a bigger deposit, and 1 in 4 would live in a suburb some way out of the city to purchase their first home. Around 16% would live in an apartment and 12% further away from work and family or a regional area.

Most Australians don’t plan to or are unwilling to use the family home to fund their retirement – only 18% would be willing to use the family home to fund their retirement either by selling it or using part of their home as equity. The average Australian home owner has around $547,000 of equity in the family home.

ANZ completes simplification of Wealth Australia

ANZ today announced it has completed the simplification of its Wealth Australia division with the sale of its life insurance business to Zurich Financial Services Australia. The sale is comprised of two transactions with total proceeds of $2.85 billion, inclusive of $1 billion of upfront reinsurance commission from Zurich.

This follows the sale of its OnePath pensions and investments (OnePath P&I) and aligned dealer groups (ADG) business to IOOF Holdings Limited (IOOF) in October for $975 million. Total proceeds from the simplification of Wealth Australia is $3.83 billion.

Following completion, Zurich will be Australia’s largest retail life insurer as measured by in-force premiums with more than 1.5 million customers, while IOOF will have a top-five superannuation platform with the second largest aligned financial advice network.

Here is an interview with CEO Shayne Elliott and Andrew Cornell.

Life Insurance Transaction Scope:

  • 100% of One Path Life Australia Holdings Pty Limited (OPL)
  • As at 30 September 2017, total life in-force premiums were $1.7bn
  • Transaction does not include New Zealand and ANZ will retain Lenders Mortgage Insurance, General Insurance distribution and Financial Planning

Life Insurance Transaction Summary:

  • Total proceeds of $2.85 billion include $1 billion of upfront reinsurance commission from Zurich to ANZ and $1.85 billion for 100% of the life business
  • Annual profit of business is $189 million on a 2017 pro forma cash NPAT basis
  • Equates to a 2017 Price/Embedded Value of 1.0×3, 15.1x 2017 Price/Earnings on a pro forma cash NPAT basis
  • Carrying value of $3.38 billion. Estimated accounting loss on sale of ~$520 million post separation and transaction costs of ~$75 million post-tax and release of available for sale reserve
  • Expected to increase ANZ’s consolidated CET1 capital ratio by a total of ~$2.5 billion or ~65 basis points4 (~25 basis points upon completion of the reinsurance arrangement and a further ~40 basis points on completion)
  • The transaction would be broadly EPS and ROE neutral if capital released is returned to shareholders

Combined Transaction Summary:

  • Total proceeds of $3.83 billion for combined sales
  • Equates to 16.8x Price/Earnings on a pro forma cash NPAT basis
  • Combined sales to increase ANZ’s consolidated CET1 capital ratio by ~80 basis points

Capital released following reinsurance and completion of the life insurance sale is expected to increase ANZ’s consolidated CET1 capital ratio by ~65 basis points and largely be surplus to ANZ’s unquestionably strong requirements.

The sale is another step in ANZ’s strategy to create a simpler, better balanced bank focussed on retail and business banking in Australia and New Zealand, and Institutional Banking supporting client trade and capital flows across the region.

As part of the agreement, ANZ and Zurich will enter into a 20–year strategic alliance to offer life insurance solutions through ANZ’s distribution channels.

With a long history in Australia and a presence in more than 210 countries and territories, Zurich is a highly regarded insurance company with global capability in providing life insurance solutions to more than 60 million customers in partnership with 70 banks in 17 countries, including Santander, Citibank, HSBC, and ING.

ANZ Group Executive Wealth Australia Alexis George said: “From the outset we’ve been focussed on partnering with a high-quality organisation culturally aligned to ANZ and we’re pleased we will be able to provide our customers with access to wealth products from one of the world’s leading and most respected global insurers.”

“Zurich’s experience in working with banks around the world to provide insurance solutions, combined with its commitment to innovation and strong presence in Australia is a good outcome for our customers, shareholders and distribution partners.

“Partnering with Zurich is the best outcome for ANZ customers given it will become Australia’s leading life insurer with the scale to invest in product and digital innovation.

“This transaction will complete the simplification of ANZ’s Australian wealth business, however we will continue to work hard to minimise any disruption to our customers during the transition,” said Ms George said.

There are no changes to any current insurance policies as a result of today’s announcement, including general insurance products provided via QBE.

ANZ expects completion to occur in late 2018 together with the recently announced sale to IOOF of the Group’s Pensions & Investments and Aligned Dealer Group businesses. The transaction, including the reinsurance, remains subject to regulatory approval.

AMP launches custom-built financial advice modelling technology

AMP has today launched a new goals-modelling engine, creating the most sophisticated and contemporary advice experience in the industry.

The engine represents a majorstep forward in AMP’s goals-based customer strategy.

Now part of AMP’s Goals 360 experience delivered through AMP Advice, the engine provides customers with clarity on how the choices they make today impact their ability to achieve their goals over time.

Purpose-built stochastic modelling, developed with leading analytics and technology firm Milliman, factors in economic and market conditions to generate advice strategies to provide customers a projected achievability of their goals.

Tailored cashflow, debt, wealth protection and other wealth management advice strategies are generated in real-time and presented through a seamless, interactive digital experience, developed using human-centred design.

AMP’s Group Executive Wealth Solutions & Chief Customer Officer, Paul Sainsbury said the launch of the modelling engine is a landmark moment for the financial advice industry and the latest step in AMP’s transformation of the goals-based advice experience.

“The engine is the culmination of a multi-year investment program to build AMP’s advice capability of the future,” commented Mr Sainsbury.

“We’ve custom built the engine around goals because we know that when delivered well, goals-based advice transforms the lives of our customers.

“The engine now forms an integral part of AMP’s Goals 360 – a contemporary advice experience for advisers and their customers.

“Underpinned by the latest in financial modelling capability, the engine demonstrates to customers in a visual and engaging way how the choices they make today impact the ability to achieve their goals over time.

“For advisers, it supports richer conversations and helps build stronger relationships with their clients. The engine also creates a more efficient process for advisers – reducing their cost to serve and allowing for ease of compliance.”

The goals engine is being progressively rolled out to AMP Advice practices from this week.

An overview of AMP’s Goals 360 experience, including the goals-engine, follows.

The Goals 360 experience – overview

Explore

The first step in Goals 360 is goals exploration.

Guided by a goals coach, customers talk about what really matters to them and what they’d most like to achieve. The result is the goals summary.

At the next meeting with their adviser, planning becomes much more comprehensive. Customers are asked to reconfirm their goals and discuss them in detail.

Plan

Customers and advisers then start to model different paths to achieving their goals, and it’s this conversation that has been radically transformed by the new modelling engine – in a highly visual, personalised and interactive way.

Different scenarios can be modelled in front of the client in a way that’s easy to understand. For example, if no changes are made to current behaviour, customers can immediately see the effect on the ‘achievability’ of their goals – represented visually by the bar chart in the top right corner of the goal card.

By selecting different advice strategies that align with the unique goals of the customer the adviser can efficiently model scenarios – enabling a better conversation with customers as they work through options in real time.

The modelling engine can project a client’s balance sheet and cashflows, both stochastically and deterministically, accounting for Australian tax, superannuation and social security rules and regulations, with the flexibility to incorporate multiple future goals of a client.

Track

The engine supports ongoing conversations to track goal achievability as goals evolve and financial circumstances change.


Banks Pay More Than Half Of All Dividends In Australia

Data from the latest Janus Henderson Global Dividend Index  reveals that Australia’s banks pay $6 out of every $11 of the country’s dividends each year but dividends are growing slowly given already high payout ratios.

Leading is Commonwealth Bank which raised its per share payout 3.7 per cent on the back of steady profit growth, but National Australia, Westpac and ANZ all held their dividends flat.

CBA and Westpac were identified in the report as the world’s fourth and sixth biggest dividend payers respectively, with Chinese and Taiwanese technology and manufacturing companies taking the top three place.

Overall, Australian dividends typically peaked in the third quarter and this year was no different. Payouts jumped to a record $22.8 billion, up 17.0 per cent on a headline basis, boosted by a stronger Australian dollar. But resources apart, dividend growth in Australia was  sluggish.

More broadly, the headline growth of global dividends in Q3 2017 jumped by 14.5 per cent to US$328.1 billion and underlying growth was 8.4%, the fastest in nearly 2 years. Data is to 30th Sept 2017.

The Asia-Pacific region led with dividends up 36.2% to $69.6illion, equivalent to an underlying increase of 121%.  China Mobile accounted for almost half of the region’s headline increase and three-quarters of Hong Kong’s with a huge $8.4 billion special, the largest single payment in the world in Q3, helping Hong Kong’s total dividends reach a record $25.2 billion.

While every region saw global dividends increase, payment records were broken in Australia, Hong Kong and Taiwan.

They say that after record second and third quarters, the world’s listed companies are comfortably on course to deliver the highest ever annual total this year. They expect 2017 dividends of $1.249 trillion, an increase of 7.4%, which is $91 billion higher than their previous estimate.

Note all figures are in US$.

Charles Schwab Re-enters Australian Market

From Investor Daily.

American wealth management giant Charles Schwab Corporation has re-opened an office in Sydney after exiting the Australian market in 2000.

The San Francisco-headquartered financial advice firm, custodian and brokerage has “re-established” its presence in Australia following the acquisition of Chicago-based “broker-dealer” optionsXpress.

Charles Schwab Australia managing director JP Drysdale told InvestorDaily the decision to re-enter the Australian market was due to growth of SMSFs in Australia that exhibited the “clear demand for self-directed investment opportunities”.

“The acquisition and integration of the optionsXpress business presented opportunities in both the Australian and Singapore markets,” Mr Drysdale said.

“The time was right to enter both, to give investors in both markets the ability to trade in US markets through a platform that’s cost effective, secure and time-tested.”

Prior to 2000, Charles Schwab had an Australian presence but decided to physically exit the market due to a “range of market circumstances at that time”.

Where optionsXpress only offered an online trading platform, Charles Schwab had the capacity to cater to the needs of Australian investors more broadly, Mr Drysdale said.

“Globally, Charles Schwab is a wealth management and advisory firm that focuses on helping clients invest for their future,” Mr Drysdale told InvestorDaily.

“This is a far broader approach to customers investing needs than optionsXpress.

“Charles Schwab Australia is now in a position to assist many more Australians who need to manage they investments and diversify in the US, but don’t see themselves as short-term traders.”

Through its electronic trading platform, the broker firm will offer Australian investors access to US-listed equities, offshore mutual funds, ETFs, fixed income, options and futures at US$4.95 per online equity trade.

He added that local investors, through a variety of channels, were now able to have cost effective access to the US market.

“Typically, access to US markets for self-directed investors, including SMSFs, is expensive compared to the costs of transacting in the Australian market,” he said.

“However, we believe there need not be trade-offs between price and customer service.

“From the high-quality research content mentioned above to the ability for clients to pick up the phone and talk to a financial consultant, Charles Schwab provides many ways for clients to access investment experts.

“We see our role as working with clients to help them develop a strategy for increasing the diversity of their investments and therefore managing the risk in their portfolios.”

Global Wealth Higher, But More Uneven

According to the eighth edition of the Credit Suisse Research Institute’s Global Wealth Report, in the year to mid-2017, total global wealth rose at a rate of 6.4%, the fastest pace since 2012 and reached USD 280 trillion. This reflected widespread gains in equity markets matched by similar rises in non-financial assets (home prices), which moved above the pre-crisis year 2007’s level for the first time this year.

Wealth growth also outpaced population growth, so that global mean wealth per adult grew by 4.9% and reached a new record high of USD 56,540 per adult.

House price movements are a rough proxy for the non-financial component of household assets, and here most countries experienced a rise in values last year, although Japan (–1%) and Russia(–5%) were among the exceptions.

This year, the report includes a focus on Millennials’ wealth position and provides a comparison with earlier generations. They are not faring well, “Millennials are not only likely to experience greater challenges in building their wealth over time, but also greater wealth inequality than previous generations.”

Australia

Household wealth in Australia grew at a fast pace between 2000 and 2012 in US dollar terms, except for a short interruption in 2008. The average annual growth rate of wealth per adult was 12%, with about half the rise due to exchange-rate appreciation against the US dollar. The exchange rate effect went into reverse for three years after 2012 and, like other resource-rich countries, Australia was badly hit by sagging commodity prices. Despite that slowdown, Australia’s wealth per adult in 2017 is USD 402,600, the second highest in the world after Switzerland.

The composition of household wealth in Australia is heavily skewed towards non financial assets, which average USD 303,200, and form 60% of gross assets. The high level of real assets partly reflects a large endowment of land and  natural resources relative to population, but also results from high property prices in the largest cities.

Wealth inequality is relatively low in Australia, as reflected in a Gini coefficient of just 65% for wealth. Only 5% of Australians have net worth below USD 10,000. This compares to 19% in the UK and 29% in the USA. Average debt amounts to 20% of gross assets. The proportion of those with wealth above USD 100,000, at 68%, is the fourth highest of any country, and almost eight times the world average. With 1,728,000 people in the top 1% of global wealth holders, Australia accounts for 3.5% of this top slice, despite being home to just 0.4% of the world’s adult population.

Global Summary

We further saw an increase of 2.3 million US-dollar-millionaires, almost half of whom reside in the United States. Partially due to a 3% rise in the value of euro against the US dollar, we also note 620,000 new dollar-millionaires in the main Eurozone countries Germany, France, Italy and Spain. Another 200,000 joined in Australia and about the same number appeared in China and India together. We have seen a decline in millionaire numbers in very few countries, mostly associated with depreciating currencies: the United Kingdom lost 34,000 and Japan lost over 300,000.

Our home market Switzerland has seen wealth per adult increase by 130% to USD 537,600 since the turn of the century and continues to lead the global rankings. Again, we note that a large part of the rise is associated with the appreciation of the Swiss franc against the US dollar between 2001 and 2013. Nonetheless, measured in Swiss francs, domestic household wealth rose by 35% since 2000, which corresponds to an average annual rate of 1.8%. Switzerland today accounts for 1.7% of the top 1% of global wealth holders and over two-thirds of Swiss adults have assets above USD 100,000. 8.8% of Swiss are US-dollar millionaires and an estimated 2,780 individuals are in the ultra-high net worth bracket, with wealth over USD 50 million.

Financial assets continue to make up 54% of gross wealth in Switzerland, which is less than in Japan or the United States and debts average USD 140,500 per adult, which is one of the highest absolute levels in the world, although we continue to believe that the debt ratio reflects the country’s high level of financial development, rather than excessive borrowing.

On the worrying end, among the ten countries for which long series of wealth distribution are available, Switzerland is alone in having seen no significant reduction in wealth inequality over the past century.

Looking at the bottom of the wealth distribution, 3.5 billion people – corresponding to 70% of all adults in the world – own less than USD 10,000.

Those with low wealth tend to be disproportionately found among the younger age groups, who have had little chance to accumulate assets, but we find that Millennials face particularly challenging  circumstances compared to other generations.

Although relatively less severe in some emerging markets, capital losses during 2008–2009, high unemployment, tighter mortgage rules, growing house prices, increased income inequality, less access to pensions and lower income mobility have dealt serious blows to young workers and savers and hold back wealth accumulation by the Millennials in many countries. With the baby boomers occupying most of the top jobs and much of the housing, Millennials are doing less well than their parents at the same age, especially in relation to income, home ownership and other dimensions of wellbeing assessed in this report. While Millennials are more educated than preceding generations (we see an increase of more than 20% in tertiary education across OECD countries), we expect only a minority of high achievers and those in high-demand sectors such as technology of finance to effectively overcome the “millennial disadvantage.”

We also note that entrepreneurship, as measured by the fraction of self-employed workers, has been declining across OECD countries since the turn of the century, including Millennials who are generally touted as a generation of entrepreneurs.

Top 20 Fund Managers By Country

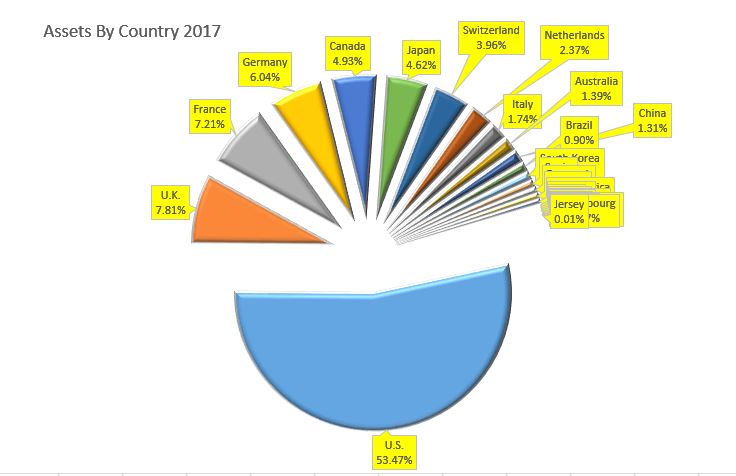
Following this mornings data on the top 500 Fund Managers, which has passed US$80 trillion under management in 2016 (contained in the 2017 report) and which helps to explain the inflated asset prices of property and the stock market; it is worth looking at the country break down by percentage of funds under management, all stated in US$.

More than half of assets are held by managers in the USA, followed in descending order by UK, France, Germany, Canada and Japan. Australia has 1.39% of assets, but that may be overstated as this includes Macquarie who has more business off shore than on shore.

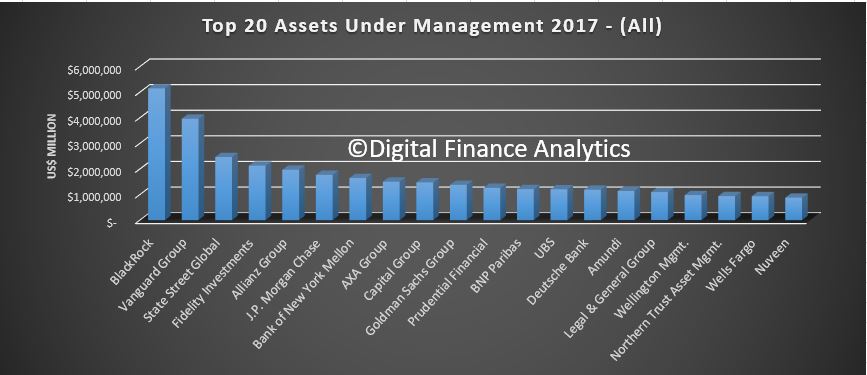
Here are the top 20 globally, by manager. Black Rock is by far the largest.

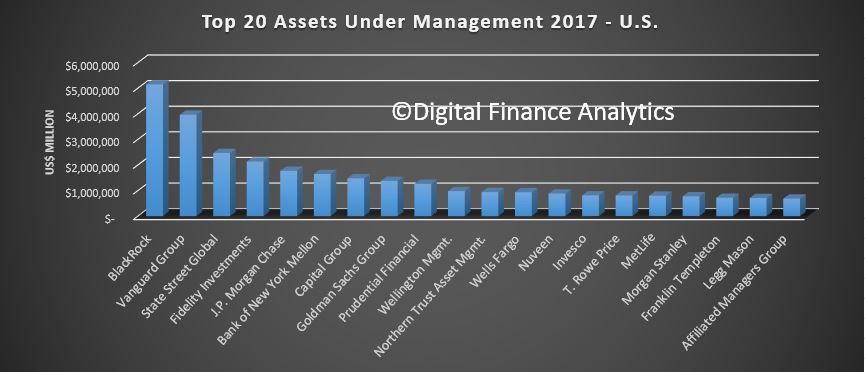
Here are the top 20 from the USA.

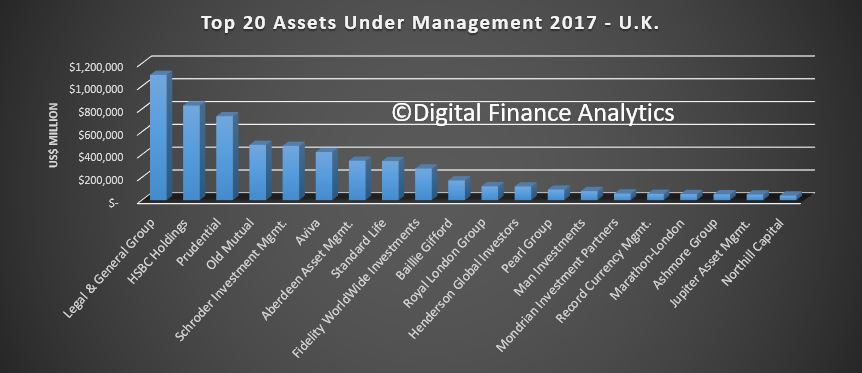
Here are the top 20 from the UK.

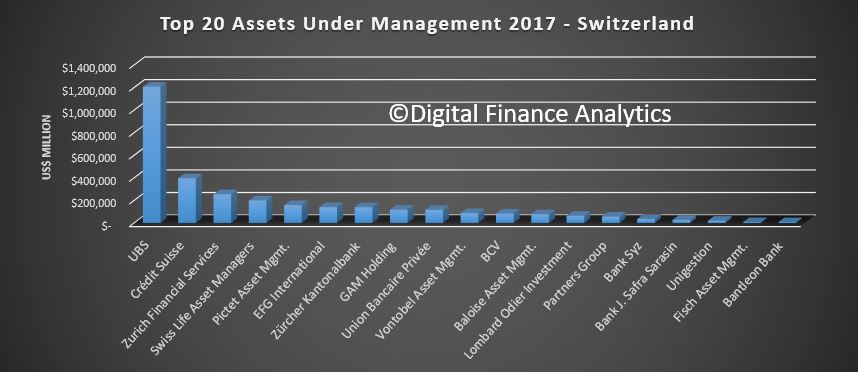
Switzerland is dominated by funds managed by UBS.

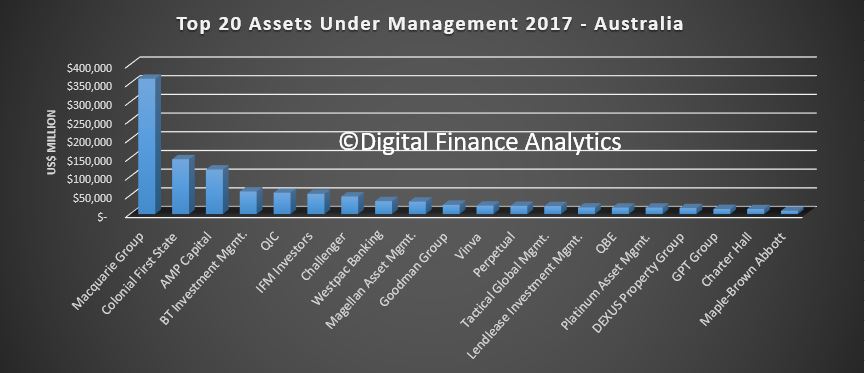
Here are the Australian top 20.

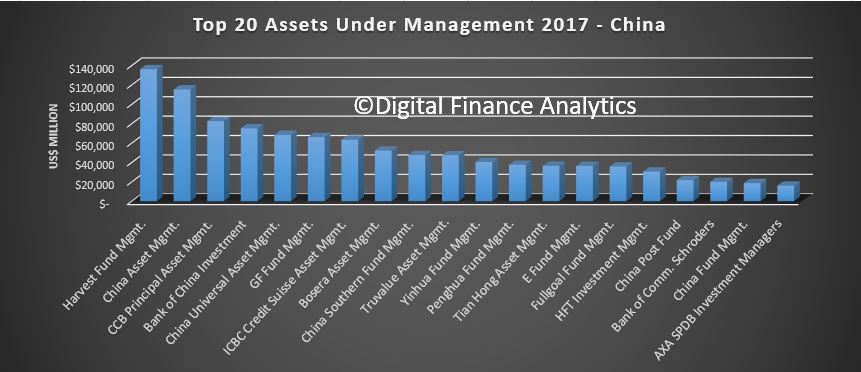
Finally, here is the China footprint – given the wealth accumulation there, I have little doubt they will be overtaking Australia, and moving well up the rankings in the years ahead.


Assets of world’s largest fund managers passes US$80 trillion for the first time

Total assets under management (AuM) of the world’s largest 500 managers grew to US$ 81.2 trillion in 2016, representing a rise of 5.8% on the previous year, according to latest figures from Willis Towers Watson’s Global 500 research.

Looking at the Australian players in the global list, Macquarie Group was in 52nd place with assets of US$362,511m, Colonial State was at 102 with US$147,154m, AMP Capital was at 120 with US$119,476m, BT Investment at 182 with US$60,699 and QIC at 193 with US$57,455m.

The research, which takes into account data up to the end of 2016, found that AuM for North American managers increased by 7.7% over the period and now stand at US$ 47.4 trillion, whilst assets managed by European managers, including the UK, increased by 2.8% to US$ 25.8 trillion. However, UK-based firms saw AuM decline for the second consecutive year, falling by 4.5% in 2016 to US$ 6.3 trillion.

Although the majority of total assets1 (78.4%) are still managed actively, its share has declined from 79.7% from end of last year as passive management continues to make inroads.

Luba Nikulina, global head of manager research at Willis Towers Watson, said: “It is encouraging to see a return to growth in total global assets, suggesting that managers are finding success in attracting investors towards innovative solutions to achieve superior risk-adjusted returns. Whilst passive assets remain significantly smaller than actively managed assets, the proportion of passively managed assets has grown from 16.5% to 21.6% over the last five years alone. We expect that this trend will continue to put downward pressure on traditional fee structures, particularly amongst active managers seeking to remain competitive and to maximise value to investors.”

The 20 largest asset managers experienced a 6.7% increase in AuM, which now stands at US$ 34.3 trillion, compared to US$ 26.0 trillion ten years ago and US$ 20.5 trillion in 2008. The share of total assets managed by this group of 20 largest managers increased for the third year in a row, rising from 41.9% in 2015 to 42.3% by the end of 2016. Despite this, the bottom 250 managers experienced a superior growth rate in assets managed, rising by 7.3% over the year.

As with previous years, equity and fixed income assets have continued to dominate, with a 78.7% share of total assets1 (44.3% equity, 34.4% fixed income), experiencing an increase of 3% combined during 2016. Continuing from the strong growth they experienced in 2015, assets1 in alternatives saw a 5.1% increase by the end of 2016, closely followed by equities at 4.1%.

Luba Nikulina said: “Alternatives continue to grow in popularity, with investors remaining under pressure to find effective means of diversification in an environment of lower expected returns from traditional asset classes. These strategies often come with greater complexity and require superior risk management. We see this as linked to the growth in assets managed by managers in the bottom half of our list, suggesting that investors favour smaller investment houses with specialist investment skills.”

“Our research has also highlighted awareness in sustainable investing, with 78% of the firms surveyed acknowledging a growing interest from their clients for these sorts of strategies as they continue to look for ways to add value for clients,” said Luba Nikulina.

Whilst BlackRock retains its position at the top of the manager rankings for the eighth consecutive year, further insight shows the main gainers, by rank, in the top 50 during the past five years include, Dimensional Fund Advisors (+31 [76 to 45]), Affiliated Managers Group (+20 [52 to 32]), Nuveen (+16 [36 to 20]), New York Life Investments (+15 [55 to 40]) and Schroder Investment Management, (+15 [59 to 44]).

The world’s largest money managers

Ranked by total assets under management, in U.S. millions, as of Dec. 31, 2016

Rank Manager Country Total assets
1 BlackRock U.S. $5,147,852
2 Vanguard Group U.S. $3,965,018
3 State Street Global U.S. $2,468,456
4 Fidelity Investments U.S. $2,130,798
5 Allianz Group Germany $1,971,211
6 J.P. Morgan Chase U.S. $1,770,867
7 Bank of New York Mellon U.S. $1,647,990
8 AXA Group France $1,505,537
9 Capital Group U.S. $1,478,523
10 Goldman Sachs Group U.S. $1,379,000
11 Prudential Financial U.S. $1,263,765
12 BNP Paribas France $1,215,482
13 UBS Switzerland $1,208,275
14 Deutsche Bank Germany $1,190,523
15 Amundi France $1,141,000
16 Legal & General Group U.K. $1,099,919
17 Wellington Mgmt. U.S. $979,210
18 Northern Trust Asset Mgmt. U.S. $942,452
19 Wells Fargo U.S. $936,900
20 Nuveen U.S. $881,748

Source: P&I/Willis Towers Watson World 500