
The Bank of England just published an interesting report on household finances. There are some interesting parallels with Australia.
The Frame’s The Thing…
A deeply philosophical discussion with Adam Stokes about how we see the world. Perhaps one of my most important posts ever…
Prepare for some mind-stretching conversations about how we look at the world and what it means for comprehension and analysis (and why people often ignore new concepts and ideas).
Some useful links:
https://philosophynow.org/issues/90/Plato_A_Theory_of_Forms
https://www.psychologytoday.com/au/blog/hide-and-seek/201508/the-psychology-self-deception
https://www.nytimes.com/1985/05/12/magazine/insights-into-self-deception.html
All Hands On Deck To Calm The Repo Market!
It’s crunch time for the FED as we approach the end of the year.
Is Bitcoin The New Property Market?
I discuss all things Crypto with the co-founder of one of Australia’s Crypto Exchanges and discuss the results from their recent survey.
https://www.independentreserve.com/
Independent Reserve is a registered Australian company (ABN 46 164 257 069)
Note: DFA has no commercial relationship with the exchange and we were NOT paid to make this show.
Drowning In Debt!
The World Bank issued a report on Global Waves of Debt. They warn that the global build-up in debt is unsustainable and the risks are rising. The debt bomb is still ticking….
Tony Locantro’s End Of Year Musings
Tony Locantro from Alto Capital and I reflect on the year, consider the trajectory ahead and share a few lighter moments to boot!
A perfect Christmas diversion. Does he still hold to his 45% fall in property prices over the next few years?
Seasonal Greetings From DFA
Wishing Our Viewers, Subscribers And Followers Across All Our Channels A Peaceful Seasonal Break.
Government Bureaucrats Destroyed Under Cross Examination
Economist John Adams, and Analyst Martin North reviews the recent Senate hearing relating to the cash ban, and highlight seven key issues which were revealed.
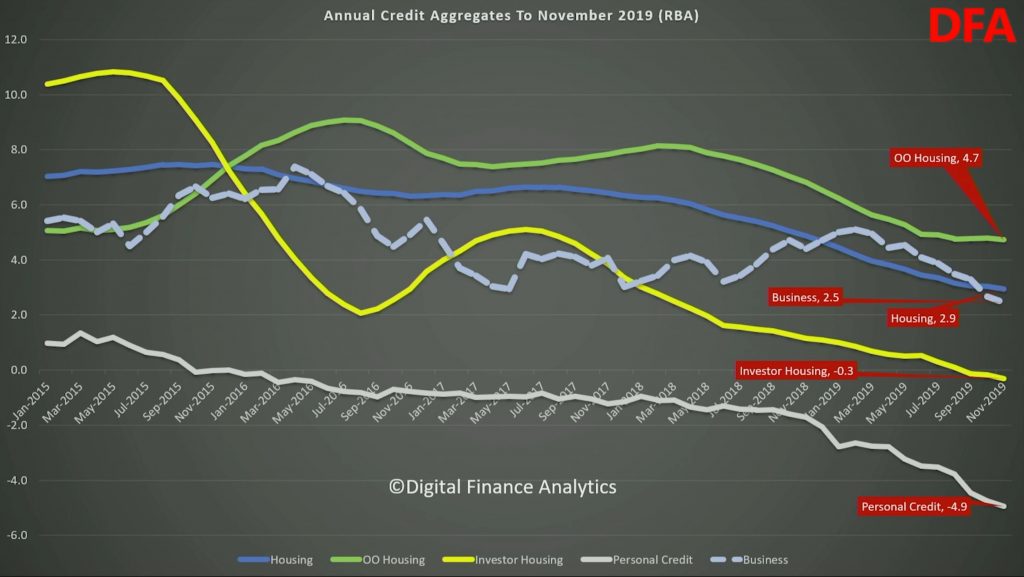
The Credit Impulse Died Some More…
We look at the latest Credit Aggregates from the RBA. Credit growth continues to slow – so will home price growth….
Higher Still – The Property Imperative Weekly 21st Dec 2019
The latest edition of our weekly finance and property news digest with a distinctively Australian flavour.
Contents:
- 00:20 Introduction
- 00:55 US Markets and Data
- 03:40 Trade Deals
- 05:10 Bitcoin Risks
- 06:30 Japan
- 07:40 China
- 07:50 UK
- 09:40 Sweden’s Negative Rate Reversal
- 12:00 The Global Waves of Debt Report
- 13:30 Australia
- 13:30 MYEFO
- 15:25 Unemployment and Migration
- 16:00 Loan Flows
- 16:35 Household Ratios
- 17:40 Home Prices
- 19:10 Australian Markets