According to the Bank of England, climate change creates risks to both the safety and soundness of individual firms and to the stability of the financial system. These risks are already starting to crystallise, and have the potential to increase substantially in the future. There is a pressing need for central banks, regulators and financial firms to accelerate their capacity to assess and manage these risks.
So, the Bank of England has published a discussion paper which sets out its proposed framework for the 2021 Biennial Exploratory Scenario (‘BES’) exercise.
The objective of the BES is to
test the resilience of the largest banks and insurers (‘firms’) to the
physical and transition risks associated with different possible climate
scenarios, and the financial system’s exposure more broadly to
climate-related risk.
They say, conducting a climate stress test poses distinct challenges compared to conventional macrofinancial or insurance stress tests. To ensure it is effective in light of these challenges, the Bank is using this discussion paper to consult relevant stakeholders on the design of the exercise. This includes financial firms, climate scientists, economists, other industry experts, and informed stakeholder groups.
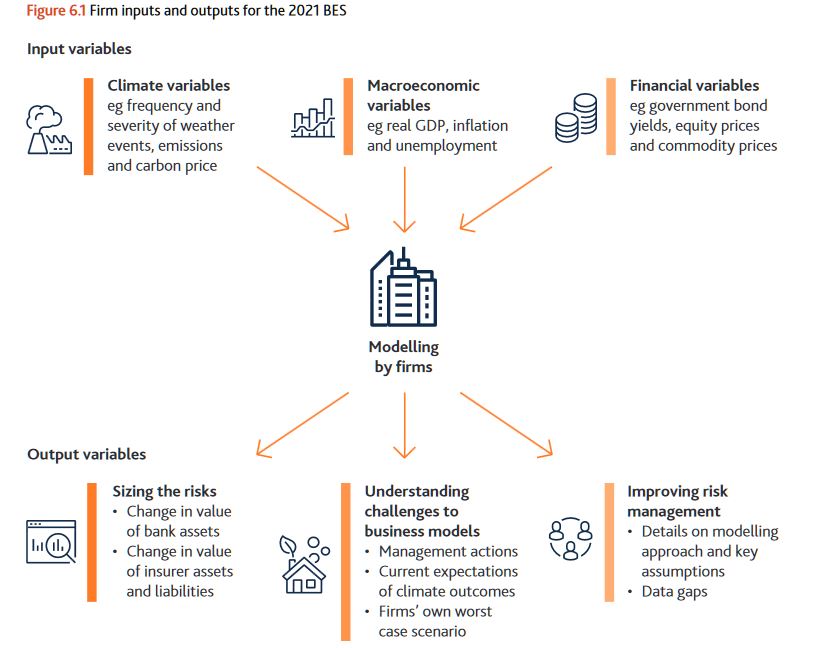
Whilst climate-related risks will materialise over decades, actions today will affect the size of those future risks. It is therefore important that firms, and other stakeholders such as the Bank, continue to develop innovative approaches to measure climate-related risks before it is too late to ensure resilience to them. The BES will use exploratory scenarios to size these future risks and to explore how firms might respond to them materialising, rather than testing firms’ capital adequacy.
The key features of the BES are:
Multiple Scenarios that cover climate as well as macro-variables: to test the resilience of the UK’s financial system against the physical and transition risks in three distinct climate scenarios. These range from taking early, late and no additional policy action to meet global climate goals.
Broader participation: both banks and insurers are exposed to climate-related risks, and the action of one will spill over to affect the other. For insurers, this exercise builds on the scenarios developed for this year’s insurance stress test.
Longer time horizon: is needed as climate-related risks crystallise over a much longer timeframe than conventional risks. The BES proposes a modelling horizon of 30 years. This is because climate change, and the policies to mitigate it, will occur over a much longer timeframe than the normal horizon for stress testing. To make these scenarios credible and tractable, the Bank proposes that the BES examine firms’ resilience using fixed balance sheets, focusing on sizing the risks and the scale of business model adjustment required to respond to these risks, rather than testing the adequacy of firms’ capital to absorb those risks.
Counterparty-level modelling: a bottom up, granular analysis of counterparties’ business models split by geographies and sectors is proposed to accurately capture the exposure to climate-related risks.
Output: the Bank will disclose aggregate results of the financial sector’s resilience to climate-related risk rather than individual firms.
The Governor Mark Carney said: “The BES is
a pioneering exercise, which builds on the considerable progress in
addressing climate related risks that has already been made by firms,
central banks and regulators. Climate change will affect the value of
virtually every financial asset; the BES will help ensure the core of
our financial system is resilient to those changes.”
Sarah Breeden the Executive Director
sponsor for climate change said “None of us can know exactly how climate
change will unfold, but we do know that it will create risks to the
financial system. I am excited that this ground-breaking exercise will
for the first time allow us to quantify this risk and so determine the
actions we need to take today if we are to minimise these future risks.”
The Bank is consulting on the design of the exercise and welcomes feedback on the feasibility and the robustness of these proposals from firms, their counterparties, climate scientists, economists and other industry experts by 18 March 2020. The final BES framework will be published in the second half of 2020 and the results of the exercise will be published in 2021.
The Banks concludes, there are many challenges involved in designing such an exercise and this proposal seeks to balance various trade-offs. These include providing a comprehensive description of the potential risks while also creating a tractable exercise for firms, and providing sufficient detail in the scenarios to allow results to be aggregated consistently while also providing scope for firms to assess the risks in a granular way.
I discuss the latest with Formafist in Canada and we compare the two markets in terms of property and the broader economy. How has 2019 been and what is 2020 looking like? Some amazing parallels, and stark differences….
This segment covers the Canadian market, and the other half of the discussion, covering the Australian market is available on Daniel’s channel here:
What’s been happening to house prices and sales volumes over 2019, what’s changed in the year
What’s happened to foreign buyers?
What’s happening to Investors?
Any news on building construction, quality, new approvals?
How about the broader economy, and interest rates?
Biggest surprise of the year
Looking ahead, thoughts on next year,
Will home prices, and volumes go up or down, (what might determine that)
Will interest rates be cut or raised by central banks?
What’s the biggest thing to watch for… in each market…
In this trimmed high quality recording of our live event, we discuss the latest financial and property data, examine our latest scenarios, and discuss the trends ahead. We also answer a range of questions posed by our viewers live. The unedited original stream with live chat, is available to view (starting at 0:30) below:
AMP Financial Planning Pty Ltd (AMPFP) ceased providing managed discretionary account (MDA) services on 10 December 2019 following the imposition of tailored licence conditions by ASIC.
In March 2019, following a surveillance of
AMPFP’s MDA services and advice business, ASIC granted AMPFP’s
application to vary its Australian financial services (AFS) licence to
provide MDA services, subject to some tailored licence conditions (19-078MR).
The tailored conditions formalised commitments made by AMPFP, in
response to ASIC’s concerns, to improve monitoring and supervision of
its discretionary investment services and related financial advice.
Under the tailored licence conditions, a
Senior Executive of AMPFP was required to provide an acceptable
attestation to ASIC by 30 September 2019 confirming that AMPFP had
complied with and was complying with the tailored conditions. This was
to ensure that all of the required improvements to monitoring and
supervision practices had been implemented and were operating
effectively.
AMPFP did not provide ASIC with an acceptable attestation in relation to its provision of MDA services. The attestation provided by AMPFP had exceptions and ASIC informed AMPFP that the attestation was not acceptable to it, and AMPFP ceased providing MDA services in accordance with its licence conditions.
Background
MDAs create particular risks for retail
clients because when a client enters into a contract with an MDA
provider, they give the provider authority to make investment decisions
on their behalf on an ongoing basis without seeking the client’s prior
approval.
The risks increase if the person
recommending the MDA service and making or influencing the investment
decisions are the same because the clients may not be receiving
impartial advice about the decision to enter into or remain in the MDA
service. ASIC expects AFS licensees to consider the risks involved with
the financial advice and investment activities of their representatives
in their monitoring and supervision practices.
The Federal Reserve Board and Federal Deposit Insurance Corporation announced Tuesday that they did not find any “deficiencies,” which are weaknesses that could result in additional prudential requirements if not corrected, in the resolution plans of the largest and most complex domestic banks. However, plans from six of the eight banks had “shortcomings,” which are weaknesses that raise questions about the feasibility of a firm’s plan, but are not as severe as a deficiency. Plans to address the shortcomings are due to the agencies by March 31, 2020.
Resolution plans, commonly known as living
wills, describe a bank’s strategy for rapid and orderly resolution
under bankruptcy in the event of material financial distress or failure.
In the plans of Bank of America, Bank of
New York Mellon, Citigroup, Morgan Stanley, State Street, and Wells
Fargo, the agencies found shortcomings related to the ability of the
firms to reliably produce, in stressed conditions, data needed to
execute their resolution strategy. Examples include measures of capital
and liquidity at relevant subsidiaries. The agencies did not find
shortcomings in the plans from Goldman Sachs and J.P. Morgan Chase.
The firms will receive feedback letters, which will be publicly available on the Board’s website.
For the six firms whose plans have shortcomings, the letter details the
specific weaknesses and the actions required. Overall, the letters note
that each firm made significant progress in enhancing its resolvability
and developing resolution-related capabilities but all firms will need
to continue to make progress in certain areas.
To that end, the letters confirm the
agencies expect to focus on testing the resolution capabilities of the
firms when reviewing their next plans. Resolving a large bank would be
challenging and unprecedented, and the agencies expect the firms to
remain vigilant as markets change and as firms’ activities, structures,
and risk profiles change.
The agencies also announced on Tuesday
that Bank of America, Goldman Sachs, Morgan Stanley, and Wells Fargo had
successfully addressed prior shortcomings identified by the agencies in
their December 2017 resolution plan review.
Bank of Ireland has caved in to public pressure following a public outcry over its plans to heavily restrict cash transactions in its branches, via Irish Independent.
The bank came in for sustained criticism
after the Irish Independent revealed yesterday that it plans to restrict
over-the-counter cash withdrawals to a minimum of €700 and cash
lodgements to a minimum of €3,000 in an effort to push customers towards
using ATMs and self-service machines.
However, after criticism from Finance
Minister Michael Noonan, as well as groups representing consumers,
farmers, older people, rural dwellers and bank workers, the bank
conceded that what it called “vulnerable” customers could continue to
get cash and make withdrawals of smaller amounts of money at branch
counters.
The changes prompted fears of a renewed
bout of bank branch closures and staff lay-offs in the wake of the
bank’s move to severely restrict counter-based cash transactions.
Mr Noonan described the changes as
“surprising and unnecessary”, adding that he expects the bank to “fully
honour” its commitment to “vulnerable customers”.
Bank of Ireland said it would continue to
allow older customers and those unfamiliar with technology to make cash
transactions over the counter.
“Bank of Ireland would like to confirm
that vulnerable customers, together with those elderly customers who are
not comfortable using self-service channels or other technology
solutions, will be assisted by branch staff to use the available
in-branch services.”
However, other banks are now expected to
follow the lead of Bank of Ireland by moving to set strict limits on
over-the-counter cash handling.
It comes after around 200 bank branches
were closed, mainly in rural areas, during the financial collapse, with
at least 10,000 retail bank staff laid-off.
Banks including Bank of Scotland, Danske, ACC and Irish Nationwide have already closed, limiting banking options for customers.
Now there are concerns that the move by
Bank of Ireland to effectively become a cashless bank will prompt more
branch shut-downs and redundancies.
Deputy chairman of the Consumers
Association Michael Kilcoyne said other banks were set to mirror Bank of
Ireland and discourage customers from withdrawing and lodging cash over
the counter.
This would make branches in rural areas less viable, he warned.
“The implications of the Bank of Ireland
move are very severe. If it gets away with this it will get rid of more
staff and close branches.
“This will be a further blow for rural Ireland,” he said.
Mr Kilcoyne predicted that AIB, Ulster Bank and Permanent TSB would make similar moves to curtail cash handling.
And banking union IBOA said it is seeking a
meeting with Bank of Ireland boss Richie Boucher over concerns the
changes would mean more job losses.
The Irish Farmers’ Association said the
changes would cause great difficulty for some farmers who are not
familiar with the bank’s online system.
Age Action accused the bank of ignoring the needs of older people by setting high limits on over-the-counter transactions.
ASIC has commenced civil penalty
proceedings in the Federal Court against National Australia Bank Limited
(NAB) and seeks findings of several thousand contraventions of the ASIC
Act and the Corporations Act.
ASIC alleges that from December 2013 to February 2019, NAB:
engaged in Fees for No Service Conduct by
failing to provide ongoing financial planning services to a large
number of customers while charging fees to those customers;
failed to issue, or issued defective, fee
disclosure statements (FDSs). ASIC alleges that the defective FDSs
contained false or misleading representations in that they did not
accurately describe the fees the customer paid and/or the services the
customer actually received. The provision of the defective or
out-of-time FDSs terminated the ongoing fee arrangements between NAB and
its customers and it is ASIC’s case that consequently NAB was not
lawfully entitled to continue to charge the fees;
failed to establish and maintain compliance systems and processes to detect and prevent these failures; and
contravened its overarching obligations
as an Australian Financial Services licence holder to act efficiently,
honestly and fairly.
It is also ASIC’s case that NAB engaged in
unconscionable conduct from at least May 2018 by continuing to charge
ongoing service fees to certain customers when it knew that it had not
delivered the services and had issued defective FDSs or at least knew
that there was a real risk that it had engaged in this conduct. However,
NAB did not stop charging fees to its customers until 4 February 2019.
ASIC is seeking declarations, pecuniary
penalties and compliance orders from the Federal Court to prevent
similar contraventions occurring in the future.
‘Fees for No Service
misconduct has been widespread and is subject to ongoing ASIC regulatory
responses including investigations and enforcement actions. This
widespread misconduct was examined in some detail by the Financial
Services Royal Commission. ASIC views these instances of misconduct as
systematic failures, unfair to customers including those that are more
vulnerable.
‘When the Fees for No Service
misconduct is coupled with Fees Disclosure Statements inadequacies or
failings, customers are potentially placed in a more disadvantageous
position. The customer may not therefore have been provided with the
opportunity to know whether they have received the services for which
they have paid or the amount of fees charged to them’ said ASIC Deputy
Chair Daniel Crennan QC.
The maximum civil penalty for contraventions alleged against NAB are:
$250,000 per contravention for breaches
of s962P (charging ongoing fees after the termination of an ongoing fee
arrangement) and s962S (failing to provide a timely FDS);
$1.7 to $2.1 million maximum penalty
(depending on the time period) per contravention for breaches of s12CB
(unconscionable conduct) and s12DB (false or misleading
representations).
NAB received more than $650 million in
ongoing service fees from 2009 to 2018. NAB has stated that it has
provisioned more than $2 billion for Fee for No Service remediation
across all of its advice licensees.
Background
Fees for No Service conduct and
remediation of that conduct by NAB and other licensees was examined as
part of the Financial Services Royal Commission. ASIC has been
monitoring NAB’s (and other licensees’) remediation of its fees for no
service failures with the last update on its progress provided on 11
March 2019 (19-051MR).
On 28 November 2019, ASIC released Report 636 – compliance with the fee disclosure statement and renewal notice obligations (19-325MR).
As noted by Report 636, FDSs are intended
to help customers understand what services they have paid for, what
services they have received and how much those services cost, and to
enable them to make more informed decisions about whether their ongoing
fee arrangements with their adviser should continue. Not issuing or
issuing late or defective FDSs deprive customers of an opportunity to
make those important decisions.
ASIC’s action against NAB falls within
ASIC’s Wealth Management Major Financial Institutions Portfolio. The
Portfolio focuses on the financial services conduct of Australia’s
largest financial institutions (NAB, Westpac, CBA, ANZ, Macquarie and
AMP) with respect to credit and retail lending, financial advice, fees
for no service, superannuation trustees, insurance, unfair contract
terms and other licensee obligations, and other conduct arising from the
Financial Services Royal
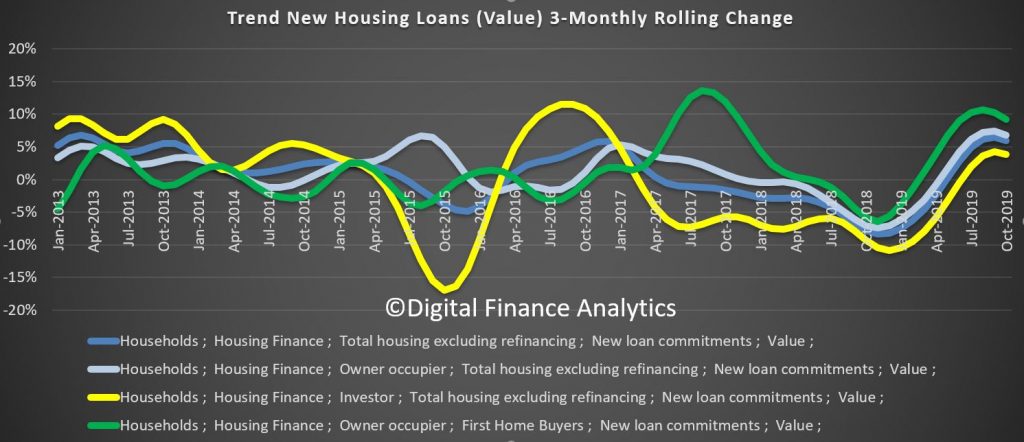
The ABS released their new data series today on loan flows. This includes some enhancements on the old data, though mostly back to July 2019 only, as well as some of the previously reported series. It will take some time to examine these in detail, but here is my first take.
New loan flows rose through the past few months, though the rate of growth slowed in October.
More focus on owner occupied loans than investor loans as expected. First time buyers also remain active, mainly for owner occupation purchase.
New loan commitments for housing rose by 2.0 per cent, seasonally adjusted, in October according to new data released today by the Australian Bureau of Statistics (ABS) in its Lending Indicators publication (previously called Lending to Households and Businesses).
ABS Chief Economist, Bruce Hockman, said: “New loan commitments for housing showed further strength in October, with the series up 15.2 per cent on the most recent trough in May 2019. Recent growth continues to be driven by new commitments for owner occupier housing, which rose 2.2 per cent in October, the fifth consecutive monthly increase.”
The data released today for the first time is based on new and improved data from the Economic and Financial Statistics collection.
“The new collection provides a more contemporary view of a changing economy. It also provides more information on investment lending, including new information on first home owners who are investors,” Mr Hockman said.
Previously published levels have changed with the data in the new publication presented on a consistent basis. An information paper released by the Australian Bureau of Statistics last week explains the impacts of the changes.
The number of loan commitments to owner occupier first home buyers rose 1.4 per cent in October, accounting for 29.9 per cent of new housing loan commitments to owner occupiers.
Personal finance fixed term loan commitments rose 3.1 per cent in October following a 0.8 per cent fall in September and were down 0.4 per cent on October 2018.
In trend terms, the value of new loan commitments to businesses for construction rose 1.2 per cent in October, while new loan commitments to businesses for the purchase of property fell 2.2 per cent.
RBA’s minutes out today. Clear signals of more action next year, despite the perceived gentle turning point.
Financial Markets
Members noted that interest rates were very low around the world, with a number of central banks
having
eased monetary policy over recent months in response to downside risks to the global economy and
subdued
inflation. Market expectations for further policy easing by central banks had been scaled back
over
previous months, with concerns about the downside risks receding a little. The US Federal
Reserve had
indicated that any further reduction in the federal funds rate would require a material change
in the
economic outlook. Reflecting these developments, market pricing had pointed to a narrowing in
the degree
of uncertainty around the expected path for the federal funds rate. Globally, long-term
government bond
yields had remained at very low levels, but had risen slightly in recent months as the prospects
for
further easing in monetary policy had diminished.
Financing conditions for corporations remained very accommodative. Robust demand for corporate
debt had
seen spreads narrow between corporate bond yields and government benchmarks. US equity prices
had risen
to new highs over the prior month, and had increased significantly since the start of the year
relative
to corporate earnings. Australian equity prices had also increased over the month, with the ASX
200 returning to the highs reached in July.
Foreign exchange rates had been little changed over the previous month. The People’s Bank of
China
had continued to implement targeted easing measures to support financing conditions, while
remaining
conscious of the need to contain financial stability risks. More broadly in emerging markets,
central
banks had eased monetary policy in recent months. However, political unrest remained a source of
volatility for certain markets.
Members discussed the transmission mechanisms for monetary policy in Australia through financial
markets. They noted that the reductions in the cash rate this year had been transmitted to
broader
financial conditions in ways that were consistent with the historical experience. Government
bond yields
had declined across the yield curve by more than 1 percentage point over the year, which
had flowed
through to lower funding costs across the economy. The Australian dollar had depreciated by
around
6 per cent on a trade-weighted basis over the previous year and remained at the lower
end of
its range over recent times. The depreciation reflected the reduction in the interest
differential
between Australia and the major advanced economies, and had occurred despite an increase in the
terms of
trade over this period.
The recent reductions in the cash rate had been reflected in reduced funding costs for banks, and
had
flowed through to lower borrowing rates for households. Average variable mortgage rates had
declined by
around 65 basis points since the middle of the year, as competition for high-quality
borrowers had
remained strong and households continued to switch away from interest-only loans towards
principal-and-interest loans at lower interest rates. These trends were expected to continue.
Consistent with lower mortgage interest rates and improved conditions in some housing markets,
housing
loan commitments had been increasing over the preceding few months, particularly for
owner-occupiers.
Growth in credit extended to owner-occupiers had also increased a little in recent months, while
lending
to investors had still been declining.
Members noted that data from lenders and information from liaison suggested that only a small
share of
borrowers had actively adjusted their scheduled mortgage payments following the reductions in
interest
rates. This was consistent with historical experience in the months immediately following a
reduction in
the cash rate. However, the available data indicated that, even over the longer term, as
interest rates
had declined borrowers had not been paying down their home loans more quickly than in the past.
Mortgage
payments as a share of aggregate household income had remained steady over recent years,
although were
slightly lower than in the first half of the decade.
Interest rates on loans to businesses had also declined to historically low levels. Despite the
accommodative funding conditions for large businesses, growth in business debt had slowed,
suggesting
that demand for finance had softened. Lending to small businesses had been little changed over
the
preceding year, and access to finance for small businesses remained restricted.
Financial market pricing implied that market participants were expecting a further 25 basis
point
reduction in the cash rate by mid 2020.
Members discussed longer-term developments in the banking sector, including the strengthening of
prudential requirements and the opportunities and challenges presented by advances in
technology.
Increased capital and liquidity after the financial crisis had made banks safer, but had also
raised the
relative attractiveness of some forms of market-based finance. Members discussed how advances in
technology opened up new opportunities for banks, while also introducing potential new
competitors.
International Economic Conditions
Members observed that there had been little change in the global outlook over the previous month,
but
that some of the downside risks had receded. The near-term uncertainty around US trade policy
had
diminished because some of the previously planned tariff increases had been postponed and there
was some
prospect of an initial agreement between the United States and China. In addition, a ‘hard
Brexit’ was assessed to be less likely.
Weak trade outcomes had continued to restrain growth in output, particularly for export-oriented
economies. Survey indicators of manufacturing activity and export orders had stabilised,
although they
remained at low levels. Surveyed conditions in the services sector had declined as weaker
external
demand conditions had spilled over to sectors other than manufacturing. Members noted that even
though
geopolitical tensions had lessened recently, ongoing uncertainty had adversely affected the
confidence
and spending decisions of businesses. In the euro area, investment indicators had remained weak
and
business confidence had declined further since September. In the United States, consumer
spending had
been solid and employment growth had strengthened. Recently, some survey measures of
manufacturing and
services activity had increased a little, although industrial production and surveyed investment
intentions had declined further in recent months.
Slower growth in China and India, largely unrelated to trade tensions, had also continued to be a
feature of the recent pattern of global growth. In China, indicators of activity had been weaker
in
October. The real levels of retail sales and fixed asset investment had declined in October and
the
output of a broad range of industrial products had remained subdued. Members noted that, in
response to
slowing growth, Chinese authorities had eased minimum equity capital requirements for a variety
of
infrastructure projects (including port, road, rail, logistics and ecological protection
projects). In
India, the extended monsoon season had exacerbated existing weakness in the economy.
Inflation remained low in the major advanced economies and was below target despite tight labour
markets and higher wages growth. Members observed that inflation had generally declined in Asia.
In
China, although headline consumer price inflation had increased, reflecting higher pork and
other meat
prices, core consumer price inflation had remained broadly unchanged at a relatively low rate.
Movements in commodity prices had been mixed since the previous meeting. The announcement of
further
measures to support steel-intensive economic activity in China had supported iron ore prices. At
the
same time, reports of a tightening in coal import controls in China had weighed on coking and
thermal
coal prices. Base metals prices had generally been lower since the previous meeting. Supply
developments
had continued to support the prices of some rural commodities.
Domestic Economic Conditions
A number of indicators suggested that growth in Australia had continued at a moderate pace since
the
middle of the year.
Members discussed survey measures of business confidence and conditions, and consumer sentiment.
Business confidence had been below average and below its recent high levels in 2017 and early
2018, with
the decline broadly based across industries. In contrast, survey measures of current business
conditions
had remained around average in recent months. Members noted that, historically, business
conditions had
been a better indicator of current economic activity than measures of business confidence,
although its
main advantage was timeliness rather than adding information not present in other indicators.
Growth in household disposable income had been weak over recent years, in both nominal and real
terms.
Members noted the importance of income growth as a key driver of consumption growth, although
the
earlier downturn in the housing market had also had a noticeable effect. The recent recovery in
the
established housing market was expected to be positive for consumption growth in the period
ahead.
Retailers in the Bank’s liaison program had suggested that nominal year-ended sales growth
had been
little changed in October and November.
Households’ expectations about future economic conditions had declined significantly since
June.
Members noted that the prolonged period of slow income growth had affected both consumer
sentiment and
growth in household consumption. Members observed that the decline in sentiment had coincided
with an
increasingly negative tone in news coverage of the economy. Notwithstanding this, households’
assessment of their own financial situation relative to a year earlier had remained broadly
steady and
somewhat above average. Historically, households’ assessments of their own finances
generally have
mattered more for household consumption decisions than their expectations about future economic
conditions.
Conditions in established housing markets had continued to strengthen over the previous month.
Housing
prices had increased further in Melbourne and Sydney and this experience had been broadly based
across
both cities. Growth in housing prices had increased in Brisbane, Adelaide and regional areas,
and
housing prices had increased in Perth for the first time in two years. Non-price indicators had
also
pointed to a strengthening of conditions in the established housing market: auction clearance
rates had
remained high in Sydney and Melbourne, and auction volumes had picked up, albeit from a very low
base.
By contrast, conditions in the new housing construction market had remained subdued. Residential
construction activity was expected to continue to contract for several quarters, despite
conditions in
established housing markets having strengthened. Although there had been tentative signs of an
improvement in conditions in some of the earlier stages of building activity, most indicators
had
remained weak, and most developer contacts in the liaison program were yet to report increased
sales of
new housing.
Business investment appeared to have eased in the September quarter. Information from the ABS
Capital
Expenditure (Capex) survey and preliminary non-residential construction data suggested that
non-mining
investment had decreased in the quarter, led by a marked decline in machinery & equipment
investment. The Capex survey had provided the fourth estimate of investment intentions for 2019/20. Non-mining investment in 2019/20 was
expected to be weaker than previously envisaged, while the survey continued to suggest that
mining
investment would contribute to growth over time, as firms invested to sustain – and in
some
instances expand – production.
Conditions in the labour market and wages data had shown little change since earlier in the year.
The
unemployment rate had remained around 5¼ per cent in October. Employment had
declined by
19,000 in October as both full-time and part-time employment had declined. This had
followed a
sustained period of stronger-than-expected employment growth, which had remained at 2 per cent
over the year despite the most recent monthly decline. The employment-to-population ratio and
the
participation rate had both remained at high levels. Over the previous few months, measures of
the
number of job advertisements had not changed much and firms’ near-term hiring intentions
had
remained broadly stable. Employment intentions among the Bank’s liaison contacts had
generally been
moderate, but had been weakest for firms exposed to residential construction.
The wage price index (WPI) had increased by 0.5 per cent in the September quarter, to
be
2.2 per cent higher in year-ended terms, which was broadly as had been expected.
Private
sector wages growth had been 2.2 per cent in year-ended terms, and had levelled out in
recent
quarters following its gentle upward trend of the previous couple of years. This was consistent
with
information from liaison that a larger share of firms expected wages growth to be stable (rather
than
increasing) in the year ahead compared with a year or so earlier. Growth in the private sector
WPI
measure including bonuses and commissions had risen to 3 per cent in year-ended terms,
which
was the highest rate of growth since late 2012. This was consistent with information from
liaison
indicating that firms had been using temporary measures to retain and reward employees rather
than
permanent wage increases. Public sector wages growth had slowed in the September quarter
following the
one-off boost from the large wage outcome for Victorian nurses and midwives in the June quarter.
Considerations for Monetary Policy
Turning to the policy decision, members noted that there had been little change in the economic
outlook
since the previous meeting. Globally, financial market conditions had been more positive, as
market
participants’ concerns about downside risks had receded a little and a number of central
banks had
eased monetary policy. There were also signs of stabilisation in several recent economic
indicators,
particularly for the manufacturing industry.
Domestically, after a soft patch in the second half of 2018, the Australian economy appeared to
have
reached a gentle turning point. GDP growth in the September quarter was expected to have
continued at a
similar pace since the beginning of the year. Most of the partial data preceding release of the
national
accounts had been in line with expectations, although non-mining investment had been weaker and
public
spending a little stronger. The outlook for growth in output continued to be supported by lower
interest
rates, the recent tax cuts, high levels of spending on infrastructure, a pick-up in the housing
market
and the improved outlook in the resources sector. However, members noted that weak growth in
household
income continued to present a downside risk to consumer spending, and that a low appetite for
risk could
be constraining businesses’ willingness to invest. The drought in many parts of Australia
was
another source of uncertainty for the outlook.
Members observed that labour market conditions had been broadly unchanged since earlier in the
year.
While this outcome had largely been in line with forecasts, it remained an area to monitor, both
because
an improving labour market was important for its own sake and also because a tightening in the
labour
market would put upward pressure on wages growth and inflation. It was noted that the current
rate of
wages growth was not consistent with inflation being sustainably within the target range, unless
productivity growth was extraordinarily weak, nor was it consistent with consumption growth
returning to
trend.
Members discussed the transmission to the economy of the interest rate reductions since the
middle of
the year. They noted in particular that the available evidence suggested that more stimulatory
monetary
policy had been working through the usual channels of lower bond yields, a depreciation of the
exchange
rate and lower interest rates on mortgages. There had also been an effect on housing prices,
increased
housing turnover in the established market and some early signs of a stabilisation in housing
construction activity. The upturn in the housing market was a positive development for the
economy in
the near term, but could become a source of concern if borrowing were to run too quickly ahead
of income
growth.
Members also discussed community concerns about the effect of lower interest rates on confidence,
noting the decline in business confidence and consumer sentiment this year. This decline had
coincided
with heightened economic uncertainty globally, a period of softer growth in the Australian
economy and
weakness in household income growth, and the Board had responded to these factors in preceding
months.
While members recognised the negative confidence effects for some parts of the community arising
from
lower interest rates, they judged that the impact of these effects was unlikely to outweigh the
stimulus
to the economy from lower interest rates.
In assessing the evidence, members noted that monetary policy had long and variable lags and that
indebted consumers may take some time before increasing their spending in response to a decline
in their
mortgage interest payments. More generally, the persistently low growth in household incomes
continued
to be a source of concern for the consumption outlook. Economic growth and the unemployment rate
remained broadly consistent with the forecasts, but members agreed that it would be concerning
if there
were a deterioration in the outlook. As in other countries, there was no real concern of
inflation
rising quickly.
The Board concluded that the most appropriate approach would be to maintain the current stance of
monetary policy and to continue to assess the evidence of how the easing in monetary policy was
affecting the economy. Members agreed that it would be important to reassess the economic
outlook in
February 2020, when the Bank would prepare updated forecasts. As part of their deliberations,
members
noted that the Board had the ability to provide further stimulus to the economy, if required.
Members
also agreed that it was reasonable to expect that an extended period of low interest rates would
be
required in Australia to reach full employment and achieve the inflation target. The Board would
continue to monitor developments, including in the labour market, and was prepared to ease
monetary
policy further if needed to support sustainable growth in the economy, full employment and the
achievement of the inflation target over time.
The Decision
The Board decided to leave the cash rate unchanged at 0.75 per cent.