ASIC research highlights the importance of reforms for mortgage brokers and home lending

ASIC has highlighted that some consumers are taking out home loans when cheaper alternatives may well exist. Brokers do not come out that well!

Today ASIC has released a report Looking for a mortgage: Consumer experiences and expectations in getting a home loan. As part of this research, ASIC followed over 300 consumers in the process of taking out a home loan and surveyed another 2,000 consumers.

This research examines consumer decision-making in relation to home loans to identify what factors influence their journey.  

Key findings from our research include:

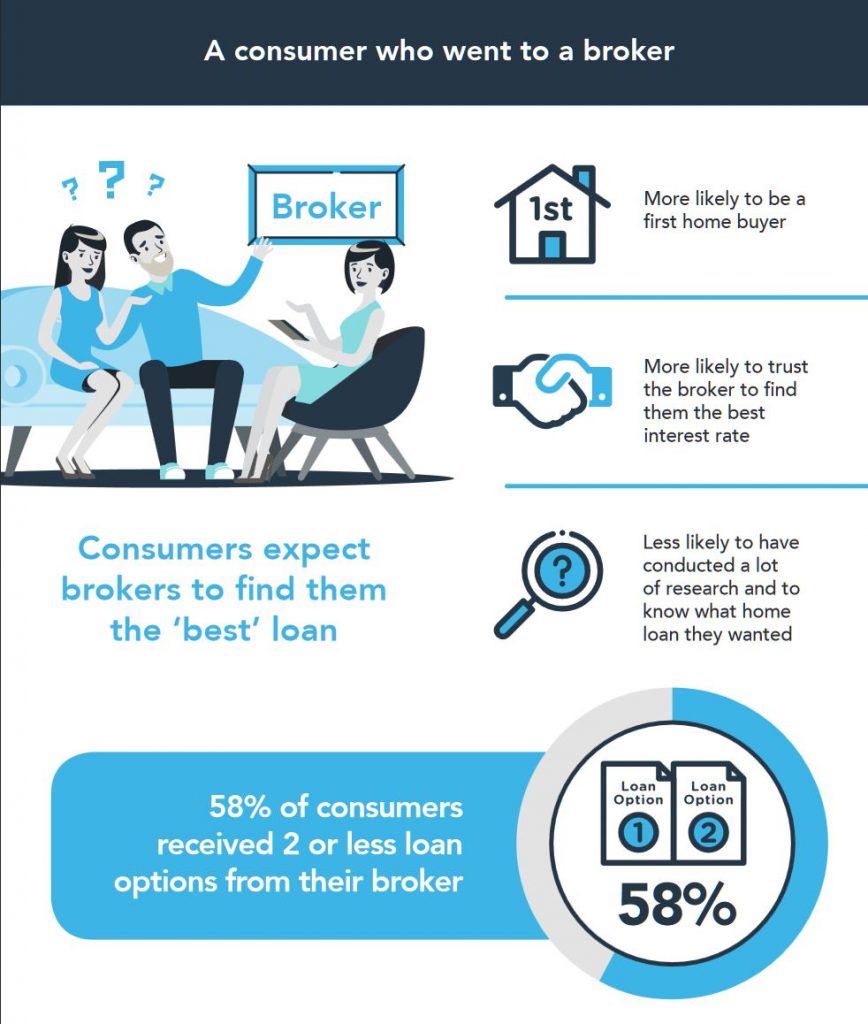
  • consumers who visit a mortgage broker expect the broker to find them the ‘best’ home loan
  • mortgage brokers were inconsistent in the ways they presented home loan options to consumers, sometimes offering little (if any) explanation of the options considered or reasons for their recommendation
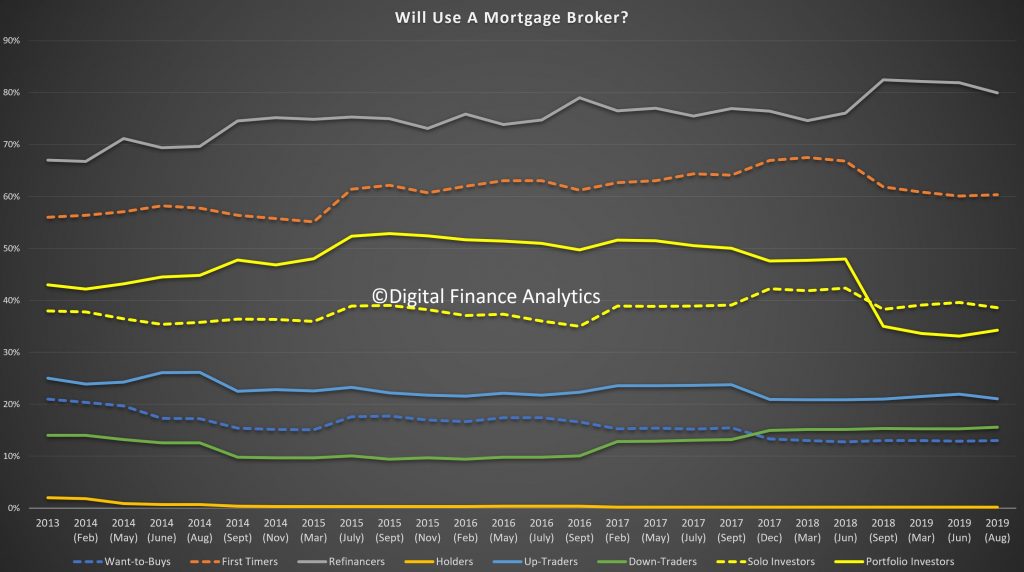
  • first home buyers were more likely to take out their loan with a mortgage broker. 

The report shows that consumers taking out a loan directly through a lender were more likely to be a refinancer or have had previous experience taking out home loans. Consumers who went directly to a lender valued convenience, with 69% taking out their loan with a lender they had an existing relationship with.

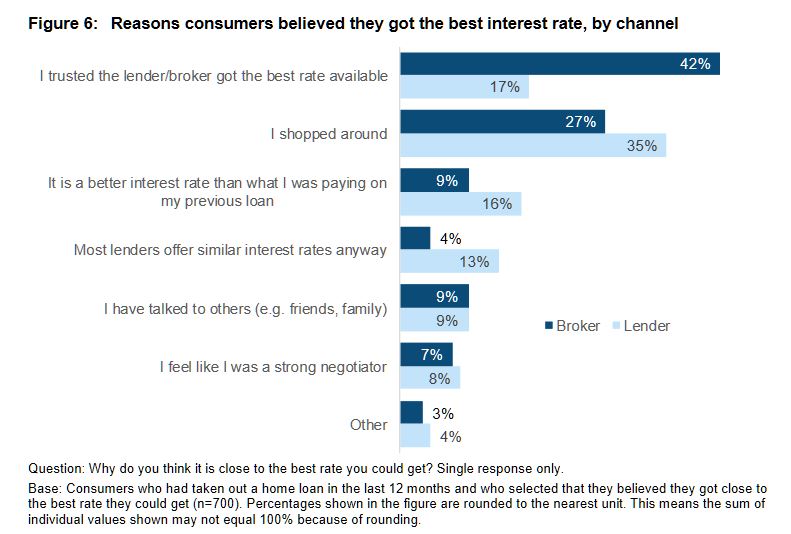
Taking out a home loan is a complex process and consumers told us it can be an ‘overwhelming’ experience. Although most consumers set out to find the best loan they could, 1 in 5 consumers believed that they could have got a better interest rate on their home loan or were not sure whether they had even got a good rate.

In launching ASIC’s report, Commissioner Sean Hughes said, ‘A home loan is one of the most important financial commitments a consumer will make. Lenders, brokers and aggregators must step up to make it easier for consumers to meaningfully compare loan options and for brokers to communicate how a home loan option has been selected for them.’ 

‘ASIC strongly supports the recent Government announcement to enact a best interests duty for mortgage brokers. Importantly, the implementation of such a duty will align the role of brokers to the reasonable expectations of consumers.’

‘Our research also suggests that some consumers are taking out home loans when cheaper alternatives may well exist. We are working with other regulators to develop a new home loan interest rate tool to improve price transparency for consumers to compare options. We expect this tool will be made available on ASIC’s MoneySmart website next year.’

Background

In March 2017, ASIC published the findings of our review into the effect of remuneration structures in the mortgage broking market on the quality of consumer outcomes: see Report 516 Review of mortgage broker remuneration (REP 516). We found that current remuneration practices create conflicts of interest that may contribute to poor consumer outcomes.

As part of this review we also found that consumers who obtained their loan through a broker:

  • borrow more
  • have higher loan to valuation ratios
  • spend more of their wage on a mortgage
  • take out more interest-only loans
  • get the same rate as customers that go directly to a lender.

ASIC’s MoneySmart website has information for consumers about choosing a home loan and using a broker.

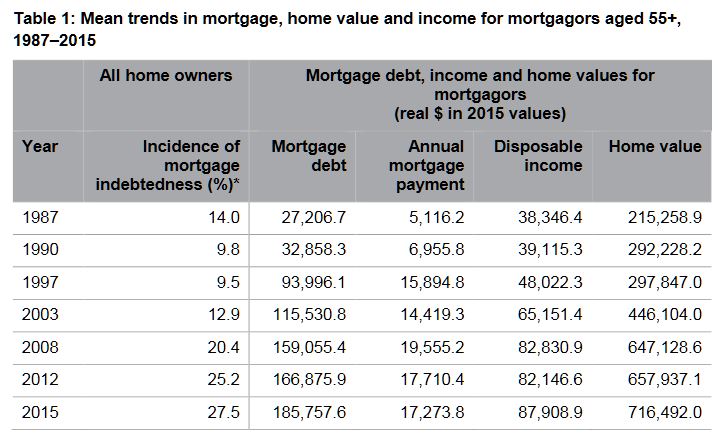
Consumers can also use MoneySmart’s mortgage calculator to compare home loans and work out whether they can save money by switching to another mortgage. 

Property Transaction Intentions By Segment

Today we continue the discussion of the latest findings from our rolling household surveys. Yesterday we over-viewed the segments, and trends, and looked at relative demand. Today we go deeper. The accompanying video explains our findings in more detail.

Want To Buy.

The 1.6 million Want To Buys are not able to progress because finance is not available (37%). This is been a growing issue in recent times, though has eased back, as pressure from cost of living (25%) and high home prices (25%) bite. Many therefore remain in rental property or in other living arrangements.

First Time Buyers.

There have been some changes in the drivers of purchase by the 350,000 first time buyers. Needing a place to live is high on the agenda (29%), but the expectations of future capital growth have dropped to 15%, while greater security remains around 15%. There is a rise in the use of First Owner incentives (13%).

However, availability of finance remains a significant barrier (39%) – though it dropped a little in response to lower rates and changed underwriting standards, along with high home prices (26%) and costs of living (24%). Fear of unemployment is on the rise (5%).

There has been a reduction in demand for units relative to houses, partly in response of the coverage of poor quality high-rise construction. We expect this to continue.

Refinancers.

There is a significant demand from those seeking to refinance an existing loan. The main aim is to reduce monthly repayments (48%), a factor which have become more important as financial pressures and mortgage stress build, helped by lower rates (18%). Around 18% are seeking to withdraw capital to repay other debts or improve their finances. Fixed rates are becoming less attractive (9%). Poor lender service is not a significant factor; price is.

Up-Traders.

Households looking to buy a larger property are driven by the desire for more space (41%), job move (16%), life-style change (20%), or property investment (22%), the latter dropping from recent highs of 43%.

Down Traders.

Those seeking to down size are mainly driven by the need to release capital, often for retirement, or supporting the “Bank of Mum and Dad” (50%). Around 30% are driven by increased convenience – either by changing location or to a more manageable property. A switch to an investment property has faded to 5% from a peak of 22% in 2017.

Property Investors.

Tax efficiency remains the strongest driver for investors (45%), while appreciating property values have dropped from more than 30% down to 15% now. Low finance rates have risen to 12% thanks to the recent changes and better returns than bank deposits registered at 25%. So investors believe the tax breaks make investing a reasonable proposition (though many would find in net cash flow terms they are underwater, without significant capital gains).

The main barriers are difficulty in obtaining finance (40%), have already bought (30%), and changes to regulation (15% – and falling now). Fears of interest rate rises have dropped from 11% in March 2019 to 1% now and the local and international economic scene has changed.

In the accompanying video we look in more detail at the differences between Solo Investor, Portfolio Investor and Super Investor motivations.

Finally, its worth noting that across the segments, when choosing a mortgage, price remains the main driver, though some segments rate other features a little more significant than others.

Prospective use of mortgage brokers also varies across the segments, with refinancers and first time buyers the most likely to use an adviser.

So, in summary, households are reacting to the changing market and economic conditions. However there is little here to suggest a significant upswing in demand.

The ABS And Productivity Commission Both Downplayed Growing Inequality

From The Conversation.

We now know the Bureau of Statistics did quite a bit of soul-searching before producing the bland and ultimately misleading press release headed “Inequality Stable Since 2013-14” last month.

Late last week we pointed to the odd way in which the release included no data to back up the claim, and how journalists from the ABC and Sydney Morning Herald and Age quickly discovered the statistics it purported to summarise actually showed wealth inequality climbing.

Sydney Morning Herald

On Wednesday in The Guardian, Paul Karp revealed the contents of documents released under freedom of information laws that shed light on the creation of the press release.

An earlier draft had pointed to a “significant increase” in wealth inequality compared with 2011–12 and 2003–04.

Australian Bureau of Statistics disclosure log

The phrase “significant increase” didn’t survive the editing process.

A reference to a measure of wealth inequality being “at its peak” since it was first comprehensively measured in 2003-04 was also removed after a direction to “focus on income over wealth”.

Australian Bureau of Statistics disclosure log

Another email noted there has been “a significant (downward) change” in the wealth share of the bottom fifth of households, but added: “I’m not sure that we want to draw attention to this though??”

Australian Bureau of Statistics disclosure log

The Bureau responded to the Guardian article on Wednesday, saying it had not attempted to misrepresent the data, and that it prepared the press releases “internally with no external influence”.

It’s not just the ABS

It’s not only the Bureau of Statistics that has found it difficult to draw attention to increasing wealth inequality.

In August last year the Productivity Commission released what it called a stocktake of the evidence on inequality, titled “Rising Inequality?”.

It wasn’t so much a “stocktake of the evidence” as a showcase of new specially assembled evidence that conflicted with a wider body of evidence that shows wealth inequality increasing.

The Commission’s contribution presented the wealth shares for the top 10% of Australian households only.

These came not from publicly available data, but from “confidential unit record files” made available to approved users by the Australian Bureau of Statistics.

We have presented the microdata in its raw form below, alongside four other well-established and widely published series.


For notes, see full paper: Inequality stocktake … or snowjob? Evatt Journal, November 2018

The striking feature is that every line except the Productivity Commission’s shows inequality increasing since 2011.

The data from both Credit Suisse (on which Oxfam bases its research) and the Evatt Foundation suggest that the top 10% now own more than half the nation’s household wealth, and the Organisation for Economic Co-operation and Development’s 47.2% is just a little less.

The Productivity Commission is an outlier in finding the top 10% own closer to 40%. Its finding that the share has been falling between 2013-14 and 2015-16 makes it even more of an outlier.

Beyond the bland headline, the latest statistics from the Bureau confirm our analysis of growing wealth inequality.

The Commission’s results are implausible

Our suspicions were aroused when the Productivity Commission’s results appeared to be incompatible with the Bureau’s published findings, of which they were a subset.

The Bureau’s data showed the share of wealth held by the top 20% climbing, while the Commission’s series showed the share held by the top 10% falling – implying that the share of the next top 10% must have been climbing quite a lot.

The divergence strained credulity. There are no advantages in accumulating wealth that apply to households in the second top decile that do not apply with at least equal force to those in the top decile.

Without an outside explanation (such as an extra tax applying only to the top 10%) the result is so improbable as to seem impossible.

Other data available from the Bureau at the time showed that the ratio of the wealth of households 10% from the top to the wealth of those 10% from the bottom had climbed, while at the same time the Commission found the wealth share of the top 10% overall had fallen.

Unfortunately, the Commission gave pride of place to its own findings over and above more conventional findings, and used a question mark in the title of its paper “Rising Inequality?” to imply that it might not be.

As we wrote here last week, wealth inequality and its effects matter. Australians need the truth about how much it is growing.

Authors: Christopher Sheil, Visiting Senior Fellow in History, UNSW; Frank Stilwell, Emeritus Professor, Department of Political Economy, University of Sydney

Weaker Construction Means Weaker GDP

The ABS released their June 2019 “Construction Work Done, Australia, Preliminary” today. It paints a picture of slowing momentum once again. This will flow into a weaker GDP number ahead.

The trend estimate for total construction work done fell 2.7% in the June quarter 2019.

The seasonally adjusted estimate for total construction work done fell 3.8% to $48,778.0m in the June quarter.

The trend estimate for total building work done fell 2.2% in the June quarter 2019.

The trend estimate for non-residential building work done fell 0.8% and residential building work fell 3.0%.

The seasonally adjusted estimate of total building work done fell 5.7% to $28,506.2m in the June quarter.

The trend estimate for engineering work done fell 3.1% in the June quarter.

The seasonally adjusted estimate for engineering work done fell 1.1% to $20,271.8m in the June quarter.

Westpac commented as follows:

The construction sector is in a downtrend, with activity having peaked in mid-2018. This reflects: (1) the turning down of the home building cycle; (2) a pull-back in public works; and (3) a further winding down of private infrastructure activity led by the mining sector (although this dynamic has largely run its course).

With the construction sector representing around 13% of the economy this result will dent Q2 GDP, potentially in the order of 0.4ppts – depending upon how these quarterly partials flow through to the national accounts estimates.

The housing downturn still has further to go and will weigh on conditions throughout 2019 and into 2020.

On public works, there is a sizeable work pipeline and governments are adding projects to the investment pipeline – suggesting that the segment will be more supportive of conditions over the forecast period. On private infrastructure, commencements have picked-up somewhat (eg some iron ore projects have proceeded in response to the recent elevated prices) and the work pipeline has increased – pointing to an emerging lift in activity during the year ahead.

The Property Supply Demand Disequilibrium

Digital Finance Analytics will be releasing the results from our rolling household surveys over the next few days. This is the first in the series.

These are the results from our 52,000 households looking at property buying propensity, price expectations and a range of other factors.

We use a segmented approach to the market for this analysis, and in our surveys place households in one of a number of potential segments.

Want To Buys: households who would like to buy, but have no immediate path to to purchase. There are more than 1.5 million households currently in this group.

First Timers: first time buyers with active plans to purchase. There are around 350,000 households in this segment.

Up-Traders: households with plans to buy a larger property (and sell their current one to facilitate the up-sizing. There are around 1 million households in this group.

Down Traders: households wishing to sell and down size, sometimes buying a smaller property at the same time. There are around 1.2 million households in this group.

Some of these households will hold investment property as well. We categorise investors into one of two groups.

Solo Investors: households with one or two investment properties. There are about 940,000 of these.

Portfolio Investors: households with more than two investment properties. There are around 170,000 of these.

Finally we also identify those who are planning in refinance existing loans, but are not intending to buy or sell property – flagged as Refinancers, and those with no plans to buy, sell or refinance – flagged as Holders.

It is the interplay of all these segments which drives the property market and demand for mortgages.

Around 72% of households are property active – meaning they want to buy, sell, or own property. More than 28% are property inactive, meaning they rent, live with parents or in other arrangements. Our surveys track all household cohorts. A greater proportion are falling into the inactive category.

Intention To Transact Is Rising (From A Low Base)

We ask about households intentions to transact in the next 12 months, and whether they will be buy-led (seeking to purchase a property first) or sell-led (seeking to sell a property first). (Click on Image To See Full Size).

Property investors are still coy (hardly surprising given the fall in capital values, the switch to P&I loans and receding rentals. But Down Traders, First Time Buyers and Refinancers are showing more intent.

We will look at the drivers by segment in a later post.

But the Buy Side and Sell Side Analysis is telling

Those seeking to buy are being led by First Time Buyers and Down Traders.

Those looking to sell are being led by the Down Traders, and Property Investors. In fact this suggests we will see a spike in listings as we move into spring.

Our equilibrium model suggests that currently supply is not meeting demand (adjusted for property types and locations) in a number of prime Sydney and Melbourne locations, within 30 minutes of the CBD. But beyond that demand is below current supply, and more is coming.

On this basis, we expect to see some local price uplifts, but not a return to the rises a couple of years back. What is clear, is that the property investment sector continues to slumber, and Down Traders are getting more desperate to sell.

Finally, today demand for more credit is coming from Up-Traders, First Time Buyers and Refinancers. Not Investors.

And price expectations seem to be on the improve, driven by investors. But it is still lower than a couple of years ago.

Next time we will dive into the segment specific drivers.

Would you buy a new apartment?

“What we need to do is rebuild confidence in Australia’s building and construction sector,” said federal minister Karen Andrews after the July 2019 meeting of the Building Ministers’ Forum). Via The Conversation.

This has been a recurring theme since the federal, state and territory ministers commissioned Peter Shergold and Bronwyn Weir in mid-2017 to assess the effectiveness of building and construction industry regulation across Australia. They presented their Building Confidence report to the ministers in February 2018.

In the 18 months since then, the combined might of nine governments has made scant progress towards implementing the report’s 24 simple recommendations. Confidence in building regulation and quality has clearly continued to deteriorate among the public and construction industry.

In last week’s Four Corners program, Cracking Up, Weir was asked whether she would buy an apartment. She responded: “I wouldn’t buy a newly built apartment, no […] I’d buy an older one.” She went on to say:

We have hundreds of thousands of apartments that have been built across the country over the last two, three decades. Probably the prevalence of noncompliance has been particularly bad, I would say in the last say 15 to 20 years […] And that means there’s a lot of existing building stock that has defects in it […] There’ll be legacy issues for some time and I suspect there’ll be legacy issues that we’re not even fully aware of yet.

These comments may not have delighted those developers trying to sell new apartments, or owners selling existing apartments, but they are fair and correct. Confidence will not be restored until all the governments act together to improve regulatory oversight and deal with existing defective buildings.

Residents of the Lacrosse, Neo200, Opal and Mascot towers and other buildings with serious defects are already living with the impact of “legacy” problems. Over the weekend, another apartment building was evacuated – this time in Mordialloc in southeast Melbourne. The building was deemed unsafe because it was clad with combustible material and had defects in its fire detection and warning system.

A costly but essential fix

Fixing such defects is a costly business. A Victorian Civil and Administrative Tribunal decision established that replacing the combustible cladding on the Lacrosse building in Melbourne would cost an average of A$36,000 per unit. At Mascot Towers, consultant engineers estimated the cost of structural repairs at up to A$150,000 per unit on average.

According to UNSW and Deakin research, between 70% and 97% of units in strata apartments have significant defects. Let’s assume 85% have such defects and the average cost of fixing these is only $25,000 per unit. That would mean total repair costs for the 500,000 or so tall apartments (four-storey and above) across Australia could exceed A$10 billion.

The Victorian government has taken the lead on combustible cladding, setting up and funding a A$600 million scheme to replace it. It’s also replacing combustible cladding on low-rise school buildings even though these may comply with the letter of the National Construction Code.

No other state has yet followed this lead. This is concerning given the risk to life. No one viewing images of the Neo200 fire in the Melbourne CBD could doubt how dangerous combustible cladding can be.

The other states and territories should immediately copy the Victorian scheme. While not perfect, and probably underfunded, it is a positive step to improve public safety. The Andrews government should be congratulated for doing something practical while its counterparts in New South Wales and Queensland, which have many buildings with combustible cladding, fiddle about.

All governments share responsibility

The federal government’s response has been inadequate. When asked about contributing to the Victorian scheme, Karen Andrews said:

The Commonwealth is not an ATM for the states […] this problem is of the states’ making and they need to step up and fix the problem and dig into their own pockets.

This flies in the face of reality. All nine governments are responsible for building regulation and enforcement. All signed the intergovernmental agreement on building regulation.

The federal government, which chairs the Building Ministers’ Forum, leads building regulation in Australia. The Australian Building Codes Board, which produces the National Construction Code, is effectively a federal government agency. The precursor to the national code, the Building Code of Australia, was a federal initiative.

It is clear Australian governments have worked effectively together in the past to combat threats to life and safety, or to provide consumer protection nationwide. Examples include initiatives as diverse as the national gun buyback, the creation of the Australian Securities and Investment Commission (ASIC) and the program to replace defective Takata airbags in cars.

The crop of building defects we see today are a direct result of negligent regulation by all nine governments over the past two decades. Clearly, they all have a legal and moral duty to coordinate and contribute to a program to manage the risks and economic damage this has created.

All the evidence points to a long-term failure to heed repeated warnings about the dangers. Governments and regulators were captive to the interests of the development lobby, building industry and building materials supply industry.

The governments must stop playing a blame game. Effective programs are urgently needed to fix defects, including combustible cladding, incorrectly installed fire protection measures, structural noncompliance, structural failure and leaks.

The Australian Building Codes Board, which is directly responsible for the mess, should be reformed to ensure it becomes an effective regulator. The National Construction Code should be changed to make consumer protection an objective in the delivery of housing for sale.

All parties involved will have to take some pain: regulators, developers, builders, subcontractors, consultants, certifiers, insurers, aluminium panel manufacturers, suppliers and owners. Only governments can broker a solution as it will require legislation and an allocation of responsibility for fault.

The alternative will probably be a huge number of individual legal cases and a rash of owner bankruptcies, which may well leave the guilty parties untouched.

Author: Geoff Hanmer, Adjunct Lecturer in Architecture, UNSW

The Housing Debt Trap Is Sprung On Older Australians

The new AHURI report highlight the fact that more Australians are taking mortgage debt into retirement, will have to us superannuation to repay the debt, and so put more pressure on Government in terms of future support.

High debt into retirement is also leading to more stress.

Our surveys show the relative debt by age cohorts. The trends are “moving to the right” as people buy later, get larger loans, and hold them into retirement. Overall debt has never been higher.

As a result the debt to income ratio of those over 55 years has deteriorated significantly.

The final point to make is households as they enter retirement will be more reliant on fixed incomes, at a time when savings rates on deposits are at a record low. So servicing this debt into retirement will be a major issue.

Combined this explains why mortgage stress is lurking among older households, as our July stress data revealed. This includes more than 35,000 “Wealthy Seniors” across the country.

ASIC action leads to Allianz refunding over $8 million in consumer credit insurance premiums and fees

ASIC says that Allianz Australia Insurance Limited (Allianz) will refund over $8 million in consumer credit insurance (CCI) premiums and fees including interest to more than 15,000 consumers.

This follows ASIC’s review of the sale of CCI by lenders in Report 622 Consumer credit insurance: Poor value products and harmful sales practices (REP 622), and forms part of ASIC’s broader priority to address harms and unfair practices impacting consumers in insurance.

Allianz’s refund relates to the sale of cover to consumers who were ineligible to make a claim for unemployment or disability, the sale of death cover to customers under 21 years of age who were unlikely to need that cover, and the charging of fees to customers who paid premiums by the month without adequate disclosure.

The remediation program covers certain CCI products issued by Allianz including mortgage and loan protection policies sold through financial institutions. These CCI products provided cover against the risk of consumers being unable to meet loan commitments because of death, injury, illness or involuntary unemployment.

To address these issues, Allianz will,

  • for ineligible sales of unemployment and disability cover,
    • refund premiums charged plus interest for active, cancelled or lapsed policies sold between 1 January 2011 to 31 December 2018;
    • reassess all withdrawn and declined claims where the consumer was ineligible for the policy at the time of sale;
    • invite consumers to submit a claim if they have not already done so and pay valid claims plus interest; and
    • continue to honour active policies and not rely on employment eligibility criteria as a basis to decline an unemployment or disability claim;
  • for sales of death cover to customers under 21 years of age,
    • refund all premiums charged plus interest for active, cancelled or lapsed policies sold between 1 January 2011 to 31 December 2018; and
    • preserve existing death cover for active policyholders on current terms without charging for it;
  • for monthly policy payment customers,
    • refund all administration fees and loading charged plus interest; and
    • correct any future direct debit amounts.

ASIC Commissioner Sean Hughes said, ‘Disappointingly, our work on the sale of CCI has highlighted widespread mis-selling and poor product design. This remediation outcome is only one of many examples where CCI has failed consumers.  We expect insurers to cease to sell insurance products that provide little or no value.’

‘We need a financial system that is fair. Insurers and other financial institutions need to rise to the challenge and embed the principle of fairness into their businesses to ensure we do not see any further instances of this kind of poor value product being pushed on to consumers’ added Mr Hughes.

Allianz will stop issuing new CCI policies from 30 September 2019. It will continue to fulfil its obligations to existing CCI policyholders. 

Allianz is expected to write to all affected consumers about their refund offer from October 2019. Consumers with questions about their cover should contact Allianz by email at here_to_help@allianz.com.au.

Background

ASIC’s recent review of the sale of CCI has resulted in refunds of over $100 million due to more than 300,000 affected consumers. On 11 July 2019, we released Report 622 Consumer credit insurance: Poor value products and harmful sales practices (REP 622) detailing our findings and setting minimum standards for lenders and insurers who issue or sell CCI (19-180MR).

ASIC is currently consulting on a proposal to ban the sale of CCI and direct life insurance through unsolicited telephone calls (19-188MR). The proposed ban aims to address unfair sales conduct and protect consumers from being sold products that they do not need, want or understand.

ASIC has also commenced investigations into a number of entities that have been involved in mis-selling CCI to consumers.

Separately, in 2018, Allianz refunded $45.6 million to 68,000 consumers for add-on insurance sold through car dealerships that were of little or no value (18-008MR).

APRA On The Changing Landscape – And What We Don’t Know

Interesting speech from Wayne Byers “Reflections on a changing landscape“. He discussed the ” extraordinary intervention” to save our banks a decade ago (in a footnote), significant in my view, for what it said, and for what it missed out. There is no mention that both NAB and Westpac required bailing out by the FED’s TAF after the GFC. An important little fact?

APRA’s activities have expanded significantly over the past five years. This has not been a smooth transition: the regulatory pendulum has swung between periods of significant regulatory change, and times when there have been demands to pare back. But overall there is no doubt that expectations of APRA have grown, and they have pushed us into new fields of endeavour. There is no sign that tide is going to turn soon.

I’m not sure what the issues de jour will be in five years’ time but there’s a very good chance they will not be the issues we think are most important today. The past five years has shown that what might seem unusual or out of scope today, can quickly become a core task tomorrow. Some of the topics that I have talked about tonight were not seen, five years ago, to be at the heart of APRA’s role.

In contrast, later this week we will publish our 4 year Corporate Plan and a number of them will be called out as our core outcomes, ranking alongside maintaining financial safety and resilience. 

If there is one lesson from the past five years, it is that – be it regulators or risk managers – being ready and able to respond to the demands of a rapidly changing landscape is probably the most important attribute we all need to possess.

But the footnote was the most interesting in my view. For what it said, and for what it missed out.

It is sometimes said the Australian banking system ‘sailed through’ the financial crisis. While the system did prove relatively resilient, there was extraordinary intervention necessary to keep the system stable and the wheels of the economy turning.

That included (i) an unprecedented fiscal response – one of the largest stimulus packages in the world;

(ii) an unprecedented monetary response – the official cash rate was cut by 425 basis points in a little over six months;

(iii) the RBA substantially expanded its market operations and balance sheet;

(iv) ASIC imposed an 8-month ban on the short selling of financial stocks; and

(v) the Federal Government initiated a guarantee of retail deposits of up to $1 million, and a facility for authorised deposit-taking institutions (ADIs) to purchase guarantees for larger deposits and wholesale funding out to 5 years (indeed, at one point more than one-third of the banking system’s entire liabilities were subject to a Commonwealth Government guarantee).

As I have said previously, if all of the above was needed to keep the system stable and operational, then it is difficult to argue that the system sailed through or that some further strengthening of regulation was not justified.

He failed to mention the massive bail-out of our banking system from the FED and the fact that it was China’s response which supported our economy. The evidence suggests we were much closer to the abyss than was acknowledged at the time. Westpac and NAB both required support from the FED, as revealed in papers from the FED.

The US Dodd-Frank Act requires the US Federal Reserve to reveal which institutions it loaned money to under the various bail out programmes.

One of their programmes was the Term Auction Facility (TAF).

“Under the program, the Federal Reserve auctioned 28-day loans, and, beginning in August 2008, 84-day loans, to depository institutions in generally sound financial condition… Of those institutions, primary credit, and thus also the TAF, is available only to institutions that are financially sound.

Now of course the question is what does “financially sound” institutions mean. Well, look at the entire list – its long, but some of the names will be familiar. The FED data shows more than 4,200 separate transactions across more than 400 institutions globally between 2008 and 2010.

UK based Lloyds TSB plc received USD$10.5 billion – and was later partially nationalised by the UK government.

And another UK Bank, the Royal Bank of Scotland (RBS) got US$53.5 billion plus and additionally US$1.5 billion for its exposures via ABN Amro after RBS bought it. That was nationalised too.

In Ireland, Allied Irish Bank needed US$34.7 billion of loans from the Fed between February 2009 and February 2010 . This is the bank bailed out via the Irish taxpayer.

And Deutsche Bank needed a massive US$76.8 billion in loans in total (and that bank continues to struggle today).

The list goes on. Bayerische Landesbank required a US$13.4 billion bailout from the state of Bavaria, but also borrowed US$108.19 billion between December 2007 and October 2009.

Where these banks sound?

And our own “financially sound” institutions National Australia Bank and Westpac needed help from the Fed. NAB needed around $7 billion in total (allowing for the exchange rate).

In fact NAB raised $3 billion from shareholders in 2008 to add capital to its business in parallel.

And in January 2008 Westpac said everything was fine with its US exposures, just one month after they got their first bail-out from the FED, worth US$90 million.

In fact, there was a long queue then, as the Fed spreadsheet shows that alongside Westpac, was Citibank, Lloyds TSB Bank, Bayerische Landesbank and Societe Generale, all of whom where bailed out by Governments in their respective countries.

Now, the RBA wrote at the time:

The Australian financial system has coped better with the recent turmoil than many other financial systems. The banking system is soundly capitalised, it has only limited exposure to sub-prime related assets, and it continues to record strong profitability and has low levels or problem loans. The large Australian banks all have high credit ratings and they have been able to continue to tap both domestic and offshore capital markets on a regular basis.”

So the question is did APRA and the RBA know what was going on?

And my question more generally is how prepared are we for a similar crisis now – given the changed economic and geopolitical forces in play?

Older Australians Mortgage Debt Up 600 per cent; Impacting Mental Health

Between 1987 and 2015, average real mortgage debt among older Australians (aged 55+ years) blew out by 600 per cent (from $27,000 to over $185,000 in $2015), while their average mortgage debt to income ratios tripled from 71 to 211 per cent over the same period, according to new AHURI research.

The research, Mortgage stress and precarious home ownership: implications for older Australians, undertaken for AHURI by researchers from Curtin University and RMIT University, investigates the growing numbers of older Australians who are carrying high levels of mortgage debt into retirement, and considers the significant consequences for their wellbeing and for the retirement incomes system.

‘Our research finds that back in 1987 only 14 per cent of older Australian home owners were still paying off the mortgage on their home; that share doubled to 28 per cent in 2015’, says the report’s lead author, Professor Rachel ViforJ of Curtin University.

‘We’re also seeing these older Australians’ mortgage debt burden increase from 13 per cent of the value of the average home in the late 1980s to around 30 per cent in the late 1990’s when the property boom took off, and it has remained at that level ever since. Over that time period, average annual mortgage repayments have more than tripled from $5,000 to $17,000 in real terms.’

When older mortgagors experience difficulty in meeting mortgage payments, wellbeing declines and stress levels increase, according to the report. Psychological surveys measuring mental health on a scale of 0 to 100 reveal that mortgage difficulties reduce mental health scores for older men by around 2 points and an even greater 3.7 points for older women. Older female mortgagors’ mental health is more sensitive to personal circumstances than older male mortgagors. Marital breakdown, ill health and poor labour market engagement all adversely affect older female mortgagors’ mental health scores more than men’s.

‘These mental health effects are comparable to those resulting from long-term health conditions,’ says Professor ViforJ. ‘As growing numbers of older Australians carry mortgages into retirement the rising trend in mortgage indebtedness will have negative impacts on the wellbeing of an increasing percentage of the Australian population.’

High mortgage debts later in life also present significant challenges for housing assistance programs. The combination of tenure change and demographic change is expected to increase the number of seniors aged 55 years and over eligible for Commonwealth Rent Assistance from 414,000 in 2016 to 664,000 in 2031, a 60 per cent increase. As a consequence the real cost (at $2016) of CRA payments to the Federal budget is expected to soar from $972 million in 2016, to $1.55 billion in 2031. The unmet demand for public housing from private renters aged 55+ years is also expected to climb from roughly 200,000 households in 2016, to 440,000 households in 2031, a 78 per cent increase.

There are also challenges for Government retirement incomes policy. The burden of indebtedness in later life is growing; longer working lives and the use of superannuation benefits to pay down mortgages are increasingly likely outcomes.