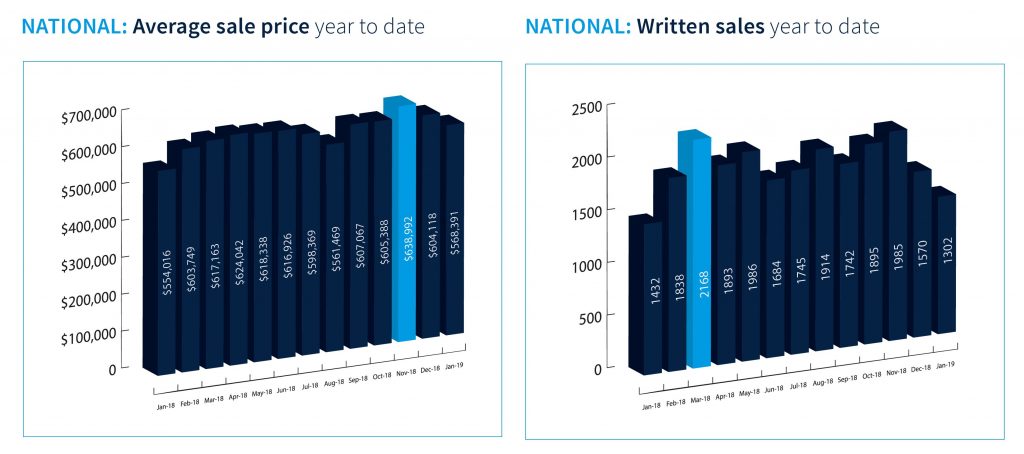
The New Zealand average national house price in January 2019 increased by 2.59% from $554,016 in January 2018 to now sit at $568,391.
But the average has fallen since a November peak of $638,992, a fall of 12%! In addition written sales decreased from a high of 2,168 in March 2018, and is lower this January than last.
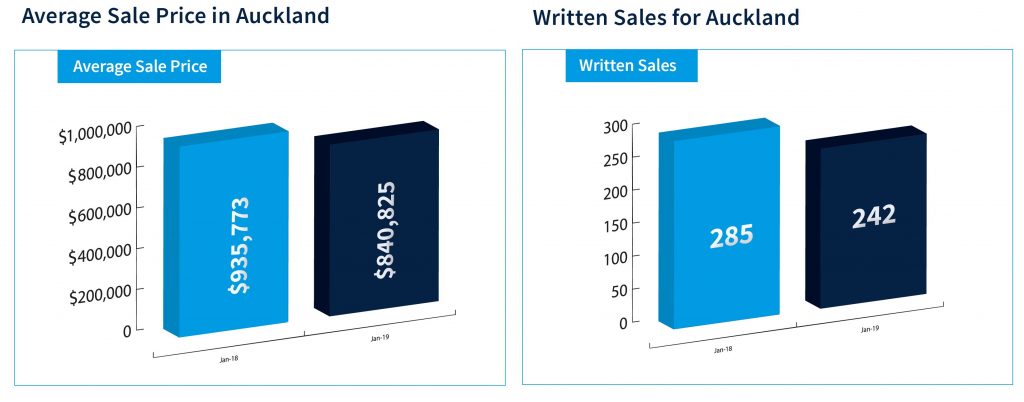
In Auckland, the average house price in January was back 10.15% on the same recorded period for 2018 with the average for the month sitting at $840,825.
Total listings, new auctions and written sales remained down on the previous year in the country’s biggest city. The market is changing, and this has been well reported across all media outlets.
In Wellington which includes the Taranaki and Hawke’s Bay regions, the average sale price is up 11.64% on the same period in 2018 from $468,546 to now sit at $523,099. Total new listings were only slightly back on January 2018 with 303 versus 300 listings, a small change of 0.99%.
In Christchurch, the average house price has increased from $520,458 in January 2018 to $564,876 in January 2019 which is an uplift of 8.53%; starting 2019 the right way.
Written sales are back 3.5% from 314 to 303 alongside property currently listed with Harcourts back 7.38% from 1518 to 1406 when we measure January 2019 against January 2018.
For the Central Region, taking in Bay of Plenty and Waikato, the average sale price has risen by 13.99% to now sit at $547,742 for January 2019. New auctions, written sales and total listings have all increased over the same recorded period signalling prosperity in this region.
In the provincial South Island, the average sale price has seen a 2.59% increase on January 2018 rising from $410,911 to now sit at $421,563 in January 2019. All other measures were back on the same recorded period; however, this region still remains one of the most affordable to buy in throughout New Zealand.
ANZ today released its scheduled APRA APS330 report covering the quarter to 31 December 2018. Credit Quality remains stable with a Provision Charge of $156 million tracking below the FY2018 quarterly average.
The Group loss rate was 10 basis points1 (14 bps 1Q18). Group Common Equity Tier 1 (CET1) was 11.3% at the end of the quarter.Consistent with usual practice, ANZ also released a chart pack to accompany the Pillar 3 disclosure.
The chart pack once again includes an update on Australian housing mortgage flows and credit quality. Australia home loan system growth was 4.2%2 in the 12 months to end December 2018. ANZ’s Australian home loan portfolio grew 1.0% ($2.7 billion) in the same period with the Owner Occupier portfolio up 3.5% ($6.1billion) and the Investor portfolio down 3.8% ($3.2 billion). In the 12 months to the end of January 2019, ANZ’s home loan portfolio grew 0.4%.
ANZ’s home lending growth trends are attributable to lower system growth, ANZ’s preference for Owner Occupier/Principal and Interest lending which drives faster amortisation, together with policy and process changes implemented in the second half of calendar year 2018.
ANZ Chief Executive Officer Shayne Elliott said: “Consumer sentiment has remained generally subdued with uncertainty around regulation and house prices impacting confidence. While we are maintaining our focus on the Owner Occupier segment, we acknowledge we may have been overly conservative in our implementation of some policy and process changes. We are also taking steps to prudently increase volumes in the investor space”.
Switching volumes for those moving from Interest Only to Principal and Interest during the quarter was $6 billion, of which $4 billion was contractual. The total amount of contractual switching scheduled for the reminder of FY19 is $12 billion. Customers choosing to convert ahead of schedule during the first quarter was in line with the quarterly average for FY18 ($2 billion). Total switching in FY18 was $24 billion.
Eurozone (EZ) GDP growth now looks likely to slow to just 1% this year according to a report published by Fitch Ratings‘ Economics team. The deterioration in growth prospects and declining inflation expectations will prompt the ECB to consider restarting asset purchases.
Economic activity data from the EZ has deteriorated more
sharply than other parts of the world in recent months and has delivered
the biggest negative surprise relative to market and Fitch’s own
expectations.
“While numerous transitory factors are partly to
blame, these cannot explain the breadth and depth of the slowdown.
Rather, we believe that the slowdown has been primarily the result of
deterioration in the external environment as net trade turned from a
tailwind to a headwind,” said Fitch’s Chief Economist, Brian Coulton.
The
domestic slowdown in China has, we believe, played a particularly
important role here. Germany’s greater trade openness and larger
exposure to China leave the largest European economy’s expansion more
vulnerable to China’s domestic cycle and import demand. This is
underlined by Germany having seen the biggest deterioration in activity
data among the EZ economies – despite a healthy domestic economy with
few of the imbalances that typically spark an abrupt downturn in
domestic demand. Furthermore, the deterioration in manufacturing
Purchasing Managers’ Indices (PMIs) since last summer has been greatest
in countries with a large auto export sector, dragged down by the first
decline in global car sales since 2009 and the first fall in vehicle
sales in China for several decades.
The weakening in EZ
external indicators has not been matched in the domestic economy. Labour
market performance remains strong supporting household income growth,
monetary policy remains supportive, bank lending conditions are easy and
credit to households and businesses continues to grow. Only in Italy
have we seen evidence of private sector borrowers reporting somewhat
tighter credit availability. Fiscal policy is also being eased in the EZ
and should be supportive of growth in 2019. Private sector debt ratios
have improved significantly since 2012 in Italy, Spain and Germany.
EZ
growth should recover through the course of 2019 as the policy response
in China helps to stabilise its economy from the middle of the year,
one-off impediments to growth in Germany unwind, and EZ macro policy is
eased. However, early indications for 1Q19 and the profile of our China
forecast mean that there will not be much of a pick-up in EZ quarterly
growth before 2H19.
This suggests that EZ growth in 2019 is
likely to be around 1% compared with our December 2018 GEO forecast of
1.7%, a substantial cut. Both Germany and Italy will see similar
revisions, with 2019 GDP growth now forecast at around 1% and 0.3%
respectively. Even with this lower forecast, downside risks remain from
an escalation in global trade tensions, a deeper slowdown in China, a
disorderly no-deal Brexit or increased uncertainty related to domestic
political tensions.
The sharp deterioration in growth prospects
and falling inflation expectations are likely to result in renewed
monetary stimulus measures from the ECB.
“We had already been
expecting the ECB to delay the start of its policy normalisation -both
interest rates and balance sheet reduction – but we now believe it will
seriously consider restarting QE asset purchases relatively soon,” added
Robert Sierra, Director in Fitch’s Economics team..
We also
foresee the ECB announcing a one- to two-year long-term refinancing
operation (LTRO) in March to replace the existing TLTRO2 programme,
which matures from June 2020. The rationale for a new targeted LTRO
(TLTRO) is less convincing in light of improved conditions in the
banking sector, but the ECB will want to avoid an unwarranted tightening
in credit conditions by abruptly withdrawing liquidity facilities.
We discuss the latest data from Westpac and Bank of Queensland, look at off the plan building and consider financial advice versus general advice in the ASIC case.
Plus a quick reminder of tomorrows live streaming event where we update our scenarios.
Fitch Ratings has affirmed the ratings of Australia’s four major banking groups: Australia and New Zealand Banking Group Limited (ANZ), Commonwealth Bank of Australia (CBA), National Australia Bank Limited (NAB) and Westpac Banking Corporation (WBC). At the same time it has revised the outlook on NAB’s Long-Term Issuer Default Rating to Negative from Stable. The Outlook on CBA’s Long-Term Issuer Default Rating remains Negative, while it is Stable for ANZ and WBC.
The
rating review focuses on the Australian-domiciled entities within each
group and therefore does not encompass their overseas subsidiaries.
NAB
The revision of the rating Outlook to Negative reflects the risk that NAB’s focus on remediating issues and changing culture means its ongoing operations may not receive sufficient management time, resulting in a weakening of NAB’s earnings relative to peers. Management changes may make this task more difficult in the short-term. The affirmation of NAB’s ratings reflects Fitch’s expectation that the bank will maintain its strong company profile in the short-term, which in turn supports its sound financial profile.
The Royal Commission into Misconduct in
the Banking, Superannuation and Financial Services Industry and NAB’s
self-assessment on governance, accountability and culture identified
shortcomings within its management of operational and compliance risks,
culture and governance. These were not aligned to what Fitch had
previously incorporated into its ratings and resulted in a revision to
our score for management and strategy, which also remains on negative
outlook. NAB continues to have robust risk and reporting controls around
other risks, including credit, market and liquidity risk, as reflected
by its conservative underwriting standards and very high degree of
asset-quality stability.
Fitch expects NAB’s asset quality and
loan losses to display a very high degree of stability through business
cycles, but could be more volatile than that of some domestic peers due
to NAB’s greater business and corporate exposure.
Capitalisation
and leverage are maintained with solid buffers over regulatory minimums,
but ratios are at the lower end of those of domestic peers. However,
these are likely to trend towards domestic-peer levels as NAB progresses
towards meeting the Australian Prudential Regulation Authority’s
“unquestionably strong” capital requirements by the 1 January 2020
implementation date. Additional capital requirements should be met in an
orderly fashion given the bank’s strong market position and capital
flexibility, with its capital position likely to be bolstered by the
announced partial conversion of its NAB convertible preference shares
into ordinary equity and slower forecast loan growth. The bank’s
earnings and profitability are moderately variable over economic cycles
and it remains reliant on offshore wholesale funding. Sound liquidity
management provides some offset to this risk.
ANZ
The affirmation of ANZ’s ratings reflects the bank’s strong company profile and simple business model in its home markets of Australia and New Zealand, which support its financial profile. The bank’s strong market share across most products provides a higher degree of pricing power relative to smaller peers and allows it to generate strong and consistent operating returns through the cycle.
Australian
household debt is still high relative to international peers, meaning
households are susceptible to a sharp increase in interest rates or
rising unemployment. The risk of external shocks also remains prominent
in light of the geopolitical environment and potential impact on global
growth. However, none of these scenarios are in Fitch’s base case.
The
ongoing execution of ANZ’s simplification strategy supports the rating,
as it is likely to reduce complexity, provide greater focus on key
markets and improve the bank’s overall risk appetite. The focus on
remediating and rectifying issues identified in various inquiries,
including the royal commission, means there is a risk that the bank’s
ongoing operations do not receive sufficient management focus, resulting
in a weakening of its credit profile.
ANZ’s asset quality is
likely to deteriorate modestly in 2019. Earning pressure should continue
due to more modest loan growth, continued pressure on net-interest
margins, rising funding costs, a probable rise in impairment charges and
further remediation and compliance costs. ANZ maintains solid buffers
over regulatory capital minimums and its common equity Tier 1 (CET1)
capital ratio was the highest of Australia’s major banks as of September
2018. These buffers are likely to trend toward domestic-peer levels as
asset sales are completed and capital returned to shareholders. There is
a reliance on offshore wholesale funding, similar to other Australian
major banks, but liquidity is managed well.
CBA
The affirmation of CBA’s ratings reflects Fitch’s expectation that the bank will maintain its strong company profile in the short-term, which in turn supports its sound financial profile. The Negative Outlook reflects challenges in remediating shortcomings in operational and compliance risk management that contributed to a number of conduct and compliance issues over more than a decade. Management’s focus may be diverted from ongoing operations when rectifying these shortcomings and increased compliance costs might manifest in weaker earnings, particularly in relation to domestic peers.
CBA’s remediation of these
shortcomings is on track, but the process is only at an early stage and
is complex. There have been significant changes in the last two years to
the bank’s management and board, who appear committed to rectifying the
outstanding issues. The group is also in the process of exiting its
life insurance and wealth management operations, which may also distract
management from core operations. Successful completion of the
remediation and asset divestments without a significant erosion of the
bank’s franchise would support the current ratings. The remaining
operations after the asset divestments will focus on traditional banking
operations in Australia and New Zealand.
CBA retains a
market-leading position in Australian retail banking despite these
issues and has invested heavily in technology to combat the looming
threat of digital disruptors. The group continues to maintain
peer-leading profitability, while asset quality is sound and capital has
continued to improve. There is a reliance on offshore wholesale
funding, similar to the other Australian major banks, but liquidity is
managed well.
WBC
WBC’s strong company profile supports its ratings. The bank’s market share provides it with some pricing power relative to smaller peers in Australia and New Zealand and allows it to generate strong and consistent operating returns through the cycle, although in the short-term, we expect these to be affected by a challenging operating environment. In addition, WBC has been less affected by conduct-related issues than its domestic major-bank peers, meaning earnings may come under less pressure than for peers despite weaker system growth prospects. Nevertheless, WBC may still be susceptible to legal action from regulators and customers.
Partly
offsetting the risks from high household debt is WBC’s loan
underwriting, which Fitch believes is conservative in the global
context. WBC has progressively tightened its underwriting for mortgages
and commercial exposures, particularly property development, over recent
years. This was driven in part by the regulator, mainly in relation to
mortgages. The bank’s loan book is highly collateralised and we expect
its asset quality to remain a strength relative to that of international
peers, although loan impairments could rise modestly in 2019 from the
current low levels.
WBC is unlikely to have difficulties to
achieving “unquestionably strong” capital targets set by the regulator
before the 2020 deadline – its CET1 capital ratio was already above the
minimum at end-September 2018. Offshore wholesale funding reliance
remains a weakness relative to many similarly rated international peers,
although satisfactory liquidity management and diversification of
funding helps offset some of this risk.
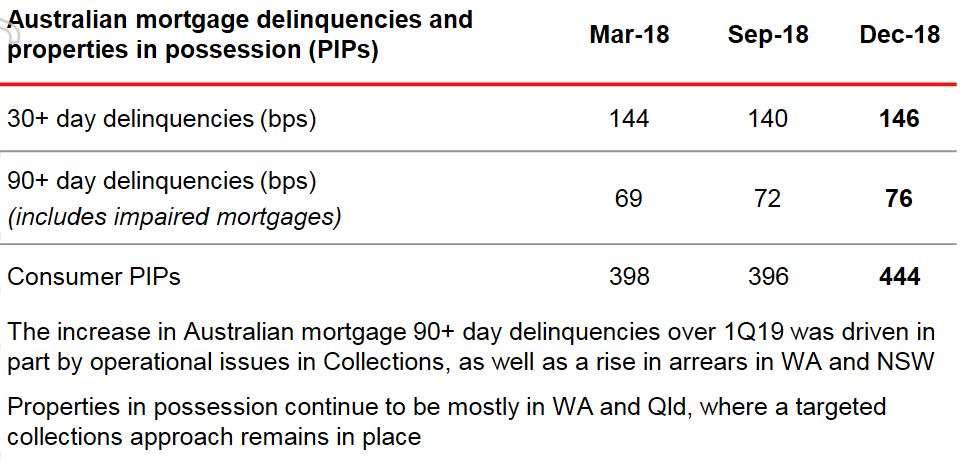
Westpac released their Pillar 3 report for December 2018, plus data on asset quality funding and capital. Of most interest to me was their mortgage data, which shows loan volume growth slowing, and rising delinquencies. The number of properties in possession rose from 396 to 444 in a quarter!
They said their audited statutory net profit for 1Q19 was $1.95 billion, comparable to 2H18.
They reported net interest margins excluding treasury was higher following repricing last year. There was a weaker contribution from treasury.
Provisions were $4,066 million compared with Sep 18’s $3,053.
On 1 October 2018 Westpac adopted AASB 9 and AASB 15. The models for implementation of these standards are still to be finalised and so current changes associated with implementation are preliminary and may change. These will be finalised with Westpac’s First Half 2019 results.
Some transitional impacts from the adoption of AASB 9 have included: i) an increase in collectively assessed provisions of $974 million; ii) a reduction in retained earnings and an increase in deferred tax assets; iii) a $3.9 billion reduction in risk weighted assets; iv) a rise in reported stressed assets; and• v) a 2 basis point increase in the CET1 capital ratio.
Impairment charge was $204 million. $30m pre-tax in insurance claims for Sydney hailstorms are expected.
Westpac showed the slowing in mortgage lending we are seeing across the majors.
Mortgage Interest only lending was 32% of portfolio at 31 Dec 2018 (down from 35% at 30 Sep 2018). Investor lending growth, using APRA extended definition, 0.8% pa
They have a portfolio of IO loans, some at 10 years plus. 16% expire this year.
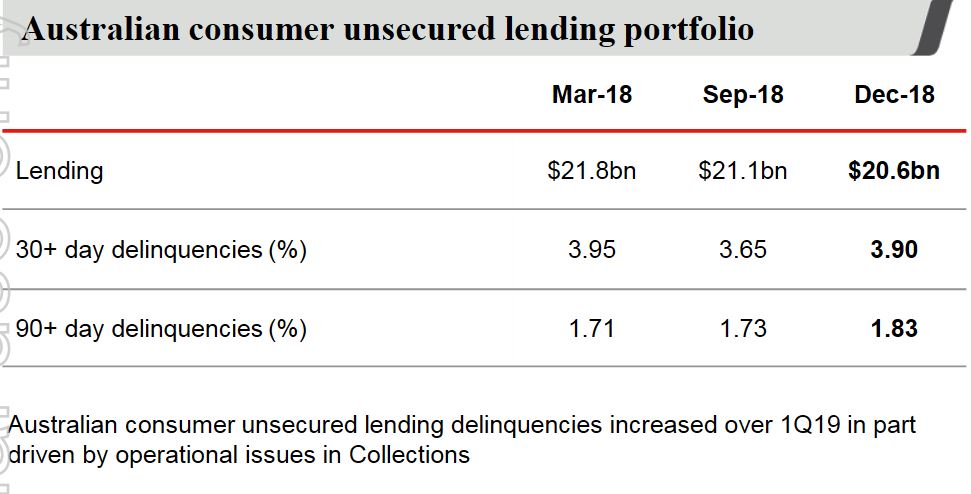
Australian mortgage delinquencies were 4 basis points higher over the quarter while Australian unsecured delinquencies were also higher, up 10 basis points. The number of properties in possession rose from 396 to 444 in a quarter!
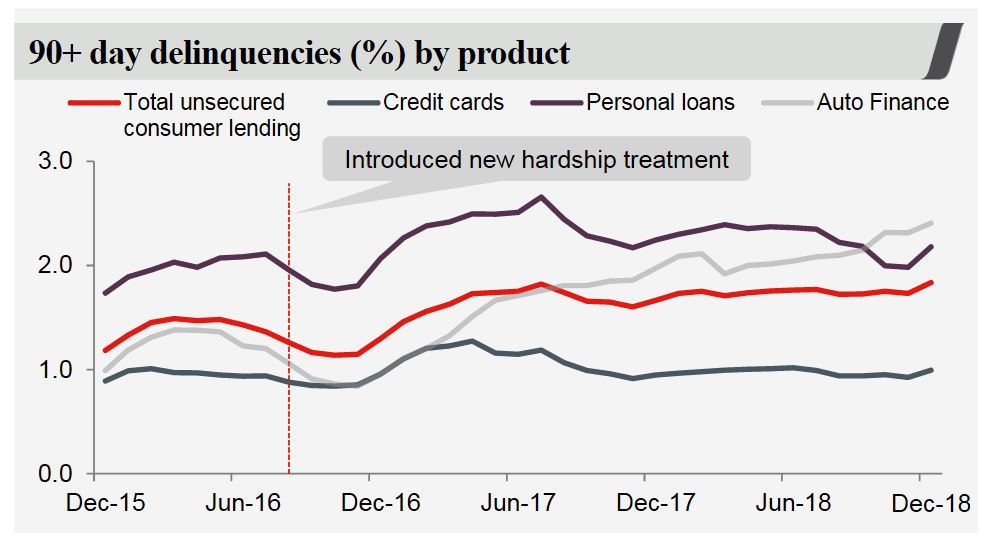
Australian unsecured 90+ day delinquencies increased to 1.83% (up 10bps over the quarter)
The Group’s common equity Tier 1 (CET1) capital ratio was 10.4% at 31 December 2018. The ratio was lower than the 10.6% reported for September 2018 after payment of Westpac’s final dividend (net of DRP), which reduced the CET1 capital ratio by 69 bps. Excluding the dividend payment, the CET1 capital ratio increased 49 basis points.
Liquidity coverage ratio (LCR) 128%, net stable funding ratio (NSFR) 112%
$16bn of term funding was raised during 4 months to 31 January 2019
Finally, a warning about capital.
Australia’s big banks may struggle to raise the amount of extra capital they require under new rules proposed by the country’s banking regulator, a senior executive at Westpac Banking Corporation said in an interview published on Monday.
The
mooted requirements, which the country’s four largest lenders said
would mean they need to raise between A$67 billion and A$83 billion over
four years ($48 billion to $60 billion) are sound in principle but
tough to achieve, Westpac treasurer Curt Zuber told the Australian
Financial Review newspaper.
“As we go through cycles, it is
potentially problematic for the banks to get the volumes they need in an
economic way for the system which allows for the balance we want to
achieve,” he said.
ASIC is appealing last year’s landmark Federal Court decision, determinedto prove two Westpac subsidiaries provided personal financial advice despite not being licensed to do so, via Financial Standard.
In
December 2018, Justice Jacqueline Gleeson determined Westpac Securities
Administration Limited (WSAL) and BT Funds Management (BTFM) had
breached the Corporations Act in 2014, during two telephone campaigns in
which staff recommended the rollover of superannuation accounts to
Westpac/BT super products.
However,
the judge said ASIC failed to prove the phone calls constituted
personal financial advice. Under their respective AFSLs, WSAL and BTFM
are only licensed to provide general advice.
ASIC has now filed an
appeal of the decision, seeking greater clarity and certainty as to the
difference between general and personal advice for consumers and
financial services providers.
“The
dividing line between personal and general advice is one of the most
important provisions within the financial services laws. It directly
impacts the standard of advice received by consumers,” ASIC deputy chair
Daniel Crennan said.
“This is why ASIC brought this test case and
ASIC believes further consideration by the full court of the Federal
Court is necessary to better inform consumers and industry.”
The
case concerned 15 phone calls which the judge determined to be general
advice “because the callers did not consider one or more of the
objectives, financial situation and needs of the customers to whom the
advice was given.”
However, in 14 of the 15 calls, the law was
breached by the implication that the rollover of super funds into a BT
account was recommended. While not dishonest, the product advice was not
provided efficiently, honestly and fairly, the judge deemed.
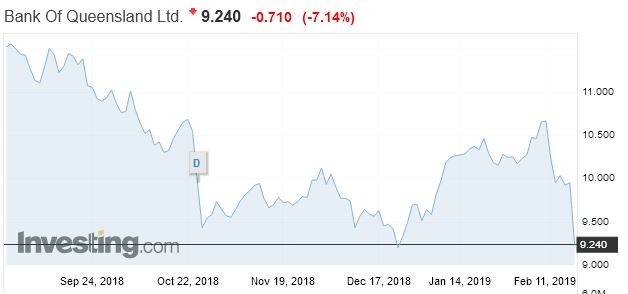
The Bank of Queensland released a trading and earnings update today, ahead of the half year results on 11 April 2019. Their shares dropped significantly and are ~18% lower than a year back.
They said the cash earnings will be in the range of $165-170m, compared with 1H18 cash earnings after tax of $182m.
This is driven by a fall in non-interest income, down $8-10m that $75m in 1H18, thanks to lower fee, trading, insurance and other income lines.
Plus net interest margin will be in the range 1.93% to 1.95% compared with 1.97% in 1H18, and will be around $475m.
There will be more non-recurring expenses, so expenses will be higher.
Loan impairments are expected to be int eh range of 11-13 basis points of gross loans. They say underlying quality remains good.
CET1 capital will be above 9.1% reported last time.
The say conditions will remain challenging with an increasing regulatory burden, including the outfall from the Royal Commission.
On 14 February, JPMorgan Chase & Co. announced that it has created and tested the JPM Coin, a new digital representation of US dollars redeemable at a 1:1 ratio in fiat currency, this despite CEO Jamie Dimon having slammed bitcoin as a fraud in the past .
The JPM Coin is for now a pilot offered to select client banks, broker-dealers and other corporations.
Would JPM Coin simply be a digital currency, rather than a cryptocurrency? If JP Morgan’s new coin operates privately and is only used for money transfers between the lender and its clients, it would not operate on a public network in the same way that cryptocurrencies such as bitcoin or ethereum do.
In addition to this, cryptocurrencies operate on public networks that anyone can join without permission and while in this case, it means that the many computers working together on the shared ledger is said to improve security (according to a recent Motherboard article), JPM coin will run on a blockchain network called Quorum, which requires permissions and users must be approved by JP Morgan.
Moodys says that although still at an early stage, the digital coin breathes some life back into blockchain technology, which was criticized during 2018 for falling short of proving tangible use cases. For value to be exchanged among participating members over a blockchain, a unit of account in digital format is needed. Consequently, the JPM Coin is designed to allow the bank’s clients to transfer value between participating members. The exchange from fiat to JPM Coin and vice versa would be done at a value equivalent to $1.00, but it promises to be instantaneous, reducing settlement time. Given that JPM Coin is currently offered only to JPM’s institutional clients, should the test prove successful, it could motivate new clients to join the JPM platform to benefit from its features. It is not clear how, or if, JPM will make the feature available to non-JPM clients.
The offering can potentially help the bank expand its ecosystem, allowing firms seeking instant value transfer to use this highly sought feature in the global movement of money and payments in securities transactions.
At its investor day last year, JPM guided for around $10.8 billion in technology spend for 2018. The combination of a highly profitable franchise and a dedication to technology reinforces JPM’s ability and willingness to innovate and defend its core payment franchises against disruptive threats.
Although a first-mover among US banks in the creation and testing of a digital coin, JPM Coin’s concept is not unlike fiat-backed “stable coins” that exist within the cryptocurrency sphere. Examples of stable coins include Tether and Coinbase’s USDC, which operate as digital coins designed to bypass the volatility inherent among cryptocurrencies. However, volatility is not the only risk that the JPM Coin promises to avoid: it also sidesteps counterparty risk. Stable coins offered by start-up crypto exchanges and platforms offer digital coin redemptions back into fiat currencies. However, a transfer back into fiat is only possible to the extent the platforms are capable of supporting the redemptions, which exposes the holders of stable coins to counterparty risk. Common concerns around the platforms’ creditworthiness revolve around the lack of confidence that the digital coin is in fact backed by an inventory of fiat currencies.
An ecosystem sponsored by JPM, with a counterparty risk rating of Aa1(cr) may garner higher trust than competing ecosystems. Operational risks have also plagued start-up digital currency exchanges that have often faced bankruptcy (Mt Gox, QuadrigaCX), fraud (Bitconnect) or cyberattacks (Coincheck).
In October 2017, JPM launched the Interbank Information Network (IIN), which currently has 157 banks signed up. The IIN is designed to facilitate the transfer of information using blockchain technology and aims to reduce costs for correspondent banks when dealing with wholesale payments, particularly when it comes to sharing of information to resolve payment delays. While IIN addresses information sharing, JPM Coin is designed to test the actual transfer of value.
In the latest from our New Zealand property expert Joe Wilkes, we look at the latest data with a focus on recent home price movements. Things are getting interesting!