The government has announced the panel that will lead the capability review of the Australian Prudential Regulation Authority as recommended by the Hayne royal commission; via InvestorDaily.
One of Commissioner Hayne’s recommendations in his final report on the royal commission was to conduct regular capability reviews into both ASIC and APRA with a review to be undertaken immediately for APRA.
In Mr Hayne’s report he noted that ASIC had recently undergone a review while APRA had not and therefore recommended it be the first to undergo one.
“I recommend that a formal capability review be undertaken of APRA, with that review being completed as soon as is reasonably practicable after the publication of this report,” he said.
Treasurer Josh Frydenberg as part of his response to the royal commission accepted the need for regular reviews and recently announced the independent panel that would lead the APRA review.
Former chairman of the ACCC Graeme Samuel will be chairman of the review and will be joined by Diane Smith-Gander a former senior executive at Westpac and Grant Spencer a former acting governor of the Reserve Bank of New Zealand.
Mr Frydenberg said the review would look into APRA’s ability to promote financial stability, as well as its capabilities to regulate superannuation entities and its enforcement activities.
“The APRA capability review will provide a forward-looking assessment of APRA’s ability to respond to an environment of growing complexity and emerging risks for APRA’s regulated sectors,” he said.
APRA and ASIC were found by the royal commission to be too soft on misconduct and prone to negotiate settlements and part of the panel’s role will be to review the authority’s readiness to respond to issues as raised in the commission.
APRA recently appointed John Lonsdale to lead a review into the authority’s enforcement policies, stating that it would be completed by the end of March this year.
The government has yet to respond to the recommendations that the APRA-administered BEAR be extended to insurers and super funds or that the principles of the BEAR regime be applied to the regulators as well.
APRA recently released a statement saying it was committed to implementing the recommendations with a plan to implement by the end of 2020.
“There are 10 recommendations requiring APRA’s direct attention. Of the 10, it is expected that nine will be completed by the end of 2020; of those, four are expected to be completed in 2019,” a press release from APRA said.
APRA also said it is examining 12 matters in relation to individual entities that were referred by the royal commission and is working with ASIC to address those.
APRA also said it would work with Treasury, ASIC and other stakeholders to implement the extension of BEAR and strengthening of trustee duties.
The panel will commence in March 2019 to report to the government by the end of June.
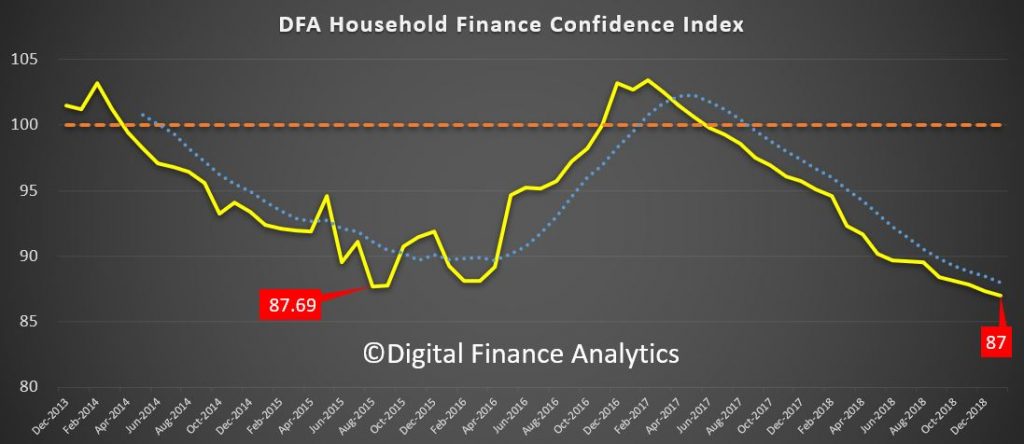
This is starting to look serious as the latest DFA household financial confidence index results for January 2019 reveals a further decline in levels of confidence.
The index fell to 87 in January, down from 87.3 in December, the lowest its been since the survey commenced, well below the neutral setting of 100.
By way of background, these results are derived from our household
surveys, averaged across Australia. We have 52,000 households in our
sample at any one time. We include detailed questions covering various
aspects of a household’s financial footprint. The index measures how
households are feeling about their financial health. To calculate the
index we ask questions which cover a number of different dimensions. We
start by asking households how confident they are feeling about their
job security, whether their real income has risen or fallen in the past
year, their view on their costs of living over the same period, whether
they have increased their loans and other outstanding debts including
credit cards and whether they are saving more than last year. Finally we
ask about their overall change in net worth over the past 12 months –
by net worth we mean net assets less outstanding debts.
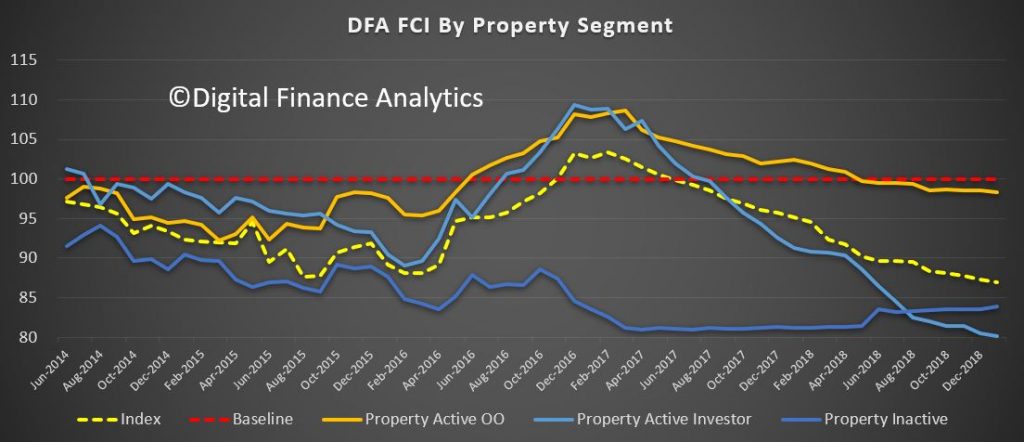
Looking at the results by property segments, we see a fall in confidence among property investors, as home prices and rental yields continue to fall, and reflecting concerns about potential changes to negative gearing and capital gains ahead. That said, purchase interest has risen a little. We will discuss this later.
Owner occupied borrowers are also feeling the heat, reflecting some mortgage price pain, as well as the basic affordability issues. Those renting however are a little more positive relatively speaking, thanks to rents being lower now and a greater choice of property for rent being available, especially in Sydney. Overall investors are the least confident now, a considerable switch from a year or so ago!
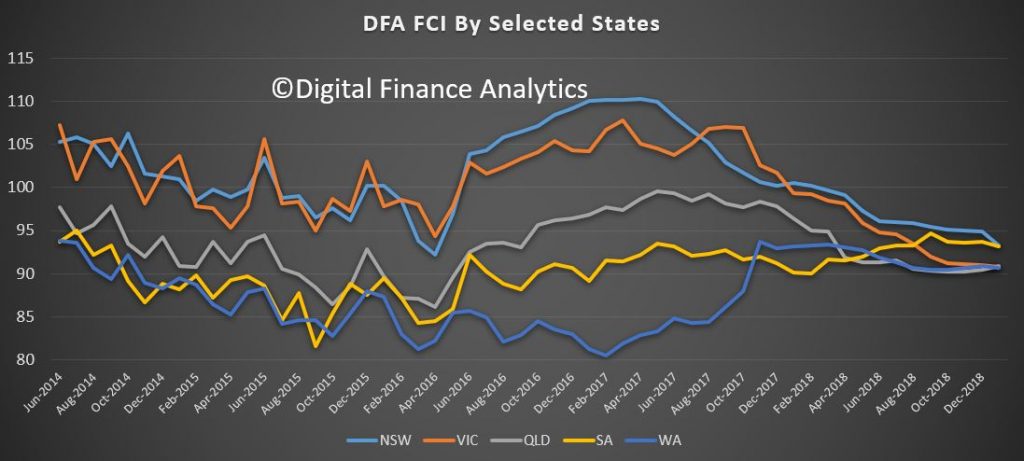
Cutting the data by states, we see that the bunching continues as property price falls in Sydney and Melbourne erode confidence there, relative to the other states. The most significant fall was in NSW, as home prices fall – and the fall out from Opal Tower had an impact more broadly on new purchases, and off the plan commitments.
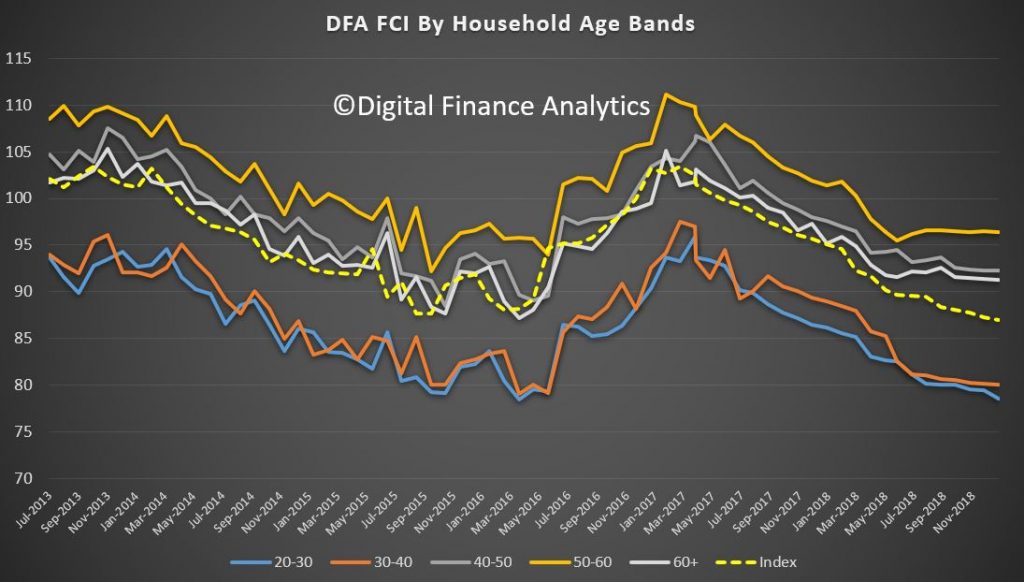
Across the age ranges we continue to see weakness, with younger households more exposed, although those older households with share market investments saw a rebound in January, which boosted their confidence a little.
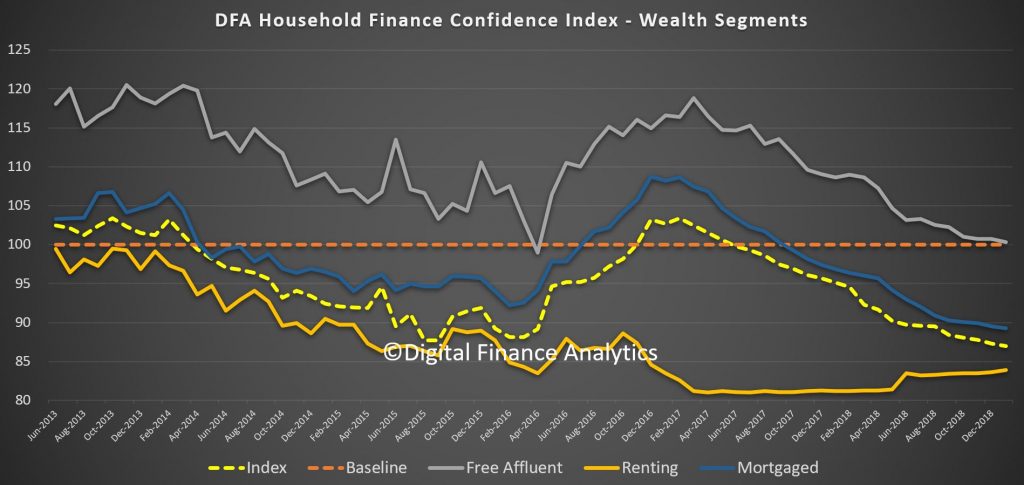
Turning to our wealth segments, we continue to see property owners without a mortgage the most confidence, though falling close to the long term neutral benchmark, while those with mortgages (either investor or owner occupied) continue to decline. Renters remain the least confident. This could become an important indicator in the run up to the next election, in that even those heartland voters supporting the incumbent Government are less positive than usual.
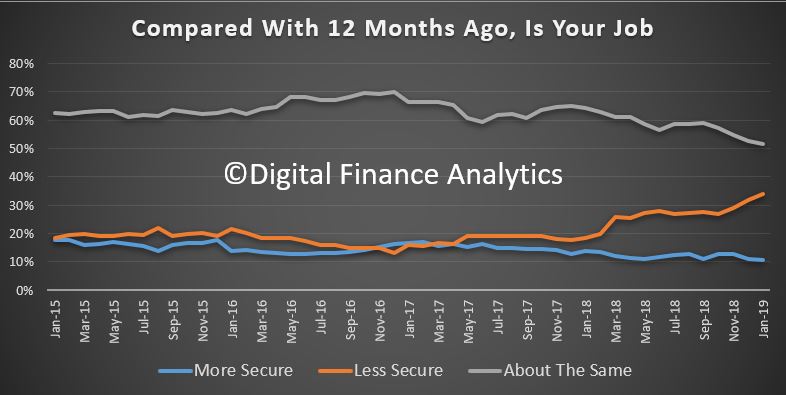
We can then examine the moving parts within the index. We start with job confidence. Those feeling more secure about their job prospects fell 2.19% to 10.57%, while those feeling less confident rose 4.84% to 33.85%. 51.68% saw no change, but that fell by 3.30%. There was a noticeable rise of concerns in the construction sector as building approval momentum falls.
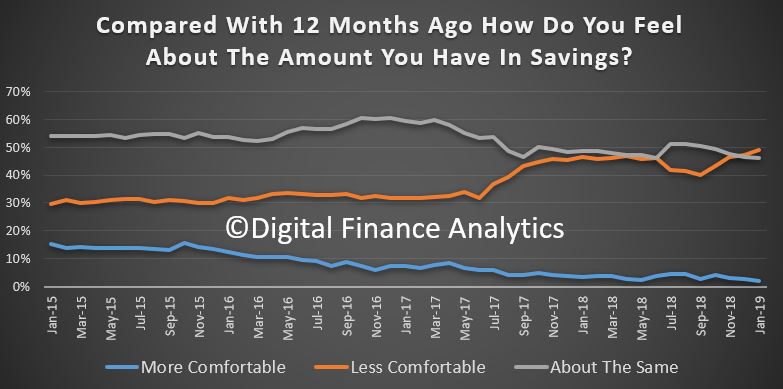
Savings rates continue to fall for many, and others are raiding what savings they have to maintain their lifestyles – something which of course cannot continue indefinably – one reason why the savings ratio continues to fall. June 1.98% of households were more comfortable than a year ago, down 1.28%, while 48.96% were less comfortable, a rise of 2.52%. 46.24% were about the same, down 1.56%.
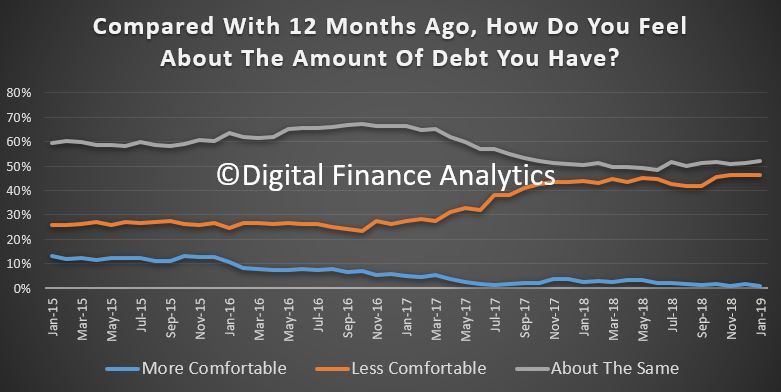
Turning to debt, 1.11% of households are more comfortable than a year ago, and 52% are about the same. 46% are less comfortable than a year back, thanks to rising rates, switches to interest and principal from interest only loans and problems in servicing the repayments. We also continue to see growth in quasi credit such as Afterpay, as well as other forms of short term credit. Household debt of course continues to rise faster than incomes or inflation.
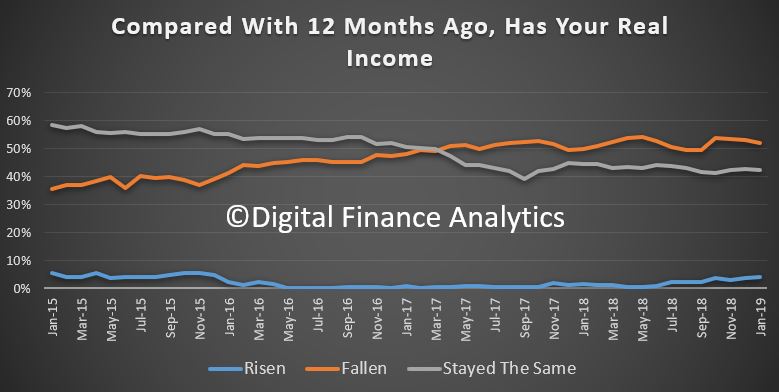
Income growth remains a real concern for many households (in real terms many have seen falls in recent years). 3.88% of households reported their real incomes had grown in the past year, 51.99% said incomes had fallen in real terms, and 42.5% said there had been no change. We continue to observe pressure on the income side of household balance sheets, despite the RBA’s expectation that wages will rise eventually. One bright spot was dividend payments which were higher, but this failed to offset the total picture.
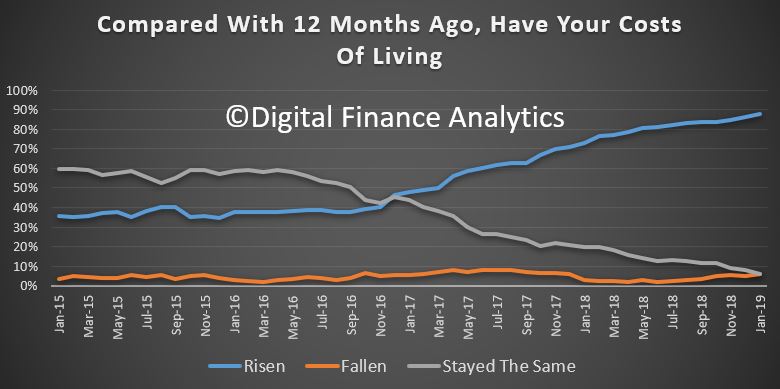
One of the killer categories is the costs of living. Once again we think the CPI figures just do not reflect the lived experience of many households. 87.75% said their costs had risen over the past year, up 3.2%. This includes the old favorites, electricity, child care, health care, and household staples, despite a fall in costs of fuel at the bowser.
And finally, household net worth continues to take a dive thanks for falling home prices – this despite recent positive share price moves. Overall 32.18% of households sand their net worth had improved, down 1.82% from last month, 37.28% said their net worth had fallen, up 4.05% and 27.42% said there had been no change, down 2.52%.
One other interesting point which came out from the analysis is that potential property investors are more active now, thanks to the falls in asking prices, and importantly, the burning fuse with regards to ending negative gearing should Labor win the next election. Thus we have seen a rise in investors considering transacting. Some lenders are offering “special” fixed rate offers, in the light of APRA’s hands off approach, and of course Hayne did not do anything on responsible lending. The tighter underwriting standards are still in play of course – for now – but I would not bee surprise to see a kick up in new investor lending in the weeks ahead, despite the lower levels of financial confidence.
In summary then, interesting times as household finances are squeezed, yet the fixation on property for many Australians remains strong. There is still a belief that falls will be limited, and they will bounce back. We are not so sure!
The fire at the Neo200 building on Spencer Street in the Melbourne CBD last week has eerie similarities to the Grenfell Tower disaster. Fortunately, instead of 72 people dead as at Grenfell, only one person was hospitalised for smoke inhalation.
Nevertheless, the building industry has responded straight from the
Grenfell song sheet. Rydon, the main contractor for the Grenfell Tower
cladding, said the work:
… met all required building regulations – as well as fire regulation
and Health & Safety standards – and handover took place when the
completion notice was issued by Royal Borough of Kensington and Chelsea
building control.
Neo 200 achieved certification and approval from the building
certifier and relevant authorities at the time. We welcome the
opportunity to support any investigation into the incident by
authorities.
This appears to be the property sector’s version of “thoughts and prayers”. We’re very sorry, but there’s nothing we can do.
Sadly, this is far from the truth. We have known of the risk for years and the problem can be rectified.
Governments must act to ensure the cladding identified as a fire risk
on hundreds of buildings is replaced. Further delay in fixing an
identified threat to life is unacceptable.
Before the Grenfell and Neo200 fires, Melbourne had a cladding fire at the Lacrosse building in 2014. This led to an audit of external wall cladding on buildings by the Victorian Building Authority.
Our investigations found dangerous materials are widely used on
buildings throughout Victoria, a finding that is consistent with
inquiries carried out interstate and internationally.
We now know that hundreds of residential buildings are rated as
either a moderate or high risk by the New South Wales and Victorian
governments. Over 350 buildings in Melbourne alone are rated “high
risk”. Neo200 was regarded as only a “moderate risk”.
Residential buildings are particularly vulnerable to the effects of a
cladding fire because people can be asleep and windows are often left
open. The amount of smoke generated by the recent Neo200 fire is
frightening.
In the UK, the central government has given local authorities the
power to replace risky cladding. We should do the same here.
Governments should take rectification out of the hands of dithering
strata committees and, if necessary, carry out the necessary work
directly and recover the costs from the responsible parties.
How did we get to this point?
Polyethylene-cored aluminium sandwich panels – often referred to as aluminium composite panels (ACP), PE or PU panels – were developed 50 years ago,
patented in 1971 and marketed as Alucobond. When the patent expired in
1991 other manufacturers entered the market, including products marketed
as Reynobond (originally Reynolds Aluminium) and Alpolic (Mitsubishi
Chemicals). Now, it is estimated over 200 manufacturers around the world
produce ACP panels.
By the 1990s, ACP was gaining a level of acceptance in the
Australasian construction market. This was aided by the introduction of
performance requirements to replace a previous blanket ban on
combustible materials being used on tall building facades. The timing of
the relaxation of the Building Code of Australia and the introduction
of ACP panels to the Australian market by multinational companies could
be a coincidence.
The general and technical press, including architectural magazines
with wide circulation, reported cladding fires in various types of
materials, including ACP.
What can be done to reduce the risk?
Clearly, a facade fire has serious consequences. The bedrock of all
modern fire regulations is that a fire in a tall building must be
confined to a single storey. A fire spreading from one floor to the
next completely undermines all the elements of protection and control
that make egress routes and firefighting viable.
As we saw at Grenfell, a fire that spreads up the facade and involves
nearly every storey in the building can’t be brought under control.
By 2000, there was widespread concern among fire professionals and some regulators that ACP was a bomb waiting to go off. A paper by Dr Gordon Cooke clearly outlined the risks. It makes chilling reading in the light of the Grenfell disaster.
Luckily, most tall residential buildings in Australia with
combustible ACP cladding have internal sprinkler systems – unlike
Grenfell. We might also be able to buy some time by banning barbecues
and smoking on balconies, but it is doubtful this will be 100%
effective. Another possibility is to physically secure balcony doors
shut, but many owners and tenants might strongly resist this draconian
measure.
As the Neo200 fire demonstrates, even a moderate risk is still quite
risky. It is extraordinary that a fire allegedly lit by a single
smouldering cigarette could spread so quickly across seven floors and
generate so much potentially deadly smoke.
An urgent cladding replacement program certainly has its challenges. A
campaign that involves working on several hundred buildings at once in
Melbourne and Sydney might overload the industry.
Nevertheless, the situation has been created by a lack of action by
governments. Only decisive government action can rectify it. No more
“thoughts and prayers”, enquiries or investigations; just replace the
cladding now.
Author: Geoff Hanmer, Adjunct Lecturer in Architecture, UNSW
David Malpass
is currently Under Secretary of the United States Treasury with
responsibility for International Affairs, and his previous experience
includes being chief economist at Bear Stearns prior to their collapse.
Our Treasurers support is wrong headed.
No matter what the strengths of David Malpass, the next World Bank President should not be American.
After World War Two the victors designed many of our global
institutions, including the World Bank, and the International Monetary
Fund. Major global institutions were headquartered in Europe or the
United States, and there was an agreement that the World Bank President
would be a US citizen, while the IMF would be headed by a European.
This cosy arrangement was fine for most of the 20th century, but is at odds with our 21st century world.
Trump’s unspoken ultimatum
It has been suggested that Trump would follow his usual negotiating
tactics and withdraw support from the World Bank if the next chief is
not American, which is presumably why some countries including Australia
are likely to support Malpass.
The search for the US nomination was headed by Steven Mnuchin and Ivanka Trump, with Invanka Trump herself mentioned as a possible nomination.
Malpass may be a better candidate than the President’s daughter, but I doubt it.
Malpass has been a critic of World Bank lending to China and at Bear Stearns he ignored warning signs of crisis in 2007.
But it’s not so much Malpass’ dubious credibility that is the
problem, but the idea that the President should always be American.
The American might not be the best candidate
Important global institutions should be led by the best candidate.
The views and expertise of emerging market candidates, particularly from
larger economies such as China, India, Brazil, Nigeria and Indonesia
should be taken more seriously.
In recent years the IMF would have been much better led by a
non-European. The decision to bail out French and German banks at the
expense of the Greek economy in 2012 was a poor decision made by the
French head of the IMF.
The IMF rightly supported restructuring of banks and financial
markets after the Asian Financial Crisis in 1997, but did not push for
the same for European or US banks after 2008.
So what if Australia and other middle powers did not support Malpass’ nomination?
Better off without the World Bank?
A US withdrawal from the World Bank would probably see its demise. But so what?
The World Bank has become relatively toothless.
Last year China lent more money to emerging market economies than the World Bank.
And this is the point. China needs to be brought into the World Bank and other institutions more fully, not sidelined.
Problems with governance and other issues with China’s Belt and Road initiative would be much better handled by a multilateral agency, whether that is a properly renewed World Bank or a new institution.
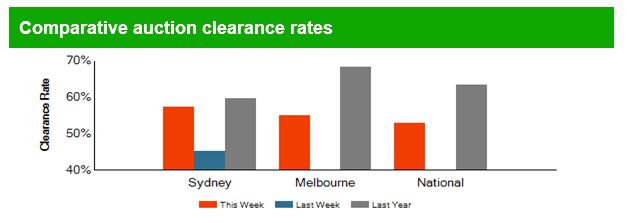
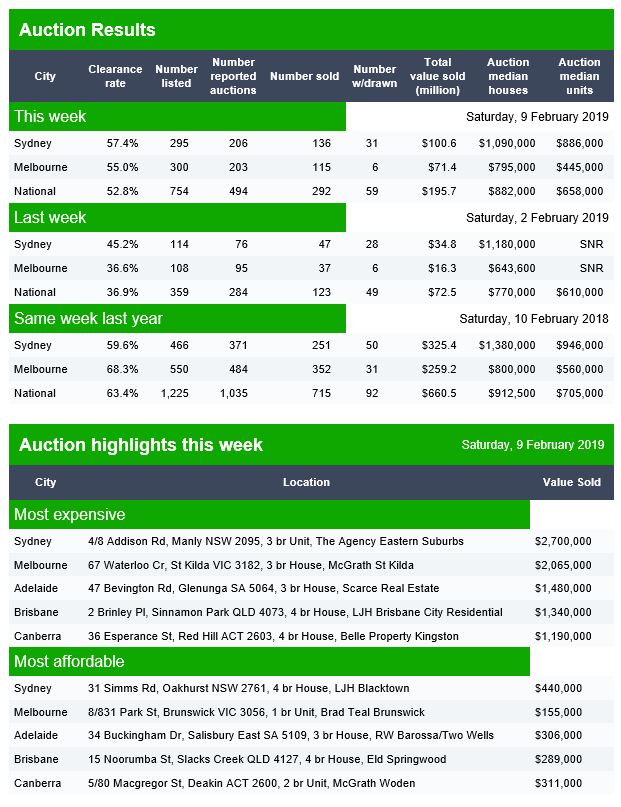
Now the new year has kicked off, we are getting the preliminary auction results from Domain.
It seems that despite the hype (all those “willing buyers” the agents keep talking about), the volume and rate of auction clearances appear to be tracking the weakness late last year.
Once again, their 40% floor means the the final results both nationally and in Melbourne are not showing. National result was 36.0% last week, compared with 63% last year!
They report that in Brisbane 64 auctions were listed, 30 reported and 10 sold, with 17 withdrawn making a Domain clearance rate of 21%.
In Adelaide, 56 were listed for auction, 25 were reported and 15 sold, with 4 withdrawn, giving a Domain clearance rate of 52%.
In Canberra, 39 were listed for auction, 30 reported and 16 sold, with 1 withdrawn, giving a Domain clearance rate of 52%.
Final results will settle in a few days, as normal.
Welcome to the Property Imperative weekly to the ninth of
February 2019 – our digest of the latest finance and property news with a
distinctively Australian flavour.
This was a mega week in which the Royal Commission reported, mortgage brokers were crushed, the RBA cut growth expectations, and we saw more confirmation of the pressures on households. And NAB lost both its Chairman and CEO. So let’s get started.
Read the transcript or watch the video.
The final report from the Royal Commission was disappointing, in that
whilst 20 plus companies will be referred for potential criminal proceedings,
and NAB was called out for not getting it, and the 76 recommendations may be
worthy, – we discussed the recommendations in more detail in our post “A Banking Royal
Commission Special Report” , the report failed to address two
critical issues. Hayne has left lending practices where they are (yes, the
banks have tighter standards now, at least temporarily, but he left the
household expenditure measure benchmark question hanging) and failed to address
the question of conflict between providing advice and selling financial
services products, which was at the heart of the hearings. Too often advice let
to customers buying products which maximised the income of advisors and firms, when
they were not necessarily in the best interests of said customer. See our post “Why The Royal Commission Report Is A Fail”.
Paul Keeting, the architect of financial deregulation in the 1980’s was
quoted as saying in the Australian “The royal commissioner should have
recommended — this conflict between product and advice — be prohibited. This he
monumentally failed to do. He should have acted upon the examination and the
evidence of these serious conflicts of interest.”
Finance sector stocks when higher before the report was released, and
some are suggesting insiders made $20 billion or so as a result. A leak was
denied by The Government of course, but we are not so sure. There were massive stock movements at 11:00
am on Monday, when remember the report was made public AFTER the market had
closed at four PM.
Mortgage brokers got a shock, because their business models are potentially
crushed. The Commission proposes that trail commissions – payments in
subsequent years to brokers by banks for loans they introduced – should be
banned – as quote “they are payments for no value”. And in due course brokers
need to move to a fixed fee arrangement, paid for by the borrower, which would
make the arrangement more transparent, but may restrict competition, and swing
momentum back to the big banks, who would be set to benefit. I discussed this
with mortgage broker and financial adviser Chris Bates – see “What Does The Hayne
Report Mean To Mortgage Brokers And Financial Advisers?”. They will also be given a requirement to act
in the best interest of their clients, something which is assumed by many
customers of brokers today, but which is not currently the case.
So, in summary, Hayne will be remembered more for the exposes in the
hearings, where the bad conduct and criminal behaviour of the finance sector were
revealed, rather than firm recommendations to make substantive changes. It
mostly falls back to the institutions and regulators to heal themselves. I am
less confident, so expect bad practice to continue. NAB lost their chairman and CEO, they were
both called out as not getting the problem in the bank – and it is possible
that other heads will roll as criminal proceedings commence, but I suspect most
will remain unpunished.
The RBA had a big week, with Governor Lowe speaking at the National
Press Club on Wednesday, and then releasing the Statement on Monetary Policy on
Friday. Lowe’s view is that economic growth will slow a bit compared with
previous forecasts – 3% this year and 2.75% beyond. He believes income growth
will start to lift as the unemployment rate slides further. He thinks this will
be enough to keep the economy ticking over. Despite this, there is now, he says
equal weight to both a fall in the cash rate or a rise. And in the SMOP, there was recognition that
falling home prices may have a dampening effect on consumption and growth as
the “wealth effect” dissipates. Many
suggest, this downside risk is still underplayed. Plus, the new headline inflation number for
June 2019 came it at a low 1.25% in the statement, which is a significant
reduction.
Damien Boey at Credit Suisse said “We cannot help but feel that the RBA
is missing something in all of this, hence its rather shallow downgrades to
consumption growth forecasts, and its optimistic forecast for only a 10%
reduction in residential investment this year. … If the Bank does not
understand or admit to the nature of banking and credit problems, it will
always think that the economy is healthier than it is. It will always have too
high a view of the potency of rate cuts, and therefore delay them until the
last minute”.
Westpac’s Bill Evans said of the
RBA’s move, “This move to a balanced
rate outlook is significant because it clearly establishes that the Bank is
prepared to contemplate rate cuts – a position that has really only emerged
since the housing markets have reversed. It is also consistent with changes
announced by other central banks notably the US Federal Reserve.” Of course, bond rates remain higher in the US
than here, which is unusual, and signals higher bank funding costs ahead. This was something which CBA signalled in
their results out this week. So, I am expecting more out of cycle mortgage rate
hikes ahead.
My own view has been for some time that cash rate cuts won’t have much
impact, but thanks to the budget trends, there is capacity for quite big tax
cuts to try and stimulate consumption. I expect the upcoming budget to start
that trend, and there will be more fiscal loosening later in the year as the
economy weakens.
The latest news on home prices is more of the same. Down, down, prices are down. CoreLogic’s 5-city dwelling price index slide another 0.24%. The quarterly declines are rising to 3.57% and values have fallen by 8.5% since their most recent peak, with Sydney down 12.5%, Melbourne down 9.0% and Perth down 16.7%. Remember these are averages, and in some areas, prices are down more than 20%; with more to come. And the auction results remain in the doldrums, on low volumes and clearance rates the national auction clearance rate dropped 5.0% to 42.8%. In Sydney auction clearance rate fell by 4.2% to 49.5% though in Melbourne it rose a tad to 44.3%, both well below the trends from a year ago.
And by the way CBA senior economist, Gareth Aird showed the correlation
between home prices and jobs growth, which goes counter to the RBA’s view that
jobs momentum will support prices.
Another reason why we think prices will go on sliding.
All of this is in stark contrast to the ME Bank Household Comfort report
out this week. The most shocking chart
was the high proportion of households who still think prices will rise. Only
13% of homeowners and 11% of investors expect the value of their properties to
fall this year, versus 38% of homeowners and 52% of investors that believe
property prices will rise either a “little” or a “lot”. Clearly more should be
watching our shows. But then price growth expectations, are wired in – many
have never seen falls – and the real estate sector, still are saying things are
on the turn, and she’ll be right. Sorry, to disappoint, but there are more
falls to come. And by the way that same
report said it was the renting sector who are felling more bullish as rents
slide.
The ANU, as reported in the Australian, said that the average household
has seen no gains in their after-tax income since the end of 2010, which was
when the economy was emerging from the global financial crisis. According to ANU’s
Centre for Social Research and Methods, the fall in the past three years was
greater than during the last recession in 1991-92. In fact, living standards
peaked in 2011. There was no improvement for the next four years, but incomes
started falling behind rising living costs from late 2015 onwards. Many will
not be surprised, and it helps to explain why we think household consumption
will continue to fall.
NABs surveys this week also highlighted concerns among households. They
said that anxiety increased most over the cost of living, and despite a healthy
labour market, concerns over job security also climbed to its highest level
since mid-2016.
“In terms of household finances, retirement remains the big worry,
followed by providing for the family’s future, raising $2,000 for an emergency,
and medical and healthcare costs”.
“Against this background, almost four in 10 Australians said they had
experienced some form of financial hardship last quarter, the highest in two
years.” And importantly spending plans are being curtailed, which will flow on
to lower growth of course.
And our own
mortgage stress data for January underscored the pressure on
households. The long grind in WA
continues, with more households under financial pressure, but we are seeing
further deterioration in other states too. The number of households in severe
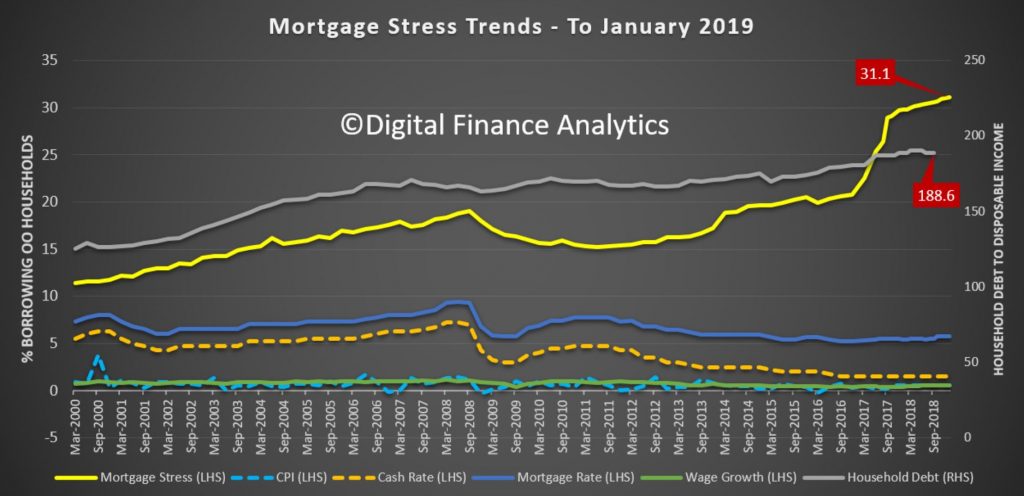
stress continues to rise. The latest RBA data on household debt to income to
September fell a little to 188.6, but remains highly elevated. The housing debt
ratio continues to climb to a new record of 139.6, according to the RBA. This shows that household debt to income is
still increasing. This high debt level
helps to explain the fact that mortgage stress continues to rise. Across
Australia, more than 1,026,106 households are estimated to be now in mortgage
stress (last month 1,023,906), another new record. This equates to more than
31% of owner-occupied borrowing households. In addition, more than 25,750 of
these are in severe stress (last month 22,000). We estimate that more than
63,000 households risk 30-day default in the next 12 months, up 1,000 from last
month. We continue to see the impact of flat wages growth, rising living costs
and higher real mortgage rates. Bank
losses are likely to rise a little ahead. See our Video “Mortgage Stress
Exists – Believe It!”
Despite the popular view that household finances are fine, in fact the
continued accumulation of larger mortgages compared to income whilst costs are
rising, and incomes static explains the issues we are now seeing. Housing credit growth is running
significantly faster than incomes and inflation and continued rises in living
costs – notably child care, school fees and electricity prices are causing significant
pain, this despite some relief at the bowser. Many continue to dip into savings
to support their finances. We are
seeing a rise in households seeking help with their finances, including access
to debt counsellors and other advice channels. WA is seeing very strong growth
in cries for help!
Indeed, the ABC reported that the National Debt Helpline said calls had
skyrocketed in Western Australia amid epidemic of financial stress. And we note
that the Treasurer just announced a review of financial counselling: “ It
will consider gaps and overlaps in current services and the adequacy of
appropriate delivery models for future funding”. Last week John Adams and
I highlighted the
possible link between mortgage stress and family violence, as suggested by the
police.
And finally in our local round up, Business Confidence is
also tanking according to Roy Morgan Research who released their Survey for
January. They say that confidence has dropped to its lowest level since August
2015 and it was the worst January result ever. “The decline in Business
Confidence to begin 2019 comes amidst a slew of poor economic news with
significant declines in house prices in Sydney and Melbourne over the last 12
months now joined by lower than expected retail trade figures for December”. This
is consistent with the NAB results we reported last week.
So, to the markets. Locally, the ASX 100 had a good run, as the Hayne effect dissipated. The index slid a little on Friday though thanks to the RBA’s downgrades, slipping 0.3% to end at 5,006.4, territory not seen since October, and up 3.56% on a year ago. The local volatility index was down 0.29% to 12.90, and 30.48% lower than a year back, reflecting a “risk on” peak back then.
Since the FED turned turtle on its interest rate policy, the markets confidence is roaring back. Not surprisingly, the ASX Financials Index was up this week, as banks were back in favour, despite a small fall on Friday, to end at 5,911.90, still 5.71% lower than a year ago. Individual banks moved round a bit with ANZ up 0.11% on Friday to end at 26.89, down 2.79% from a year back. CBA also rose, up 0.93% on their results, which revealed strong capital but weaker margins and profit below expectation and ended at 74.75, which is 2.58% lower than a year back. NAB fell following the resignation of the CEO and Chairman, to end at 24.75. In fact, this is not the first time NAB has lost leadership after a crisis. Their shares are down 12.27% lower than a year ago, suggesting that relative to peers they have a lot to do to regain market confidence. Their quarter disclosure which came out on Friday, would have not lifted expectations, as again margin is under pressure, and capital fell. It will be interesting to see if the proposed divestments of NABs and CBA wealth businesses continue given Haynes weak recommendations. Strategy may yet be reversed. Westpac fell 0.33% on Friday to end at 26.79, and down 10.84% from a year back. They still have their wealth businesses.
Among the regionals, Bank of Queensland rose 0.09% to 10.66, but is still 10.56% down from a year ago. Suncorp fell 0.22% to 13.61, up 3.73% from last year, and Bendigo and Adelaide Bank fell 1.59% to 11.15, up 0.36%. They may be more impacted by the proposals to charge customers for mortgage advice. AMP was down 1.21% on Friday, having had a small bounce from the Royal Commission report, because it will allow them to continue to run their advice and product businesses in tandem. AMP ended at 2.44 and remains 51.49% lower than a year ago. Macquarie fell 1.23% to 121.57, but is up 19.5% from a year back, benefitting from its international businesses.
Lenders Mortgage Insurer Genworth was up 1.62% on the
latest results, which showed a strong capital position, even if mortgage
delinquencies were a little higher, especially in NSW. They ended at 2.51 and
is 10.58% lower than 12 months ago. Given lower mortgage volumes, their growth
appears limited and if household pressures continue, we must expect more
defaults ahead. Mortgage Choice, the aggregator, was hit by the Hayne
recommendations on mortgage brokers this week, but rose on Friday, up 2.44% to
84 cents, down 62.61% from a year ago. Given they have advice businesses in
their portfolio, I suspect they might do quite well from the changes, if they
can morph their business effectively.
The Aussie ended the week at 70.91, up 0.04%, having been
above 72 earlier in the week after the Hayne report came out. But the RBA’s
neutral stance on future interest rates – signalling more trouble in the
economy, dragged it back. We still expect further falls ahead. It is still
9.89% lower than a year ago.
The Aussie Gold Cross rate rose 0.49% to end at 1,853.59,
up 9.97% on a year ago, while the Aussie Bitcoin Cross rose 4.88% to 4,672.3,
down 53.42% on a year back.
Overseas, at the close, the Dow Jones Industrial Average
declined 0.25%, to 25,106.33 and is 1.11% up from a year back. The S&P 500
index gained 0.07%, to 2,707.88 and is up 0.91% from a year ago, It has risen
more than 15 percent from 20-month lows in December, spurred by a dovish
Federal Reserve and largely positive fourth-quarter earnings, as well as hopes
for an eventual U.S.-China trade deal, despite lingering scepticism over the
United States and China reaching a trade deal before the March 1 deadline. Of
the S&P 500 companies that have reported quarterly results, 71.5 percent
have beaten profit estimates but analysts now expect current-quarter profit to
dip 0.1 percent from the year before, not grow the 5.3 percent estimated at the
start of the year. The S&P 100 was down a little to end at 1.190.16, up
0.28% over the year. The CBOE Volatility Index, which measures the implied
volatility of S&P 500 options, was down 3.97% to 15.72 and is down 40.97%
form 12 months ago. The S&P Financials index was down 0.94% on Friday to
427.88 and remains 8.02% down from a year back. Bellwether Goldman Sachs fell
0.73% on Friday to 191.67 and is 24.89% lower than last year.
The NASDAQ Composite index climbed 0.14% to 7,298.20 on
Friday and is up 3.35% from last year at this time. Apple was up 0.12% to 170.41 and is 7.15%
higher than last year. Google’s Alphabet fell 0.32% to 1.102.38 and is 4.78%
than a year back. Amazon fell 1.62% to 1,588.22 but is 13.95% higher than 12
months ago and Facebook is up 0.57% to 167.33, down 7.66% from a year back.
Intel fell 0.79% to 48.84 and is up 8.52% from last year.
Investors remain jittery about trade tensions between the
U.S and China, which have been the catalyst for the global trade war that
rocked equity markets. Although the sides met for talks last week in
Washington, there have been no signs of progress. On Thursday, U.S. stock
markets fell after President Trump said that he had no plans to meet with Chinese
President Xi before March 2, when further U.S. tariffs are scheduled to be
imposed.
The Feds pussy cat approach to future rate rises has seen
the 10-year bond rate come back, and on Friday it was at 2.63, down 0.76%. The
3-month rate was at 2.42, up 0.41%. The
US Dollar index was up 0.13% to 96.64, up 7.04% from last year, while the
British Pound USD slid a little to 1.2945 and is 6.71% lower than 12 months
back.
The UK Footsie was down 0.32% to 7.071.18 as the Brexit
discussions continue, and the deadline looms. Its down 2.55% from a year back.
The Footsie Financials Index was down 0.84% to 646.19, down 3.85% from last
year. The Euro USD was at 1.1331, down 7.53% from 12 months back. The European
Commission has projected moderate growth in the EU in 2019, but economic
uncertainty has dampened confidence. The forecast lowered its growth forecast
for the eurozone to 1.9% in 2018, down from 2.1% in the November forecast. The
report highlighted Brexit and the slowdown in China as key sources of uncertainty
for European economies, adding that the projections were subject to downside
risks.
Deutsche bank was down 2.56% on Friday, to 7.223 and is 40.09% down from
this time last year. The Chinese Yuan US Dollar ended at 0.1483 and is 7.02%
lower than last year. Crude Oil Futures rose a little, up 0.11% to 52.70 but
remains 15.08% lower than last year at this time.
Gold futures were higher, up 0.32% to 1,318.35, down 2.48% from a year
ago, Silver was up 0.73% to 15.83 and is 3.04% lower than last year, while
Copper was down 0.55% to 2.81, down 8.29% from 12 months ago. And finally, the
Bitcoin USD ended the week at 3.716.9, up 8.17% but is still 54.69% lower than
a year ago. The total capitalization of the derivatives markets at BTC/USD was
$156 million US Dollars. Worth bearing in mind how small the market truly is!
So, we see the change in the wind which the Fed triggered earlier in the
month flowing on to strong markets, despite the uncertainties around global
growth ahead. Locally as the dust settles on the Hayne report, we expect bank
stocks to remain volatile – remember there are still more criminal cases in the
works – eventually. But meantime the focus will be on the Australia economy, as
the leading indicators signal more trouble ahead, and the RBA plays catch up.
In this context, there can be little expectation of a rebound in home
prices, nor a resurgence of lending for mortgages, I think the current settings
will mean falls continue, and may accelerate. The next thing to watch for are
“unnatural acts” fiscally speaking when the budget comes down in April, before
a May election. Unless something unexpected resets the timetable.
Meantime, my advice remains be very cautious about property. There is no
hurry to buy. Falling prices may offer opportunity later, but buying into a
falling market, even at these low interest rates is tricky, and as I have
indicated I expect more out of cycle hikes to come. So, caution is the watch word. But the good
news/bad news is the risk of a financial apocalypse has abated in favour of
another round of debt creation – which postpones what may well be eventually a
significant reset. We will update our
scenarios soon.
And before I go, a quick reminder that our next live stream event is now scheduled for Tuesday 19th February at 8:00 PM Sydney – here is the link to the reminder. You can ask a question live or send them in beforehand. I look forward to seeing you there.
And by the way, if you value the content we produce, please do consider supporting our efforts. You can make a one off donation via PayPal, or consider joining our Patreon programme. We really appreciate your support to help us continue to make great content.
To lose one is unfortunate, to lose two… well… Tough times for certain senior bankers!
In an ASX statement NAB said that CEO Andrew Thorburn will finish at NAB on 28 February, while Dr Ken Henry indicated that he would retire from the board once a new permanent chief executive had been appointed.
The NAB board said it will
initiate a global search process for the chief executive role while
actively considering a range of internal candidates.
In addition, it has asked
director Philip Chronican to serve as acting chief executive effective 1
March until an appointment is made.
Mr Thorburn said it has been an honour to be the chief executive of NAB, and to have been part of NAB since 2005.
“I acknowledge that the bank has
sustained damage as a result of its past practices and comments in the
royal commission’s final report about them,” Mr Thorburn said.
“I have always sought to act in the best interests of the bank and customers and I know that I have always acted with integrity.
“However, I recognise there is a
desire for change. As a result, I spoke with the board and offered to
step down as CEO, and they have accepted my offer.”
Dr Henry said the board had recognised that change was necessary.
“The timing of my departure will minimise disruption for customers, employees and shareholders,” he said.
“This is naturally a difficult
decision but I believe the board should have the opportunity to appoint a
new chair for the next period as NAB seeks to reset its culture and
ensure all decisions are made on behalf of customers.”
Mr Chronican said he was
privileged to have been asked to step in as acting chief executive while
the board selected a new chief executive.
“I recognise the important responsibility in stepping into this role at a difficult time for NAB,” he said.
“I am confident in our existing
strategy to transform the bank to be better for customers and will work
with everyone at NAB to earn the trust and respect of the community.”
Digital Finance Analytics (DFA) has released the January 2019 mortgage stress and default analysis update. The long grind in WA continues, with more households under financial pressure, but we are seeing further deterioration in other states too. The negative wealth effect is biting now.
The number of households in severe stress continues to rise. The latest RBA data on household debt to income to September fell a little to 188.6[1], but still remains highly elevated. The housing debt ratio continues to climb to a new record of 139.6, according to the RBA. This shows that household debt to income is still increasing.
This high debt level helps to explain the fact that mortgage stress continues to rise. Across Australia, more than 1,026,106 households are estimated to be now in mortgage stress (last month 1,023,906), another new record. This equates to more than 31% of owner occupied borrowing households.
In addition, more than 25,750 of these are in severe stress (last month 22,000). We estimate that more than 63,000 households risk 30-day default in the next 12 months, up 1,000 from last month. We continue to see the impact of flat wages growth, rising living costs and higher real mortgage rates. Bank losses are likely to rise a little ahead.
Our analysis uses the DFA core
market model which combines information from our 52,000 household surveys,
public data from the RBA, ABS and APRA; and private data from lenders and
aggregators. The data is current to the end of January 2019. We analyse
household cash flow based on real incomes, outgoings and mortgage repayments,
rather than using an arbitrary 30% of income.
Households are defined as
“stressed” when net income (or cash flow) does not cover ongoing costs. They
may or may not have access to other available assets, and some have paid ahead,
but households in mild stress have little leeway in their cash flows, whereas
those in severe stress are unable to meet repayments from current income. In
both cases, households manage this deficit by cutting back on spending, putting
more on credit cards and seeking to refinance, restructure or sell their home. Those in severe stress are more likely to be
seeking hardship assistance and are often forced to sell.
Despite the popular view that household finances are fine, in fact the continued accumulation of larger mortgages compared to income whilst costs are rising and incomes static explains the issues we are now seeing. Housing credit growth is running significantly faster than incomes and inflation, and continued rises in living costs – notably child care, school fees and electricity prices are causing significant pain, this despite some relief at the bowser. Many continue to dip into savings to support their finances. We are seeing a rise in households seeking help with their finances, including access to debt counsellors and other advice channels. WA is seeing very strong growth in cries for help!
Just a day after the ABC reported that the National Debt Helpline said calls had skyrocketed in Western Australia amid epidemic of financial stress.
While Commissioner Hayne made no recommendation in regard to a review of financial counselling, the Government recognises that it is a vital service used by thousands of Australians every year.
For this reason, we are commencing an immediate review that will focus on the coordination and funding of financial counselling services. It will consider gaps and overlaps in current services and the adequacy of appropriate delivery models for future funding.
Indeed, the fact that significant
numbers of households have had their potential borrowing power crimped by
lending standards belatedly being tightened, and are therefore mortgage
prisoners, is significant. More than 40% of those seeking to refinance are now
having difficulty. This is strongly aligned to those who are registering as
stressed. These are households urgently
trying to reduce their monthly outgoings”.
The next question to consider is which households are being impacted. In fact, negative equity is touching “lots of different segments” of the market for different reasons, but collectively it is an “early warning sign” for what is to come. We discussed this is a recent post “The Negative Equity Hot Spots”.
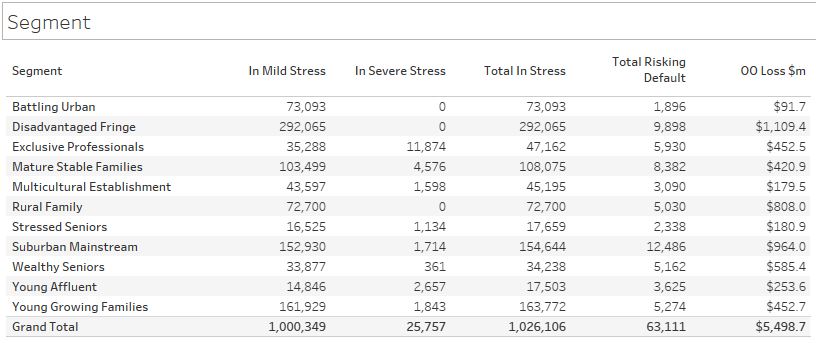
Probability of default extends our
mortgage stress analysis by overlaying economic indicators such as employment,
future wage growth and cpi changes. Our
Core Market Model also examines the potential of portfolio risk of loss in
basis point and value terms. Losses are likely to be higher among more affluent
households, contrary to the popular belief that affluent households are well
protected. This is shown in the segment
analysis below:
Stress by the numbers.
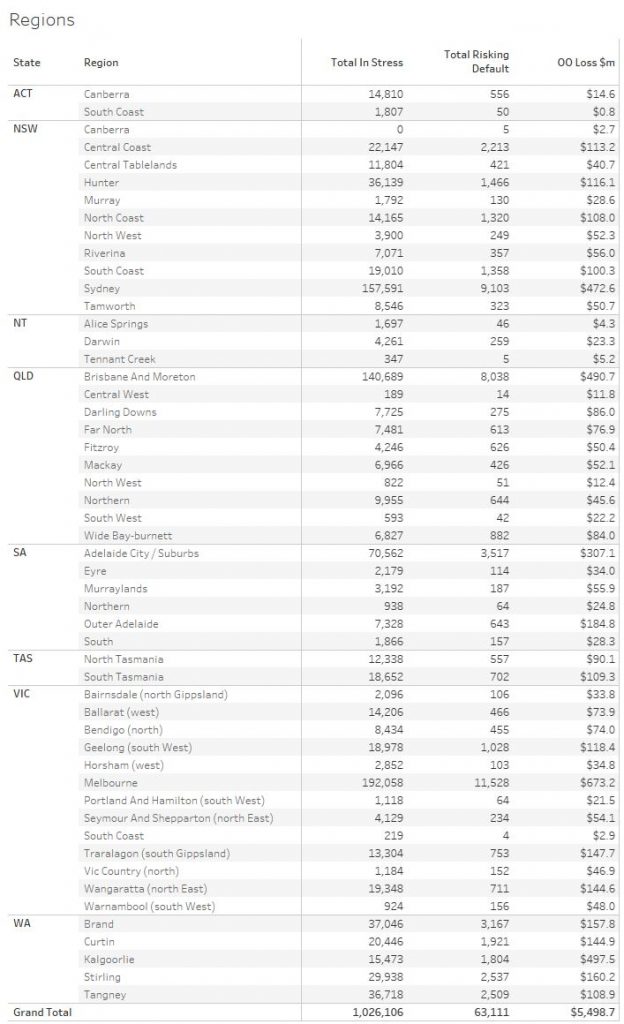
Regional analysis shows that NSW has
282,165 households in stress (278,959 last month), VIC 278,860 (285,723 last
month), QLD 185,493 (180,794 last month) and WA has 139,621 (135,548 last month).
The probability of default over the next 12 months rose, with around 11,650 in
WA, around 11,600 in QLD, 15,600 in VIC and 16,600 in NSW.
The
largest financial losses relating to bank write-offs reside in NSW ($1.1
billion) from Owner Occupied borrowers) and VIC ($1.48 billion) from Owner
Occupied Borrowers, though losses are likely to be highest in WA at 3.6 basis
points, which equates to $1,022 million from Owner Occupied borrowers.
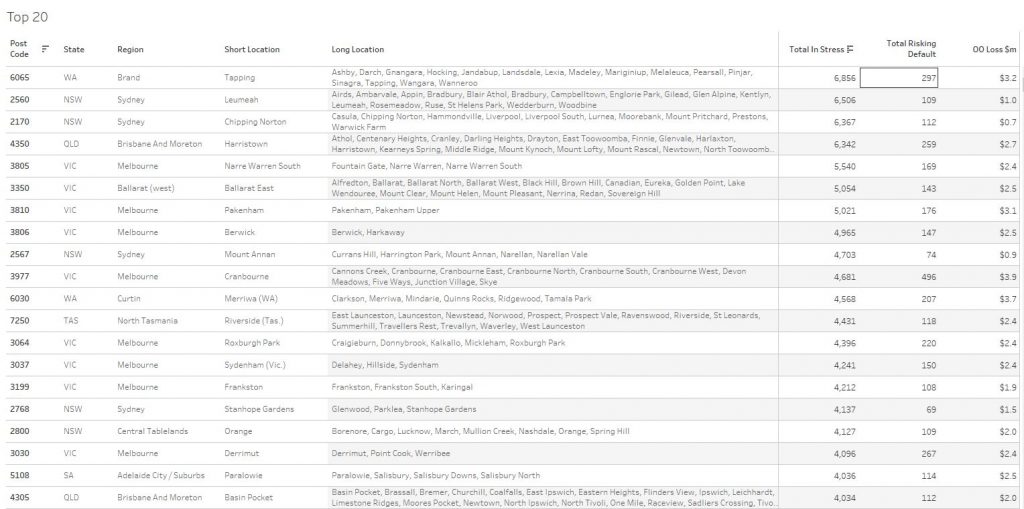
The top 20 post codes are listed below.
[1] RBA E2 Household Finances – Selected Ratios September 2018
You can request our media release. Note this will NOT automatically send you our research updates, for that register here.
[contact-form to=’mnorth@digitalfinanceanalytics.com’ subject=’Request The January 2019 Stress Release’][contact-field label=’Name’ type=’name’ required=’1’/][contact-field label=’Email’ type=’email’ required=’1’/][contact-field label=’Email Me The January 2019 Media Release’ type=’radio’ required=’1′ options=’Yes Please’/][contact-field label=”Comment If You Like” type=”textarea”/][/contact-form]
Note that the detailed results from our surveys and analysis are made available to our paying clients.