The Council Of Financial Regulators Speaks

A welcome move, the shadowy Council Of Financial Regulators has started publishing minutes of its quarterly meetings. However, group think, and self-interest is all over it.  Specifically the comments about tighter credit, and the need to continue to lend (to keep the debt bomb ticking a bit longer! Also how does independence of the RBA work in this context?

They noted that non-ADI lending for housing has been growing significantly faster than ADI housing lending and there is some evidence that non-ADI lending for property development is also increasing quickly.

As part of its commitment to transparency, the Council of Financial Regulators (the Council) has decided to publish a statement following each of its regular quarterly meetings. This is the first such statement.

The statement will outline the main issues discussed at each meeting. From time to time the Council discusses confidential issues that relate to an individual entity or to policies still in formulation. These issues will only be included in the statement where it is appropriate to do so.

The Council of Financial Regulators (the Council) is the coordinating body for Australia’s main financial regulatory agencies. There are four members: the Australian Prudential Regulation Authority (APRA), the Australian Securities and Investments Commission (ASIC), the Australian Treasury and the Reserve Bank of Australia (RBA). The Reserve Bank Governor chairs the Council and the RBA provides secretariat support. It is a non-statutory body, without regulatory or policy decision-making powers. Those powers reside with its members. The Council’s objectives are to contribute to the efficiency and effectiveness of financial regulation, and to promote stability of the Australian financial system. The Council operates as a forum for cooperation and coordination among member agencies. It meets each quarter, or more often if required.

At each meeting, the Council discusses the main sources of systemic risk facing the Australian financial system, as well as regulatory issues and developments relevant to its members. Topics discussed at its meeting on 10 December 2018 included the following:

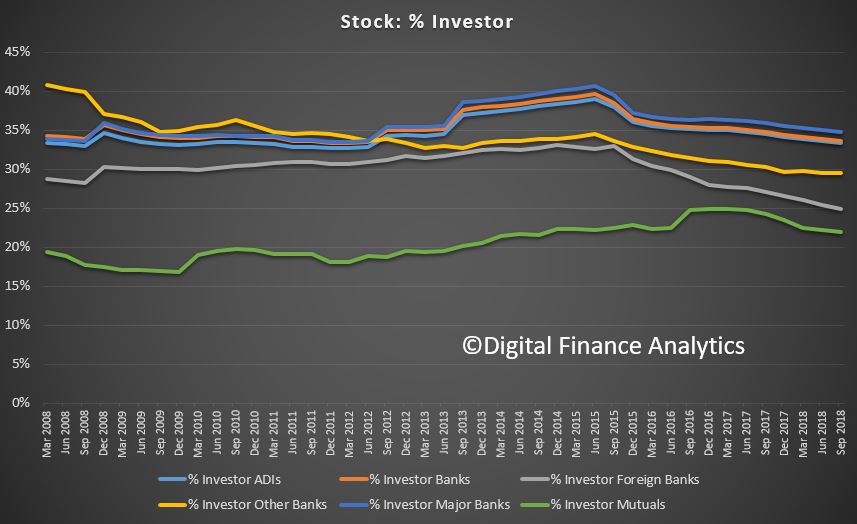
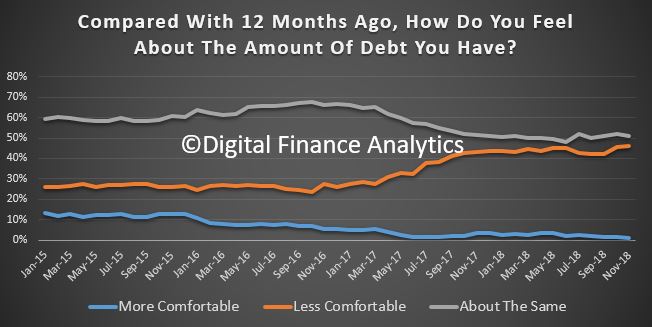
  • Financing conditions. Members discussed the tightening of credit conditions for households and small businesses. A tightening of lending standards over recent years has been appropriate and has strengthened the resilience of the system. At the same time, members agreed on the importance of lenders continuing to supply credit to the economy while they adjust their lending practices, including in response to the Royal Commission into Misconduct in the Banking, Superannuation and Financial Services Industry. Members discussed how an overly cautious approach by some lenders to incorporating relevant laws and standards into loan approval processes may be affecting lending decisions. Members observed that housing credit growth has moderated since mid-2017, with both demand and supply factors playing a role. The demand for credit by investors has slowed noticeably, largely reflecting the change in the dynamics of the housing market. In an environment of tighter lending standards, the decline in average interest rates for owner-occupier and principal and interest loans suggests that there is relatively strong competition for borrowers of low credit risk. Credit to owner-occupiers is continuing to grow at 5 to 6 per cent.
  • Non-ADI lending. The Council undertook its annual review of non-bank financial intermediation. Overall, lending by non-ADIs remains a small share of all lending. However, non-ADI lending for housing has been growing significantly faster than ADI housing lending and there is some evidence that non-ADI lending for property development is also increasing quickly. The Council supported efforts to expand the coverage of data on non-ADI lenders, drawing on new data collection powers recently granted to APRA.
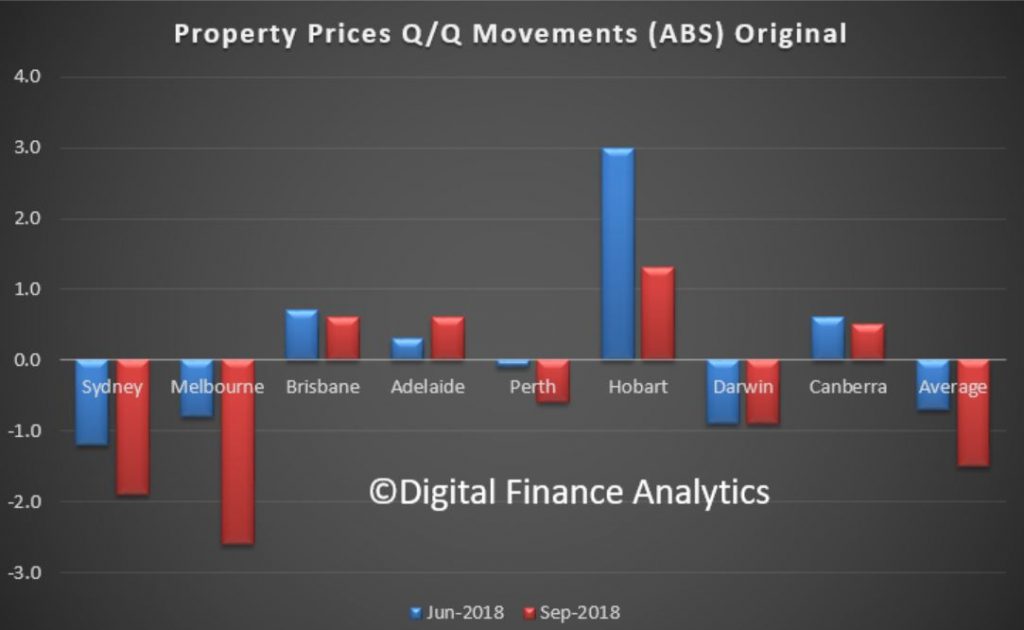
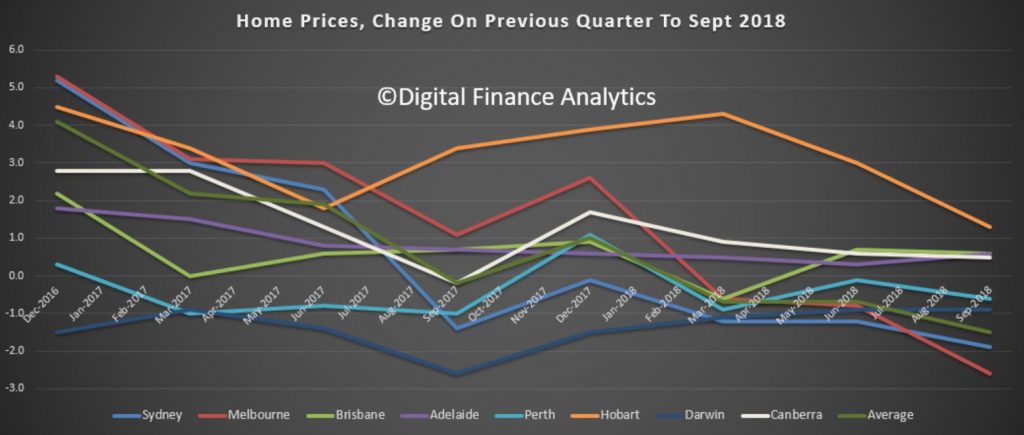
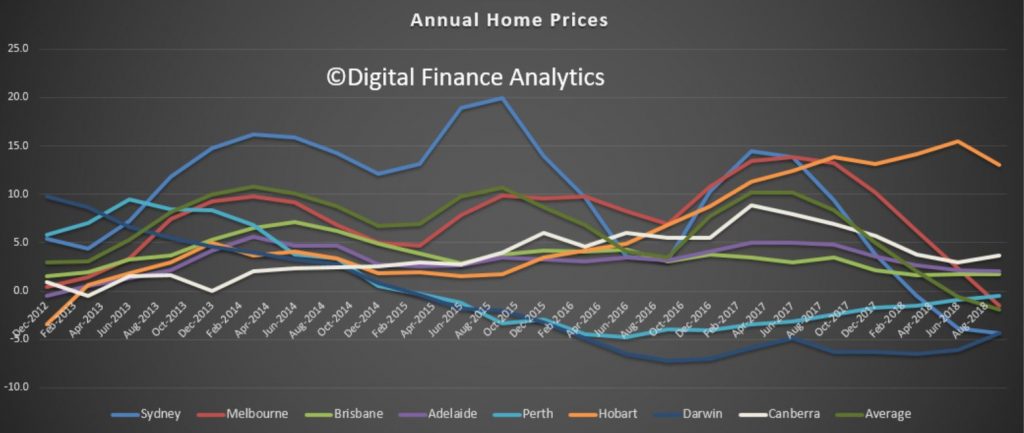
  • Housing market. Members discussed recent developments in the housing market. Conditions have eased, but this follows a period of considerable strength in the market. Housing prices have been declining in Sydney, Melbourne and Perth, but are stable or rising in most other locations. The easing in the housing market is occurring in a period of favourable economic conditions, with low domestic unemployment and interest rates and a supportive global economy. The Council will continue to closely monitor developments.
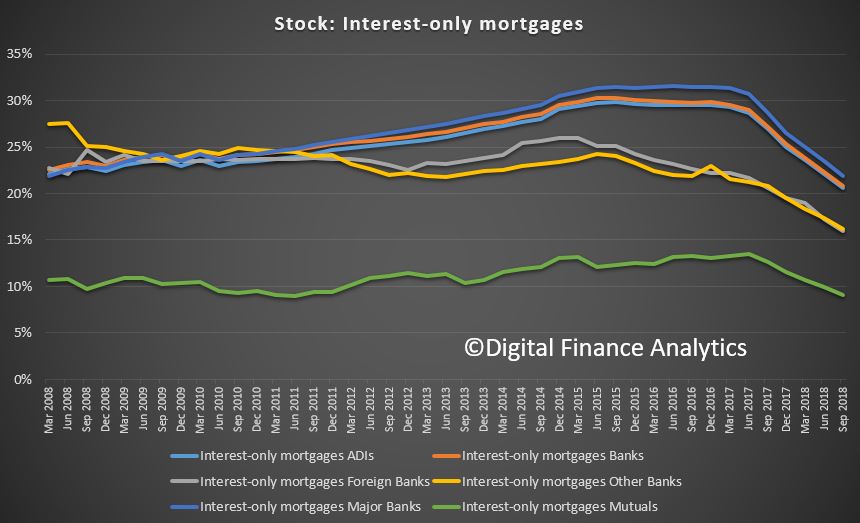
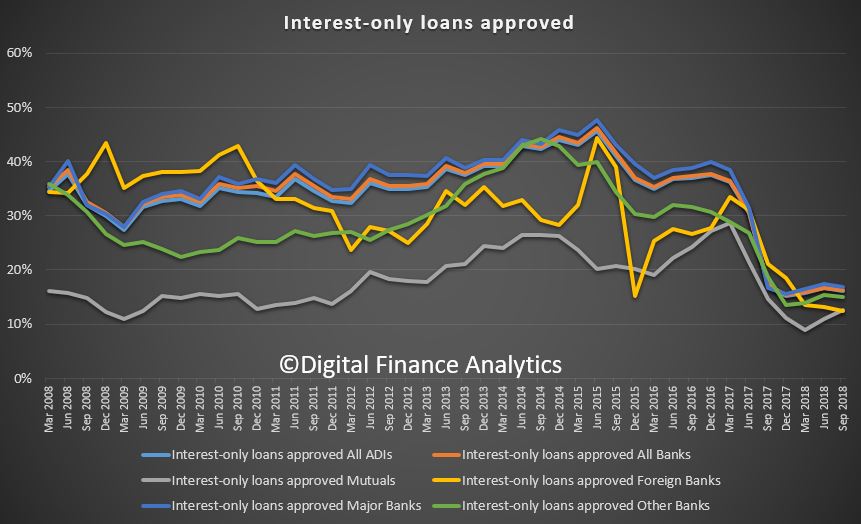
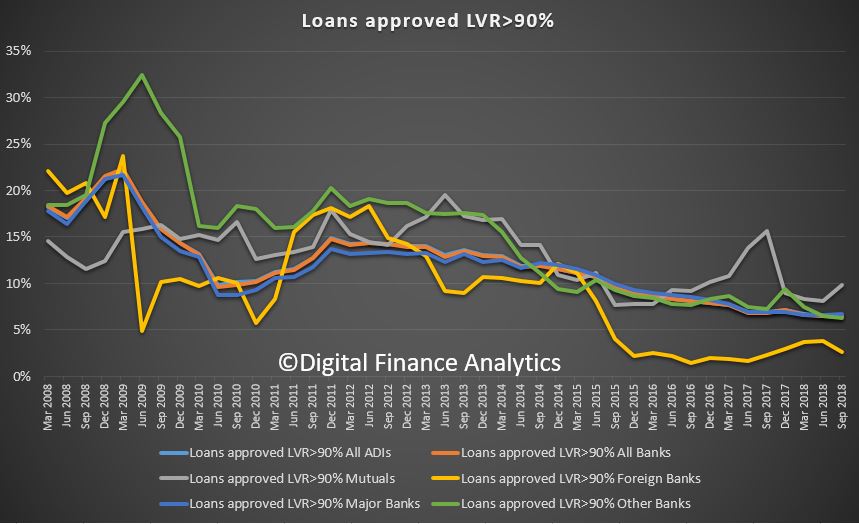
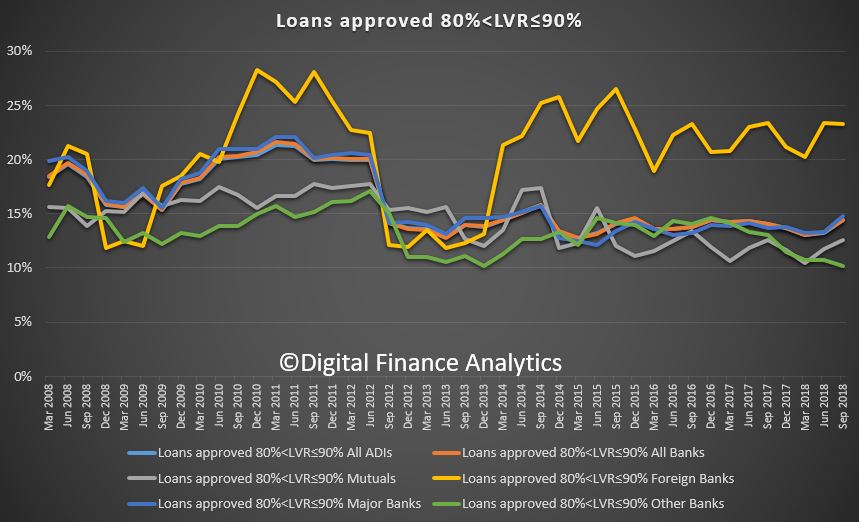
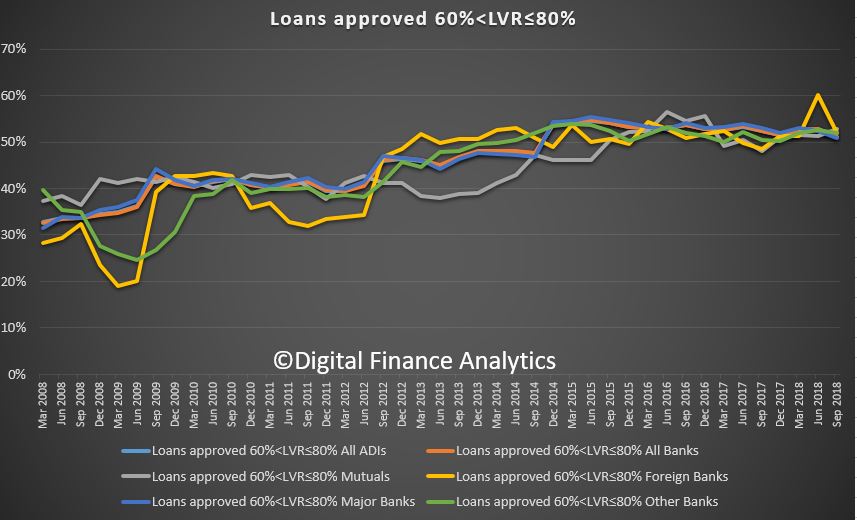
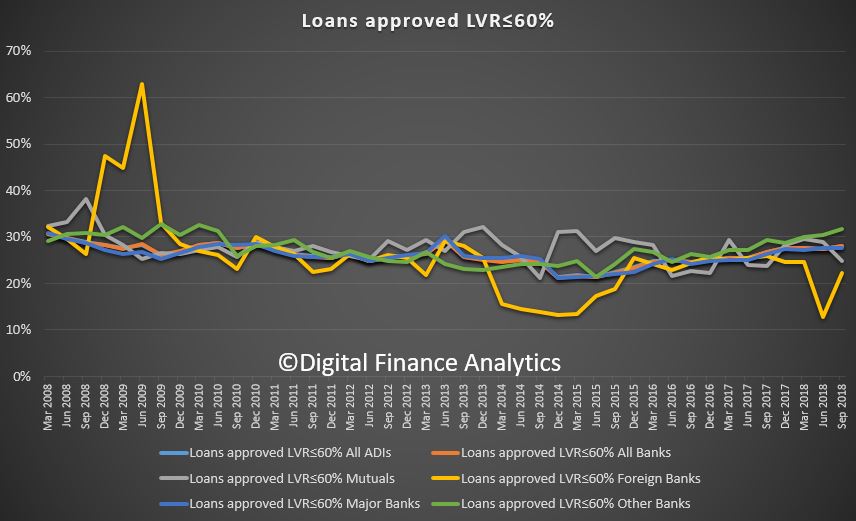
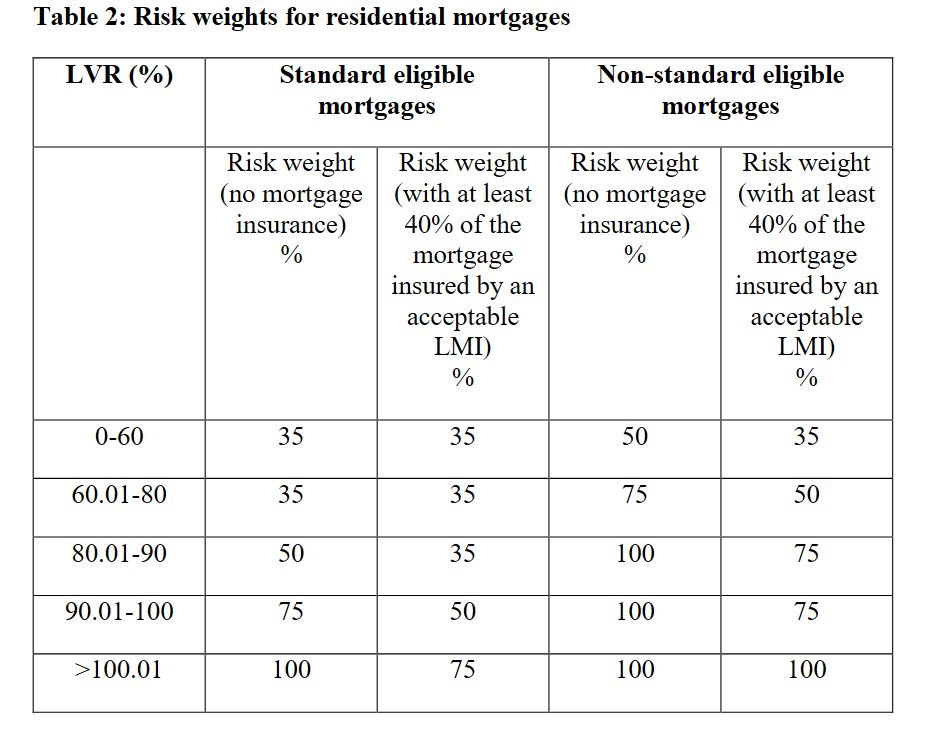
  • Prudential measures. APRA briefed the Council on its latest review of the countercyclical capital buffer, the results of which will be published in the new year. It also provided an update on its residential mortgage measures, including the investor lending and interest-only lending benchmarks. In line with APRA’s announcement in April 2018 that it would remove the investor lending benchmark subject to assurances of the strength of lending standards, the benchmark has now been removed for the majority of ADIs. The interest-only lending benchmark, introduced in 2017, has resulted in a reduction in the share of new interest-only lending, along with the share of interest-only lending that occurs at high loan-to-valuation ratios.
  • Financial sector competition. The Council discussed work by its member agencies in response to the Productivity Commission’s Final Report of its Inquiry into Competition in the Australian Financial System. The Council strongly supports improved transparency of mortgage interest rates and a working group is examining a number of options. The Council also discussed the Productivity Commission’s recommendations relating to lenders mortgage insurance and remuneration of mortgage brokers. Both the Productivity Commission and the Financial System Inquiry recommended a review of the regulation of payments providers that hold stored value – referred to in legislation as purchased payment facilities (PPFs). The Council released an issues paper in September and held an industry roundtable in November. Members considered the feedback received from these processes and received an update on progress with the review.
  • Limited recourse borrowing by superannuation funds. Members discussed a report to Government on leverage and risk in the superannuation system, as requested in the Government’s response to the Financial System Inquiry. The use of limited recourse borrowing arrangements remains relatively small, but has risen over time. Leverage by superannuation funds can increase vulnerabilities in the financial system, though near-term risks have reduced with the shift in dynamics in the housing market.
  • International Monetary Fund’s Financial Sector Assessment Program (FSAP). The FSAP review of Australia was conducted during the course of 2018; preliminary findings were presented to the Australian authorities in November. The Council held an initial discussion of the main FSAP recommendations and how they could be addressed. The FSAP will be finalised in early 2019, at which time summary documents will be published. (Further information on the FSAP review was published in the Reserve Bank’s October 2018 Financial Stability Review.)

Representatives of the Australian Competition and Consumer Commission and the Australian Taxation Office attended the meeting for discussions relevant to their responsibilities.

Does A Flatter Yield Curve Signal An Imminent U.S. Recession?

The risk of an imminent U.S. recession remains low despite the recent flattening of the U.S. yield curve, Fitch Ratings says.

“The underlying recession signals traditionally embodied by a yield curve inversion, namely high policy interest rates relative to long-term expectations of policy rates, and falling bank profitability and credit availability, are absent. Yield-curve flattening does nevertheless emphasize that the U.S. economic cycle is in a late stage of expansion.

The yield curve has been a good lead indicator of U.S. recessions. Each of the past nine recessions were preceded by a yield curve inversion when 10-year yields fell below one-year yields. The recent narrowing of the 10-year minus one-year spread to its lowest level since summer 2007 has prompted a debate about potential economic implications.

The yield curve has not yet inverted except at some shorter tenors. Our Global Economic Outlook  forecasts suggest that to be unlikely. We forecast the U.S. 10-year yield to end this year at 3.1% from 2.85% today and predict a year-end Fed Funds rate of 2.5%. We also see both the Fed Funds rate and 10-year yields rising broadly in tandem through 2019. Even if the yield curve inverts, there are reasons to discount this as a ‘red flag.’

The historical time lags between inversion and recessions have been highly variable, from six months to up to two years. The correlation between the yield curve and GDP growth has been far from perfect. While each recession has been preceded by an inversion, not every inversion has been followed by a recession. The relationship through the mid-1990s was very poor. Since early 2010 there has been a steady flattening while U.S. growth has remained broadly stable.

The flattening since 2010 was associated with massive central bank bond buying under Quantitative Easing (QE) programs reducing long-term yields. While the Fed has started to gradually unwind its Treasury holdings, they remain huge and continue to suppress long-term yields. Ongoing QE purchases by the European Central Bank and Bank of Japan have also likely reduced U.S. bond yields, albeit indirectly.

These distortions to bond pricing reduce the value of the curve as an independent, market-based signal of the monetary policy stance. We do not believe that U.S. monetary policy is tight in an absolute sense, which would be the typical interpretation from a flat or inverted curve, reflecting current policy interest rates that are below levels expected in the long run. The Fed Funds rate is still quite close to zero in real terms despite inflation being close to target and unemployment below sustainable levels.

Bank profits are also traditionally thought to help explain the predictive power of the yield curve. Curve-flattening is generally perceived as compressing net-interest margins (NIM) and reducing banks’ willingness to lend. However, U.S. banks NIMs have risen steadily over the past three years, partly helped by changing balance sheet structures, and little evidence shows any deceleration in private credit or decline in banks’ willingness to lend. An inversion would limit the capacity for banks to further increase net-interest income but there is little evidence of this having happened so far.

Solid consumer income, private investment momentum and an aggressively expansionary fiscal stance should all support strong U.S. GDP growth in the next 12 months. Nevertheless, the flattening yield curve is consistent with the U.S. economy being at a late stage in the cycle, with an unusually long expansion to date and growth currently well above Fitch’s estimate of U.S. supply-side growth potential of 1.9% Fitch expects U.S. growth to tail off quite sharply in 2020 to 2.0% (from 2.9% in 2018) as macro policy support is removed and supply side constraints start to bind”.

Flipping And Flopping In New Zealand (Part 2)

Joe Wilkes continues his look at property development around Palmerston North looking at social housing and retirement villages.

Is there really an under supply of property?

Part 1 is available here.

Please share this post to help to spread the word about the state of things….

Caveat Emptor! Note: this is NOT financial or property advice!!

More Loans Written Outside Serviceability

APRA released their quarterly property exposure statistics yesterday, to September 2018, alongside the quarterly performance statistics which we will discuss in a separate post. Worth pausing to say this is aggregated data, so we cannot get a feel for individual banks, though a cross sector view does provide some context. Worth also saying they warn us not to use this data to assess the state of the market (which begs the question, then why publish this data?). More opaque behaviour from the Regulator.

We will start with the loan stock data. Total loans are around $1.6 trillion. As we know the growth in investor loans has slowed, and the trend lines also reflect some reclassification of loans which went on in recent times. But overall, mortgage stock continues to grow, even if the rate of growth – the credit impulse is slowing.

As a result the share of loans for property investment, relative to all loans is falling now. However the major banks still retain their top spot with around 35% of their portfolios in investor lending. We see a more significant fall in Foreign Banks and Mutuals, relative to the Major banks. Regional banks are in the middle ground.

Looking at interest only loan stock, we see a consistent fall, with the Major Banks still close to 20%, down from around 30% in 2015, and Mutuals holding less than 10% of interest only loans by stock.

But perhaps the more interesting analysis is to be found in the flow of new loans data. For example, the flow of new interest only loans. We see the proportion of new loans around 10%, though a small rise from the Mutual sector. Major Banks are writing the largest proportion, but way down from more than 40% in 2015, to around 16% now. So you can say that APRA has succeeded in taming the IO beast, even if it was 5 years too late!

Next we turn to investment loans which are down a bit from the pre-APRA intervention post June 2015, but the major banks are still writing around 30% of loans as investment loans – so let s be clear – people are still borrowing! Also we see a rise in investment loans from “other banks”.

The killer slide is the loans written outside serviceability guidelines. Around 6% of loans written by the major banks are via overrides, where the bank reviews standard criteria and “breaks their own rules”. Back in 2017, it went as low as 1%. Now of course we know that lending criteria have been tightened, but I find this high rate of overrides concerning.  This means we are still seeing risk building in the system (despite the falls in home prices).

We also see that Mortgage Brokers are still originating a considerable proportion of the book. Overall about half of all loans (by value) are from third party channels, though with Foreign Banks at the top of the pack with more than 70% via Brokers, and Mutuals below 40%. 

Finally, we can look at the LVR (loan to value) mix, highly relevant given falling prices, as we discussed in a recent post.  The share of 90% plus LVR loans is sitting below 10%, though we note a peak from the Mutual sector as they chase business.

Loans approved between 80 and 90 per cent LVR are on the rise, with Foreign Banks leading the way, and Major Banks and Mutuals also participating. This partly reflects falling property values, meaning the initial LVR tends to be higher. Not a good sign, given the prospect of further falls ahead. Many of these borrowers will have Lenders Mortgage Insurance, which protects the Bank in the case of a default (not the borrower).

The 60 to 80 percent bands remain pretty static.

And there is a small rise in the sub 60% LVR loans. This will reflect some loans being refinanced.

So to conclude, while APRA’s measures are having an effect, there are still signs of risky behaviour from lenders who are desperate to write business, because mortgage lending is a critical profit driver for them. However, the tighter underwriting standards are still allowing more loans to be written at higher loan to value ratios and outside standard serviceability. These warning flags should be heeded.

And worth observing there is nothing reported at all on loan to income ratios, probably the most critical dimensions to monitor in a higher risk environment. This is a shameful gap in the data, and should be addressed.

Major mortgage class action dropped

A class action lawsuit that was being planned on behalf of “Australian bank customers that have entered into mortgage finance agreements with banks since 2012” has been dropped due to a lack of a “clear cause of action”; via The Adviser.

Law firm Chamberlains has announced that its major class action against various Australian banks will no longer proceed despite interest in the matter.

In May of this year, it was announced that law firm Chamberlains had been appointed to act in the planned class action lawsuit, which was instructed by Roger Donald Brown of MortgageDeception.com to represent various Australian bank customers that had been “incurring financial losses as a result of entering into mortgage loan contracts with banks since 2012”.

The law firm had been calling on bank customers to join the class action, led by Stipe Vuleta, if they had “incurred financial losses due to irresponsible lending practices”.

In an update to interested parties, seen by The Adviser, Chamberlains commented: “Over the last few months, we have been busy investigating the scope of a potential legal claim, which could be commenced as a class action against various Australian banks.

“During this process, we have engaged with senior and junior counsel to assist with the questions of law to be raised if an action were to be commenced in the Federal Court of Australia.

“Despite our efforts, we have been unable to identify a clear class of claimants who have a clear cause of action against a particular Australian bank.”

It continued: “As a result, we are unable to take this process further.”

While the law firm has said that some may still have “an individual case arising from [their] dealings with the banks, which may have merit outside of the framework of a class action”, it would encourage those people to “seek independent legal advice about [their] claim”.

Class actions in focus

Several class actions against major lenders have already been initiated following some of the revelations from the royal commission, including four separate class actions against AMP on the grounds that the company breached its obligations to customers and engaged in “misleading and deceptive representations to the market”.

The legal action was announced after senior AMP executives appeared before the royal commission as witnesses. Some of the executives admitted to a number of potential crimes and suggested that these were repeatedly mischaracterised to the Australian Securities and Investments Commission (ASIC) and to its customers as being “administrative errors”.

These included providing false and misleading statements to the regulator and charging customers for services that were not provided.

The ASX-listed lender, which announced the immediate resignation of its CEO and apologised “unreservedly for the misconduct and failures in regulatory disclosures” earlier this year, has lost more than $1 billion in shareholder value since March and could potentially face criminal charges.

Westpac shareholders reject executive pay

Westpac incurred a first strike against its remuneration report at its annual general meeting this week, where chairman Lindsay Maxsted said the ruling would send a strong message to the board; via InvestorDaily.

CEO Brian Hartzer along with Mr Maxsted also addressed the royal commission, the bank’s financial performance for the past year and the executives’ remuneration in the company’s AGM.

Peter Hawkins, non-executive director, retired following the AGM, after 10 years of being on the board. Westpac will be electing two new non-executive directors in the first half of calendar 2019.

While the poll on the remuneration report among shareholders had not been completed at the time of the chairman’s address, more than half of the votes already received were against the resolved salaries.

“Feedback from shareholders has varied, but the key point from those voting against the remuneration report has been that although the board took events over the year into account, many have questioned whether we went far enough, particularly in reducing short-term variable reward paid to the CEO and other executives,” Mr Maxsted said.

The short-term variable reward for the Westpac CEO and group executives in Australia were on average, 25 per cent lower than last year.

No long-term variable reward was vested in 2018. Around one-third of the board’s potential remuneration forfeited, which Mr Maxsted said was equivalent to about $18 million.

The CEO saw his short-term variable reward outcome cut by 30 per cent, or $900,000 over the past year.

The largest individual year on year reduction was 50 per cent, although Westpac did not disclose who it was, or for what reason.

“This is entirely consistent with the relatively weak performance of shares in the banking sector, including Westpac, over the last few years, including the 2018 financial year,” Mr Maxsted said.

“Putting this another way, for the CEO, his total variable reward outcome was 36 per cent of his total target variable reward.”

The chairman said the key failings from Westpac in light of the royal commission were not fully appreciating the underlying risks in the financial planning business, employee remuneration contributing to poor behaviour and inadequacy in dealing with complaints.

“Better training and supervision, changes to the way financial planners were remunerated, and better documentation of advice was required,” Mr Maxsted said.

“As we have seen across the industry, where we get it wrong, the remediation is costly,” Mr Hartzer said.

“What has been clear is that we have not always embedded strong enough controls and record-keeping around ensuring that customers received the advice they had signed up for.”

Mr Maxsted also cited Westpac’s slowness in focusing on non-financial risks.

“In 2018, our financial performance was mixed; we have further built on the balance sheet and financial strengths that are a hallmark for Westpac but our annual profit was relatively flat over the year,” Mr Maxsted said.

Cash earnings for the year ended 30 September was $8 billion, $3 million up on the year before. Reported profit reached $8.1 million, increasing by 1 per cent from the prior corresponding period.

Business Bank grew profits by 8 per cent and New Zealand was up 5 per cent. Excluding the cost of remediation provisions, BT’s profit was down 1 per cent.

Institutional Banking saw its profit go down by 6 per cent, which Mr Hartzer said largely represents a slowdown in financial markets activity.

The bank also saw a slowdown in housing lending, with credit growing 5.2 per cent in the past 12 months, when it was 6.6 per cent in 2017.

“The group began the year solidly with good growth and well-managed margins in the first half. Conditions in the second-half, however, were more difficult with higher funding costs, lower mortgage spreads, and a reduced markets and treasury contribution,” Mr Maxsted said.

“In addition, we needed to lift provisions associated with customer refunds and regulatory/litigation costs as we address some of the legacy issues alluded to earlier.”

The board determined a final dividend of 94 cents per share, unchanged over the prior half and consistent with the final dividend for 2017. The full year dividend comes to 188 cents per share, unchanged from the year before.

Mr Maxsted also noted Westpac removing grandfathered commission payments in the past year, saying it was the first in the market to do so.

“With revenue growth continuing to be a challenge, we have re-doubled our efforts to reduce costs by simplifying our products, automating process and modernising our technology platform,” Mr Hartzer said.

“Over recent years, we have delivered productivity savings of around $250-300 million per year. In 2019, we aim to lift that to more than $400 million – almost one third higher than 2018.”

Mr Maxsted also mentioned the bank’s development of its new Customer Service Hub, the group’s multibrand operating system. The system is now in pilot and will go live with new Westpac mortgages in 2019.

In terms of outlook, Mr Hartzer said that while it seemed positive as a whole for the Australian economy, for banks, it looked more challenging.

“Although credit quality is likely to remain a positive, low interest rates, slowing credit growth, and a fall in consumer and business confidence – especially about house prices – puts pressure on bank earnings growth,” he said.

Flipping And Flopping In New Zealand (Part 1)

Joe Wilkes has been on the road again and we visit Palmerston North to inspect the construction of residential property there.

There are some important observations to make about the state of play.

This is part 1 of a series.

Please consider supporting our work via Patreon

Or make a one off contribution to help cover our costs via PayPal

Please share this post to help to spread the word about the state of things….

Caveat Emptor! Note: this is NOT financial or property advice!!

APRA announces super reforms

In an effort to “maintain industry momentum”, the APRA, prudential regulator has finalised new superannuation requirements before they have been legislated; via InvestorDaily.

The Australian Prudential Regulation Authority (APRA) has today released a package of new and enhanced prudential requirements designed to strengthen the focus of registrable superannuation entity (RSE) licensees on the delivery of quality outcomes for their members.

A central component of APRA’s new framework is the introduction of an outcomes assessment that will require RSE licensees to annually benchmark and evaluate their performance in delivering sound, value-for-money outcomes to all members – covering both MySuper and choice products.

APRA deputy chairman Helen Rowell said APRA was committed to lifting standards across the industry for the long-term benefit of superannuation members.

“As the prudential regulator, APRA’s primary focus is on the sound and prudent management of the $1.8 trillion APRA-regulated segment of the superannuation industry; that includes seeking to ensure that RSE licensees meet their obligations to put their members’ interests first,” Mrs Rowell said.

“These changes to the prudential framework set a higher bar for RSE licensees by requiring a robust assessment of the outcomes delivered for members to be reflected in their strategic and business planning.”

In addition to the outcomes assessment, APRA’s final package requires RSE licensees to meet strengthened requirements for strategic and business planning, including management and oversight of fund expenditure and reserves. These requirements are set out in new Prudential Standard SPS 515 Strategic Planning and Member Outcomes.

The Treasury Laws Amendment (Improving Accountability and Member Outcomes in Superannuation Measures No.1) Bill 2017 (the Bill) that is before Parliament would, if passed, introduce a legislated outcomes assessment.

APRA said its proposals are consistent with the outcomes assessment proposals in the Bill, and are being introduced now to “maintain industry momentum” towards delivering improved outcomes for members. APRA will review whether amendments are needed to the prudential framework requirements if the Bill is passed by Parliament in future.

Mrs Rowell also emphasised APRA’s strong support for the other reforms contained in the Bill and, in particular, the enhanced directions powers for APRA, the strengthened MySuper authorisation and cancellation provisions, and the requirement for APRA to approve changes of ownership of RSE licensees.

“These new policy proposals address weaknesses in the current superannuation regulatory framework and would greatly assist APRA in driving the superannuation industry towards addressing underperformance and improving member outcomes,” she said.

APRA’s finalised package of measures is the culmination of extensive industry engagement that commenced in August 2017, and includes amendments to the original proposals taking into account the feedback received during consultation.

The commencement date for the new measures has been set as 1 January 2020, to provide industry with sufficient time to meet the new requirements.

Home Price Falls Are Accelerating (Will Bank Capital Be Hit?)

The ABS released their Residential Property Price Index series yesterday. 

They said that the price index for residential properties for the weighted average of the eight capital cities fell 1.5% in the September quarter 2018. The index fell 1.9% through the year to the September quarter 2018.

The capital city residential property price indexes fell in Melbourne (-2.6%), Sydney (-1.9%), Perth (-0.6%) and Darwin (-0.9%), and rose in Brisbane (+0.6%), Adelaide (+0.6%), Hobart (+1.3%) and Canberra (+0.5%).

Annually, residential property prices fell in Sydney (-4.4%), Darwin (-4.4%), Melbourne (-1.5%), Perth (-0.5%) and rose in Hobart (+13.0%), Canberra (+3.7%), Adelaide (+2.0%) and Brisbane (+1.7%).

The total value of residential dwellings in Australia was $6,847,057.2m at the end of the September quarter 2018, falling $70,148.6m over the quarter.

The mean price of residential dwellings fell $9,700 to $675,000 and the number of residential dwellings rose by 40,900 to 10,143,700 in the September quarter 2018.

Of course these averages do not tell the true picture, because the movements are not uniform across a state. In some post codes now we are seeing falls of more than 20% from the previous peak, elsewhere prices are holding more steadily. However, given credit availability drives home prices, and credit is harder to come by, we should expect more falls ahead. Then the question becomes, is a soft landing feasible? I have to say that all the cycles I have examined never ended softly, so it would be a first, if it did happen.

But there is another point to consider. Major banks use internal risk models to calculate the amount of capital they hold against mortgage loans. Other banks use more standard approaches.

The calculation is driven by a range of factors, but LVR is one element. Here is the APRA risk weights table.  The point is a loan with an LVR at 80% has a risk weight of 50%, but the same loan at 90% LVR requires 75%, and 100% LVR 100% weighting.  In other words, the capital doubles between 80 and 100% LVR!

At some point quite soon now banks will need to re-baseline their mortgage books.  When property prices were rising, they would do this quite regularly to reduce the capital requirement. The reverse is also true.

The governing APRA document says “The ADI must also revalue any property offered as security for such loans when it becomes aware of a material change in the market value of property in an area or region”. Have banks started to revalue their portfolios and up their risk weights in the light of these falls? This is also, by the way, why economists attached to the major banks have an interest in playing down potential home price falls.

APRA says “the valuation may be based on the valuation at origination or, where relevant, on a subsequent formal revaluation by an independent accredited valuer. The determination of the appropriate risk weight is also dependent upon mortgage insurance provided by an acceptable lenders mortgage insurer (LMI)”. Of course many lenders now have access to Automated Valuation Models from players such as CoreLogic. 

So now the question becomes, how much more capital will the banks have to put aside to take account of falling prices, who will bear the cost, and will APRA back down on its capital requirements which insist the banks hold more capital ahead? I expect more weakness in bank share prices as the impact of this hits home. As home prices fall further the impact will be magnified.


Household Financial Confidence Weakens Again In November

DFA has released the final dimension from our household surveys to end November 2018, zeroing in on financial confidence. As is perhaps predicable, the overall index fell again, down to 87.8, well below the neutral setting, and close to the record low we measured in 2015.

Property owning household segments continue to react to the changed environment, as prices weaken, and mortgage availability tightens.   Around half of all mortgage applications are being rejected due to the tighter conditions. Property investors are now very concerned about their financial status, and owner occupied households confidence continues to drift lower. That said, those not owning property – who are renting or living with family or fields are still even less confident so it is still true that property ownership bolsters financial confidence.

One way to understand the confidence dynamic is to look at households in terms of their mortgage commitments. Property owing households without a mortgage – about one third of all households – remain more positive than those with a mortgage and those renting. These more confident households are more affluent, often with market investments, and multiple income sources. Nevertheless, even these households are becoming more disenchanted with the state of things. 

Across the states (we select the most populated in this analysis),  we see a bunching of confidence scores with Victoria slipping towards Western Australia and Queensland, although New South Wales continues to slide a little too. South Australian households are sitting between New South Wales and Victorian households in terms of average confidence.

The age bands continue to show significant separation, with younger households more concerned (thanks to costs of living and large mortgages) relative to older households, many of who have smaller mortgages or no mortgages and larger asset bases. That said, those moving into retirement are less confident compared with those who are still working.

We can then dive into the elements which drive the survey. Looking at job security first, there was a 2% rise in those feeling less secure about their employment prospects, to 29%, and an offsetting fall of 2% in those who are felling about the same as a year ago at 55%.  We continue to see many households employed in multiple part-time jobs to maintain income, and many are still seeing more employable hours, suggesting that underemployment remains a considerable issue.  We also noted that significant numbers of workers were being “encouraged” to extend their leave over the upcoming holiday period.

Turning to income, 2.87% reported a rise in real incomes in the past year (allowing for inflation) a fall of 0.81% on last month. There was a small rise in those saying their incomes had not changed in real terms at 42% but 53% said their incomes have fallen in the past year.

Living costs are still rising for many. Once again electricity costs, health care costs, child care costs and food costs all registered. 85% of households say their costs have rise, 9% said there has been no change and and 5% said their costs have fallen.    There was small relief from lower petrol prices.

Given the high debt levels which exist in Australia (thanks to poor policy settings and lax lending standards), many households are concerned about their current debt levels. Just 1% were more comfortable than a year ago, and this was often associated with those who sold property and paid down their mortgages. 51% were as comfortable as a year ago, and 46% were more concerned, up 0.76% in the month.  We continue to see debt levels rising among those with mortgages as they try to balance their finances, and turn to short term solutions, such as credit cards, personal loans, or installment payment options.  Whilst overall levels of personal debt other than mortgages are falling, there is a concentration among those with property loans.

Savings are taking a beating at the moment, firstly because many are raiding savings to maintain lifestyle (which explains the falling savings ratio) and they are also receiving significantly less on deposits at the bank as financial institutions seek to recover margin in the higher cost environment. The fact is, it is the soft underbelly of savers who are taking the brunt of the pain, yet many are very reliant on bank deposits for income, and the media hardly ever focuses on this significant group.  All the attention is on the mortgage rate. Banks are in my view taking advantage of this, and it is the easy way out to protect their margins. 46% of households are less comfortable than a year ago, up 3%, and just 3% are more comfortable, down 0.8% on last month.

So putting all this together, net worth is under pressure for many households.  34% of households said their net worth had improved in the past 12 months down 4% on last month, while 33% said their net worth had fallen, up 3% on the previous month. Falls in home prices, share prices and other investments all hit home.  This underscore the fading “wealth effect” we are seeing as more react to this new environment.

We also observed one other significant fact. Despite the tighter conditions, and falling confidence, most households say they will still spend over the Christmas season, and will simply pick up the bill in the new year. This may be good news for retailers, but bad news for households down the track.

Slow wages growth, falling home prices and rising costs are combining to drag wealth and household confidence lower, and there is no end in sight. Another reason why we think the RBA will not be lifting the cash rate any time soon.

By way of background, these results are derived from our household surveys, averaged across Australia. We have 52,000 households in our sample at any one time. We include detailed questions covering various aspects of a household’s financial footprint. The index measures how households are feeling about their financial health. To calculate the index we ask questions which cover a number of different dimensions. We start by asking households how confident they are feeling about their job security, whether their real income has risen or fallen in the past year, their view on their costs of living over the same period, whether they have increased their loans and other outstanding debts including credit cards and whether they are saving more than last year. Finally we ask about their overall change in net worth over the past 12 months – by net worth we mean net assets less outstanding debts.

We will update the index next month.