The sharp rise and subsequent fall in Bitcoin’s value places it among the greatest market bubbles in history. It has outpaced the 17th-century tulip mania, the South Sea bubble of 1720, and the more recent Japanese asset price and dot-com bubbles.
The rapid price rise garnered attention from an increasing number of academics and investment advisers. Some have suggested that Bitcoin improves portfolio performance and can even be used as a potential “safe haven” asset in place of gold.
Our work finds that much of this research is flawed and overlooks some important attributes that any investor should consider before allocating funds to such a speculative investment.
This is particularly relevant if investing in Bitcoin is rationalised as a prospective safe haven in times of market turmoil.
Hard to value
The first attribute investors consider is how to value Bitcoin. Typically, assets are valued based on the cash flows they produce. Bitcoin lacks this property.
This leads to ongoing debate as to the true value of Bitcoin and other cryptocurrencies. Some, such as the Winklevoss twins and other Bitcoin entrepreneurs, believe the price will soar far higher. Others, including Nobel prize winner Eugene Fama and esteemed investor Warren Buffett, believe the real value is closer to zero. Another Nobel winner, Robert Shiller, suggests the correct answer is “ambiguous”.
There is even wide variation in price across the various Bitcoin exchanges. This is common in fragmented markets and makes it difficult for an investor to find the best market price at any point in time – a process called price discovery.
High price volatility
Bitcoin prices also have a high level of variation (volatility) when compared to other possible investments including bonds, stocks and gold. Even tech stocks such as Twitter, which are considered relatively volatile, are found to have less price variation. This adds to the difficulty investors face when trying to value Bitcoin and any portfolios that contain it.
This is of particular concern given the large daily losses that Bitcoin has experienced in its relatively short life. The largest one-day decline experienced by the popular S&P500 index since 2011 is 4.2%. Bitcoin has had nearly 200 days that were worse (and over 60 days worse than the biggest decline in the gold price of 10.2%).
Put another way, Bitcoin has had 200 days worse than the worst day on the stock market. This hardly seems like an enticing investment for most.
Low liquidity
Investors should also consider the ease with which they are able to buy and sell any assets in which they invest. One method used to measure this liquidity attribute is the bid-ask spread – the difference in the price at which one is able to buy and sell the asset.
More liquid assets have a narrow bid-ask spread. Bitcoin’s bid-ask spread varies from one exchange to another, but in general it is much larger than for other assets.
While bid-ask spreads provide one measure of implicit trading costs, investors also consider the explicit transaction fees they are charged when trading. Transaction fees for trading traditional investments are typically well known and have trended down over time.
While Bitcoin fees have recently declined, they have proven to be highly variable, ranging from over $30 to under $1. The time taken to process a transaction can also be greater than 78 minutes. This is much longer than for stocks or bonds and creates another layer of uncertainty for investors.
Only for the most risk-loving
Bitcoin is harder to value, more volatile, less liquid, and costlier to transact than other assets in normal market conditions. Potential investors should be wary and carefully consider whether such highly speculative assets are appropriate additions to any portfolio.
Given safe havens are typically in demand during financial crisis, when markets are more volatile and less liquid, it is highly unlikely that Bitcoin is even worth considering as a safe-haven asset.
Author: Lee Smales Associate Professor, Finance, University of Western Australia
AMP is the latest to change its variable lending rates for all owner occupiers and investors.
The changes include an increase of:
8 basis points for owner occupied principal and interest
17 basis points for owner occupied interest only
17 basis points for investment principal and interest
17 basis points for investment interest only
The changes are effective 13 July 2018 for new business and 16 July 2018 for existing business.
AMP Bank said in its statement that it hasn’t raised rates for existing customers for over 12 months.
AMP Bank group executive Sally Bruce confirmed these changes are driven by an increase in funding costs.
She said, “We are managing our portfolio in a very active market and our decisions on rates are never taken lightly.
“We have held off passing this cost on to customers for as long as we can and in fact have not increased interest rates for existing customers since June last year.
“With any change, we are focussed on balancing the interests of our customers, the regulator and our business.”
AMP Bank continues to offer a competitive three-year fixed rate for owner occupied principal and interest customers at 3.79%.
Other banks to increase their rates recently include IMB, AusWide, ING and Bank of Queensland.
Yesterday I discussed the issues of bank funding and the risks from a hike in rates in the context of our overall work on mortgage stress. Essentially, if the majors proceed with a ~15 basis point hike in rates, the number of households in mortgage stress will rise from an estimated 970,000 to one million households; plus a consequential rise in subsequent defaults.
We then proceeded to develop the arguments on 2GB…
ABC Radio in Sydney…
and ABC Radio Melbourne.
Some confused stress with defaults… sometimes even simple messages get scrambled.
In Wayne Byers speech yesterday – the one in which he said an 8% growth rate in residential home lending was “healthy (!)… he also covered the “stress testing”processes with the banks, and gave them a clean bill of health.
We ran our own scenario on our Core Market Model, using their worst case baseline, and we get a result much closer to the LF Economics scenarios we posted early than the APRA outcome. In fact we think the LF Economics numbers may themselves be conservative.
In addition from APRA, we get no detail on their work, and no individual bank level disclosure (unlike the US version). So we do not find the APRA version very credible. Which is a worry. Clearly their strategy is “just trust us” – just as they did with the now revealed poor lending practice.
So to summarize the “tests” are:
A downturn in China and a collapse in demand for commodities
The subsequent downgrade in sovereign and bank debt ratings leads to a temporary closure of offshore funding markets
A sell-off in the Australian dollar and widening in credit spreads.
Australian GDP falls by 4 per cent
Unemployment doubles to 11 per cent
House prices decline by 35 per cent nationally over three years.
In addition, banks had to consider an operational risk loss event involving misconduct and mis‑selling in the origination of residential mortgages. The additional operational risk element served as an amplifier of the stress, adding a further shock to bank balance sheets.
The result is a reduction in bank capital and credit losses of around $40 billion on their residential mortgage books. What have they assumed about property sales in default we wonder, and what about claims on Lender Mortgage Insurers at an industry level?
In addition, APRA does not really give us much detail of the scenarios (compare this with the US version). Is it a short sharp shock, or a long grind? We suspect the former.
Now, if we run the same scenario through our Core Market Model, based on our household surveys, what happens?
Well, first if banks cannot fund their books from offshore markets, their ability to lend, in aggregate drops by ~30%, unless it can be supplemented by either more deposits, or local investors. Remember that a significant proportion of the non-deposit part of bank books are funded short-term, so the impact will be immediate.
Either way there will be a rationing of credit and a bid up the price of funds – so putting more pressure on margins and mortgage rates. The local markets ability to provide sufficient funding is suspect, and it is likely that the Government via the RBA would have to provide funding, perhaps by the purchase of existing loan portfolios. We doubt the lenders ability to access funding. Loans will be rationed.
Households who are unemployed will be unable to continue to pay their mortgages, and will likely default. We have to assume that specific segments of the market will be most impacted, and we can run analysis on this. In addition some households renting will be unable to pay their rents as they fall due, putting some investment property under pressure.
We estimate that around 15% of mortgage holders will default. We assume that banks will try to assist borrowers, via their hardship schemes, and capitalise interest for a period, rather than foreclose (selling in a falling market just creates more losses).
So over the scenario time frame, using our data, we think credit losses will be will north of $310 billion. This compared with the $40 billion in the APRA results and $298 billion from LF Economics.
So why the difference?
Well, first, we think bank funding costs will be higher, thanks to the network effect of all lenders trying to tap limited sources thus driving rates higher still. APRA appears to have looked at banks individually.
Second, we think more households will be exposed to default risk as unemployment bites. In addition, we think that those remaining employed will have less overtime, and no wage growth so more financial pressure.
Third, the LVR and DTI ratios in our date (based on up to date data) suggests that the risks in the portfolio are actually higher than those used in the APRA (bank sourced) modelling. Some of this is so called “liar-loans” and the rest is multiple debt exposures and changed circumstances. Currently banks are myopic on this.
Fourth, Lender Mortgage Insurers will not be able to meet all claims. Not sure what APRA or the banks assumed. LMI’s might well be one of the first points of failure.
With that in mind, this is what APRA said:
When the storm hits – APRA’s most recent industry stress test
Alongside the gradual improvement in lending standards has been a significant increase in capital within the banking industry. This has been built first on the post-crisis Basel III reforms, and then on the recommendations of the 2014 Financial System Inquiry. As banks reach the “unquestionably strong” benchmarks that we announced last year, it will complete a decade-long build-up of capital strength.
ADI industry capital ratios
That capital exists today so that it can be called on in adversity. In 2017, we conducted our most recent test of banks’ resilience through an industry stress test. The aim of the stress test was not to set capital levels, and consistent with past practice it was not run as a pass or fail exercise. Rather, APRA utilises stress tests to examine the resilience of the largest banks, individually and collectively, and to explore the potential impacts of grim and challenging periods of stormy economic weather.
The scenario for the stress test was designed to be severe but plausible, and to target the key risks facing the industry. The basic scenario was a severe economic stress in Australia and New Zealand, with a significant downturn in the housing market at the epicentre. This was triggered by a downturn in China and a collapse in demand for commodities. The subsequent downgrade in sovereign and bank debt ratings leads to a temporary closure of offshore funding markets, a sell-off in the Australian dollar and widening in credit spreads. Australian GDP falls by 4 per cent, unemployment doubles to 11 per cent and house prices decline by 35 per cent nationally over three years.
Stress test – Real GDP growth
Stress test – House price index
To this traditional macro stress scenario we then added a twist. In addition to the sharp downturn in the economic environment, banks had to consider an operational risk loss event involving misconduct and mis‑selling in the origination of residential mortgages. The additional operational risk element served as an amplifier of the stress, adding a further shock to bank balance sheets.
Before sharing the results with you, I do need to note that these scenarios do not represent our official forecasts! They are obviously quite different from the base-case projections contained in most forecasts for the economy. But that is also why it is so important to test these severe but hopefully hypothetical scenarios – to avoid the risk of disaster myopia and a belief that we are somehow immune to tail risk events, given a benign track record and outlook.
The stress test involved 13 of the largest banks, and our approach was to generate the results in two phases. In the first, banks used their own models and parameters to estimate the impacts of the stress, subject to common guidelines and instructions to ensure a degree of consistency in the results. In the second phase, banks were asked to apply APRA estimates of the stress impacts, based on our own research, modelling, benchmarks and judgement.
While the phase 1 results were useful in shining a light on the banks’ modelling capabilities, and provided a view on what the banks themselves believe the impact of the scenarios would be, I’ll focus on the results from phase 2. These ironed out the kinks in modelling and, in our view, provided a more reliable and consistent set of results at a bank-specific and industry aggregate level.
Chart 11: Proportion of cumulative credit losses
As you would expect given the severity of the macroeconomic scenario, banks incurred significant losses, producing a substantial reduction in capital. Projected losses on the residential mortgages portfolio were large, consistent with the depth of the fall in house prices and the rise in unemployment. Overall, banks projected credit losses of around $40 billion on their residential mortgage books, which was equivalent to a little over a quarter of overall projected loan losses. As a loss rate, this would be broadly consistent with the experience in the UK in the early 1990s, but lower than the losses seen in Ireland or the US during the global financial crisis. It also represented a slightly lower loss rate than in APRA’s previous industry stress test in 2014. Some of this is due to differences in the scenario and in modelling, but it was also arguably reflective of the improvement in asset quality in recent years.
In aggregate, the common equity tier 1 (CET1) ratio of the industry fell from around 10.5 per cent at the start of the scenario to a little over 7 per cent by year three, a fall of more than 3 percentage points from peak to trough. This was driven by a combination of higher funding costs, significant credit losses and growth in risk weighted assets reflecting the deterioration in asset quality. Adding in the operational risk event, the aggregate CET1 ratio fell further to just below 6 per cent, driven by additional costs from customer compensation, redress, legal fees and fines.
CET1 capital ratio results Macroeconomic and operational risk scenario
Despite significant losses, these results nevertheless provide a degree of reassurance: banks remained above regulatory minimum levels in very severe stress scenarios. As importantly, these results have been estimated without assuming any management actions to respond to and mitigate the stress, such as equity raisings, repricing and cost cutting – all of which would occur in reality and lessen the impact. The results therefore represent if not a worst case scenario, then at least a scorecard towards one end of the spectrum of possible outcomes. Once we take into account expected (and plausible) management actions, the banks remain above the top of the capital conservation buffer throughout, and rebuild back towards unquestionably strong levels by the end of the recovery periods.
The funding and liquidity positions of the industry also stood up to the test. Despite difficulties accessing funding markets, most banks maintained their liquidity coverage ratios (LCRs) above 100 per cent through the crisis scenario. Some dropped below 100 per cent, but even then, those banks were able to initiate strategies to restore their position to good order within a reasonable timeframe. This is entirely consistent with how the LCR is intended to operate in severe conditions – liquidity is held in good times so it can be used when needed.
That general reassurance comes, however, with a note of caution. Like weather forecasting, stress testing is an inexact science. Modelling in Australia is complicated by a lack of experience of significant stress and periods of high loan defaults. This is a good problem to have, but it makes the stress testers’ task difficult, and widens the margin for error. That is particularly the case for the mortgages portfolio, and estimates of misconduct losses are of course necessarily judgement-based. In addition, the feedback loops from second order effects and competitor reactions are inherently difficult to model.
Given these challenges, stress testing needs to continue to evolve, and no one scenario can be relied upon for a definitive answer. In this vein, our 2016 exercise didn’t set a scenario at all, but instead asked the major banks to conduct a “reverse stress test”: to assume a fall in capital to minimum prudential levels, and estimate the scenarios that could have caused these outcomes.
The scenarios generated invariably included a macroeconomic downturn, compounded by a shock amplifier such as a cyber-security attack, mis-selling case or additional ratings downgrades. One bank assumed that it was last to market and couldn’t get an equity raising away, challenging a long-held belief that this cornerstone recovery action will always be available. The exercise was valuable primarily for broadening the stress testing imaginations of the participating banks, and reinforcing the importance of continuing to invest in capabilities.
This year, we will be assessing a range of banks’ stress testing capabilities through a review of internal capital adequacy processes (ICAAPs). Our review will focus on scenario development, internal governance and the use of stress testing to inform decision-making on appropriate capital buffers. In parallel, APRA and the industry will be subject to external examination: the IMF will be conducting a stress test of the Australian banking industry as part of its Financial Sector Assessment Programme (FSAP). We look forward to the results from this exercise, and to understanding what we can learn from their approach. Just as we expect banks to continue to invest in their modelling, data and capabilities, APRA will be reviewing its stress testing framework this year to identify areas for enhancement. We will also be preparing for the next industry stress test in our cycle, another opportunity to test resilience, explore vulnerabilities and challenge assumptions.
An excellent piece from LF Economics, which chimes with DFA data too by the way (more on that later). APRA’s “stress tests” are merely window dressing.
So yesterday APRA came out and said that if unemployment rose to 11%, House prices fell by 35%, and the Chinese economy tanked, that the Australian banking system would be able to withstand the economic stresses associated with this type of economic destruction.
So let’s use a bit of history as a guidance and put it to the test using the most abnormal of leniencies to assess whether APRA is full of cow-pat.
What history tells us from housing crashes in the past in other jurisdictions is that when house prices crash by 35% that the riskiest borrowers (those with the highest outstanding loans to income ratio’s and/or the lowest buffers) are totally wiped out alongside those who lose their jobs long enough to run out of savings and default on their mortgage.
As an example, those borrowers in the US just prior to the GFC who had a total liabilities to income ratio higher than 6x income were at a very high risk of default (and many did) when the GFC arrived. Those with a debt to income ratio of 8x or higher were all but guaranteed to go into foreclosure and lose everything they had.
Furthermore, it was all but guaranteed that those who were living beyond their means on the slimmest of income buffers (income – debt repayments- cost of livings) would too be foreclosed upon as the cost of risk rose.
Before even going there and factoring in job losses, the above two cohorts (the highly leveraged and those living beyond their means) alone represented a dangerous fringe of borrowers in the US that cost its economy, and its banking system very dearly when house prices fell.
The Oz banking stress test.
With limited data available here in Australia on banks mortgage books, it has been incredibly hard to find a sample of a banks mortgage book over the years to be able to conduct a stress test of some sort. But several weeks back, The Royal Commission released Westpac’s mortgage book sample that was used in APRA’s highly secretive ‘Targeted Reviews’. These reviews were never meant to see the light of day. But with good fortune, the Royal Commission ascertained these reviews and released Westpac’s, including the mortgage book sample. This mortgage book sample consisted of 420 loans issued over the 2015/16 period.
If this mortgage book sample has any resemblance to the greater mortgage market in general then it would be fair to say that stress testing this sample in a way that gives more benefit of the doubt than we should be giving…should be able to give insight whether a bank like Westpac….indeed the banking system in general would be able to survive in real life the elements that APRA used to conduct its stress test.
Now before we get to the figures I think it’s important to note that in relation to the data in the mortgage book sample, we assume that the data is correct. Yes correct! So correct, that for the sake of this stress test on this mortgage book sample we assume that the borrowers actually earn as much in income as the data suggests they do. Furthermore, we assume that the borrowers monthly costs of living data is accurate…despite some of this data pretty much implying that a fair cohort of borrowers will neither purchase a car, go on a nice holiday or buy any family members Christmas presents over the life of the loan.
We also assume that the total and existing liabilities of borrowers were not modified (reduced) to make borrowers appear more creditworthy than what they really are.
For the purpose of this stress test, and with history telling us that borrowers with the highest leverage ratios and lowest buffers are those who get wiped out, we snippet out the absolute fringes from the mortgage book sample to illustrate the collateral damage that coincides with an all-out economic catastrophe as APRA used in its stress test.
And just to give more than any reasonable absolute benefit of the doubt; instead of calculating credit write-offs of borrowers leveraged 8x or more, we assume that only borrowers who are leveraged 11x or more when the loan was issued are wiped out. Furthermore, we assume that borrowers whom only have a monthly uncommitted income of $70 or less also go into receivership. The findings do not double dip if a borrower has both 11x leverage to income and a uncommitted monthly income of $70 or less. We also assume that borrowers outside of the scope of the selected fringe thresholds ‘do not’ lose their jobs, or for any other reason default on their liabilities.
The findings.
Westpac mortgage book sample value – $397,364,308.15
Number of borrowers in mortgage book sample – 420
Number of borrowers who fail in the stress test according to our assumptions – 44
Sum of debt held by borrowers with total liabilities 11x income or greater – $41,180,593
Sum of debt held by borrowers with an uncommitted monthly income of $70 or less, but leveraged less than 11x – $14,345,483.91
Percentage of borrowers who fail the stress test – 10.48%
Proportion of mortgage book sample value that fails stress test – 13.97%
Losses to the banking system if scaled: $298 Billion
Conclusion
Despite giving more than the benefit of the doubt on highly questionable data, if Westpac’s mortgage book sample has any broader resemblance or correlation with the broader profile of the Australian household debt market, there is simply no way Australian banks would ever survive APRA’s implied elements used in its stress test once you factor in the further losses outside retail banking in real life….. In other words, there would simply be too much distressed debt, not even the funds from the Committed Liquidity Facility will have enough to cut the mustard to cover the shortfalls. And this is just based on the assumption that fringe borrowers leveraged 11x income or greater, and/or have less than $70 a month buffer wont repay will default in an economic disaster.
In ending, the results of APRA’s stress test further provide evidence that they are a captured regulator..
Mortgage Choice Limited says that the Board has approved a new broker remuneration framework which will provide franchisees with higher remuneration and reduced income volatility. The Company is confident the new model will enable franchisees to invest in their business while attracting new, high quality franchisees and loan writers to the network. This will provide a platform for growth and underpin the long term sustainability of Mortgage Choice.
Key features of the new model, which will be offered to all franchisees on an opt-in basis from August 2018, include:
increase in the average commission payout rate on residential lending from 65% to 74%;
unique hybrid trail commission structure which pays the best monthly outcome on either a flow or book basis; and
designed to reduce income volatility, providing better protection for franchisees in the event of a market downturn.
Susan Mitchell, CEO of Mortgage Choice, said all of the broker franchisees are likely to opt-in to the new model, as they will be better off financially.
“When we commenced discussions with franchisees, it was with a view to introducing a model that allowed them to earn more so they had the confidence to invest in their business, while still supporting them under a national brand with the services they value including IT, compliance, training, marketing and business planning. The hybrid trail commission structure we are introducing is unique. It rewards franchisees as they grow and provides better earnings certainty through periods of investment. We believe all franchisees will adopt the new model as it caters for businesses across the life cycle spectrum, from greenfield to more established brokers,” said Ms Mitchell.
To partially offset the impact of a higher average payout rate to franchisees, Mortgage Choice has initiated a program to improve operating efficiencies across its business. The Company is changing the way it delivers some of its core support services to franchisees as it moves to a more centralised, online and phone based model. It has commenced a program of implementing operational efficiencies across the business. This will result in an approximate 10% reduction in its operating expense base. Driving continual efficiency improvements will be a focus for the business over the next year.
The Company will continue to invest in its IT systems and expects to roll out its new broker platform in August, which will improve the customer experience and franchisee productivity.
“These changes are the product of extensive consultation with broker franchisees and the recognition we needed to rebalance our service provision with more competitive remuneration,” said Ms Mitchell. “Franchisees will have access to the same core services, just delivered in a more efficient way. At the same time, we are investing in a new Broker Platform that will improve broker productivity and enhance their service levels to customers.
“The demand for the services of a mortgage broker is strong and we believe these initiatives will provide the platform for a sustainable business model for Mortgage Choice and a framework for franchisees to succeed by helping more Australians make better financial choices.”
Guidance
Mortgage Choice expects its cash NPAT for FY2018 to be between $23.2m and $23.4m after accounting for one-off costs associated with redundancies and the change in CEO. As a result of the changes being introduced, there will be a one-off, non-cash negative adjustment of approximately $30m to IFRS NPAT for FY2018 to reflect the higher level of franchisee share of future trail revenue. The Company’s full audited results will be released to the market on 21 August 2018.
Assuming settlements at the same level as FY2018 and taking into account the new remuneration model and operational changes being introduced across the business, Mortgage Choice expects FY2019 cash and IFRS NPAT to be approximately $16.5m.
Interest-only mortgagors are generally wealthier and have a higher risk appetite than other mortgagors, but they are increasingly turning to alternative sources of finance as lending criteria tighten, a Westpac economist has said; via The Adviser.
Writing in a bulletin titled Profiling Australia’s ‘interest-only’ borrowers, Westpac senior economist Matthew Hassan and graduate William Chen looked at two data sets relating to owner-occupier loans before the introduction of APRA’s 30 per cent cap on the share of interest-only loans in 2017.
The report argued that, in many cases, the borrowers that are rolling off IO period will be facing increased repayments and may encounter difficulties refinancing against the backdrop of tightening lending criteria.
It noted that interest-only (IO) borrowers have experienced significant increase in mortgage rates between 2014 and 2016, being 46–58 basis points higher than their standard counterparts.
By using data from the Melbourne Institute’s Household, Income and Labour Dynamics in Australia Survey (HILDA), the researchers therefore sought to understand what a typical interest-only borrower looks like to “get a better idea of how some of these pressures might play out”.
The report suggested that just over 12 per cent of mortgagors had IO loan terms, accounting for 3.8 per cent of all households, down slightly on 2014 when just under 4 per cent had an IO loan. The report argues that this “likely reflects tightening lending conditions and the introduction of rate tiering measures from 2015 on”.
According to the 2016 survey, the quality of interest-only borrowers has improved over 2014–16 as lending conditions have tightened, with a notable decline in the share of high loan-to-value ratio (LVR) loans — from nearly 10 per cent of IO borrowers having a self-assessed LVR over 0.9 — down to 6.7 per cent in 2016.
Most IO mortgagors, the researchers outlined, came from eastern capitals and Perth (accounting for just under 70 per cent of all IO borrowers in 2016) and are generally wealthier than their non-IO counterparts.
Just under 30 per cent of IO borrowers in 2016 had “regular” disposable incomes over $150,000 a year (compared to around 20 per cent of other mortgagors), up from 25.9 per cent in 2014, while the proportion of IO borrowers with casual jobs or self-employed was down by 5 per cent in 2016 when compared to 2014.
While the report found that the share of fixed term IO contracts remained “relatively high” (around 10 per cent versus 6.9 per cent for other loans), which it said was “likely reflecting the product’s appeal for those with intermittent income flows”, it added: “Overall, it appears that ‘lower-quality’/‘higher-risk’ borrowers are being squeezed out of the interest-only market as lending standards have tightened.”
Behind schedule and borrowing from others on the rise
Other findings in the bulletin included:
A higher prevalence among interest-only borrowers to identify as financial “risk takers” (in 2016, 20.4 per cent of IO borrowers self-assessed as willing to take “above-average” or “significant” financial risks, roughly double the 10.1 per cent of other mortgagors).
An increase in risk appetite among interest-only borrowers across 2014–16.
IO borrowers also tend to be more trusting (71.7 per cent of IO borrowers agreed that “most people can be trusted” while just under a third of other mortgagors said the same).
IO borrowers are also more likely to have high spending on education fees (5.6 per cent paying more than $10,000 a year compared to 4.4 per cent of other mortgagors), which the authors argued “may impact those seeking to refinance loans, with some lenders changing the way education costs are treated in loan serviceability assessments (shifting more towards a mandatory expense rather than a discretionary one).
Notably, the bulletin showed that less IO borrowers are ahead of repayments than other types of mortgagors (28.3 per cent compared to 56.4 per cent), which the researchers suggested could be an indication that interest-only borrowers have “less financial ‘headroom’ to make ahead of schedule repayments” and/or reflect that those with higher risk appetites may be more likely to put spare cash towards investment in yielding assets rather than service their mortgages ahead of schedule.
Those behind schedule are also higher than other types of mortgagors — 3.9 per cent versus 2.2 per cent. However, this marked an improvement from 2014 when 7.7 per cent of IO borrowers reported being behind schedule.
“This likely reflects the wider improvement in borrower quality seen in the income, employment and LVR profile of interest-only borrowers. An increased reliance on ‘alternate’ funding sources may also relate to tightening credit criteria and affordability pressures,” the report read.
Further, more IO borrowers are borrowing from others (friends, relatives, solicitors or community organisations) in order to help finance their home purchase, up from 5.4 per cent in 2014 to 7.9 per cent in 2016. This compares to a small decrease among non-interest-only borrowers over the same period.
“It is evident that some are having to resort to alternate sources of finance as lenders apply tighter lending criteria. Some would-be borrowers that have been unable to raise alternate funds have likely been squeezed out of the interest-only market.”
In conclusion, the senior economist wrote: “It is very likely that there are several different ‘stylised’ types of interest-only borrowers. Some will be making choices that suit their income flows. Others may be actively seeking to take on financial risks but with the capacity to do so.
“Some, however, may have opted for interest-only loans as a more desperate measure to acquire property that could see them more stretched and exposed.”
Mr Hassan added: “Since the last HILDA release, there has been further tightening in lending conditions, with APRA imposing a 30 per cent cap for interest-only lending in March 2017. Given this further tightening, it will be interesting to see what picture subsequent surveys paint for Australia’s interest-only borrowers.”
Indeed, some statistics have already shown that interest-only lending is falling out of favour with borrowers. In March, Mortgage Choice revealed that the proportion of interest-only (IO) mortgages written by its brokers fell by more than 20 per cent in the 12 months leading to February 2018. IO loans accounted for 12.22 per cent of all home loans written in February 2018, down by 23.73 per cent from 35.95 per cent.
Meanwhile, APRA property exposure figures show that only 15.71 per cent of loans written in the March quarter were interest-only.
Many entrenched motivations for misconduct in the banking sector have been uncovered by the ongoing royal commission. Not least are the conflicts of interest inherent in the major Australian banks providing financial, insurance and mortgage advice and selling related products.
The banks, most recently the Commonwealth Bank (following the lead of ANZ and NAB), are already separating their wealth-management arms – services such as mortgage broking, insurance and financial planning and advice – in a bid to resolve these conflicts of interest.
These restructures are a step in the right direction. But they are not enough to overcome the fundamental problem: the banks’ sales-driven culture. This goes much deeper and seemingly pervades all of their operations, as the royal commission has highlighted.
The nature of this problem lends weight to an Australian Securities and Investments Commission (ASIC) proposal to embed regulatory staff in the major banks to help change the culture.
Bankers’ priorities laid bare
The evidence made public by the forensic analysis of Rowena Orr QC, counsel assisting the commission, has revealed many instances of the banks’ “toxic” culture. It’s one that puts profits and growth – in particular their associated incentive systems – above customers’ interests.
This has been evident from the outset. The first round of hearings in March 2018 revealed allegations of significant cash bribes, forged signatures and manipulation of incentives within NAB’s “Introducer Program”. This generated billions of dollars in home loans for the bank, with introducers paid 0.4-0.6% of home loan totals.
We have had belated “apologies” to customers who were treated unfairly or, worse, fell victim to unscrupulous or wrongful behaviour; admissions that the banks breached their own codes of conduct; and assurances that changes in governance systems aimed at improving culture have been made or will be. Yet the banks are still in denial that systemic cultural issues have been at play or persist in their organisations.
A stark example is provided in the evidence of Rabobank executive Bradley James at the most recent hearings that dealt with issues of farming finance. Orr questioned James about a A$3 million loan made on the advice of a manager of this rural lender to a Queensland grazing family, the Brauers. They had no ability to repay it. The motivation for the manager was to meet his lending KPIs to earn a bonus.
Asked whether he saw any difficulty with that from a customer perspective, James’s response was: “Absolutely not!” This shows a complete failure to understand the bank’s incentive structure – linking staff bonuses to the number of loans brought in – and the culture that goes with it as a potential source of misconduct.
James defended the bank’s system, saying it enabled the business to grow. This demonstrates that, in putting profits and growth ahead of customers’ needs, banking culture is out of touch with community expectations and societal values.
Regulators must step in
Little wonder, then, that trust in the financial sector is at an all-time low. ASIC chair James Shipton speaks of a “trust deficit”.
Shipton is seeking government funding to embed specialist ASIC supervisors in the major banks to help drive cultural change and rebuild trust. This should be done, signalling as it does a new, more intrusive regulatory style.
However, ASIC should do more. It needs to take enforcement action. Most notably this would include prosecution in cases of criminal wrongdoing by the banks and their top executives. The latter have been conspicuously absent at the royal commission, raising important questions about bank accountability.
Another corporate regulator, the Australian Competition and Consumer Commission (ACCC), last month brought criminal proceedings against ANZ and several other companies and individuals over an alleged cartel arrangement. Commentator Nathan Lynch observed that, irrespective of the outcome, one message reverberates: senior management accountability:
Governments and regulators have had enough of financial services firms that are still talking about improving culture and conduct. A decade on from the financial crisis … they now want to see a healthy dose of fear and respect in the market.
Regulators are now at the point where they’re saying, ‘It’s impossible for things of this magnitude to happen without the people right at the top knowing what was going on.’
If ASIC also took such action, it would go a long way to overcoming concerns about an accountability deficit for the scandals and wrongdoing. This could be a catalyst for real cultural change in the industry to reduce misconduct in the future.
Why isn’t restructuring enough?
As for the current bank restructures, certain aspects are problematic.
In the first place, not all will result in a full separation of their businesses. The CBA will split off its wealth management, mortgage broking and insurance businesses, but retain its financial advice business. ANZ has sold its wealth management business to IOOF, but will not sell its life insurance business.
In addition, the banks remain keen to distribute products to retail customers. For example, ANZ’s sale to IOOF includes a 20-year deal to make IOOF super and investment products available to its retail customers.
These moves raise concerns that, despite these demergers, conflicts of interest and the banks’ failure to act in customers’ interests will continue.
At a minimum, Shipton’s plan to put ASIC agents in banks is more important than ever when the indications are that the banks cannot be left to self-regulate.
Author: Vicky Comino Lecturer in Corporations Law and Regulation of Corporate Misconduct, The University of Queensland
APRA pretty much says they called it just right, and their tightening has not really impacted overall growth, and any further tightening will be marginal.
First, the changes in lending practices to date do not seem to have had an obvious impact on housing credit flows in aggregate. Total housing lending grew at around 6 per cent in the year to May 2018, which is only marginally below long-run averages and roughly in line with the average run rate since 2011 (covering the period since house prices last went through a period of softening in Australia). Indeed, cumulative credit growth in the roughly three and a half years since APRA stepped up the intensity of its actions was greater than cumulative credit growth in the preceding three and a half years. Credit growth appears to be slowing somewhat at the moment, but that is not surprising in an environment of softening house prices and rising interest rates.
Second, it is evident that the composition of housing credit has shifted notably. Lending to investors is certainly now growing more slowly compared to three or four years ago. But despite the tightening in lending standards – which, it’s important to remember, also apply to owner-occupiers – lending to owner-occupiers grew at a very healthy 8 per cent over the past year. This relatively high rate of rate of growth for owner-occupiers (running broadly at almost 3x household income growth) has been sustained during a period in which lending policies and practices have been gradually strengthened.
Despite the prominence it has been given, our goal in seeking to reinforce standards and practices has been relatively modest: ensuring that internal policies are followed in practice, and applying what is, in most cases, a healthy dose of common sense. This has been an orderly adjustment, and we expect it to continue over time. While there is more “good housekeeping” to do, the heavy lifting on lending standards has largely been done. Any tightening from here on is expected to be at the margin as banks seek to get a better handle on borrower expenses, and better visibility of borrower debt commitments.
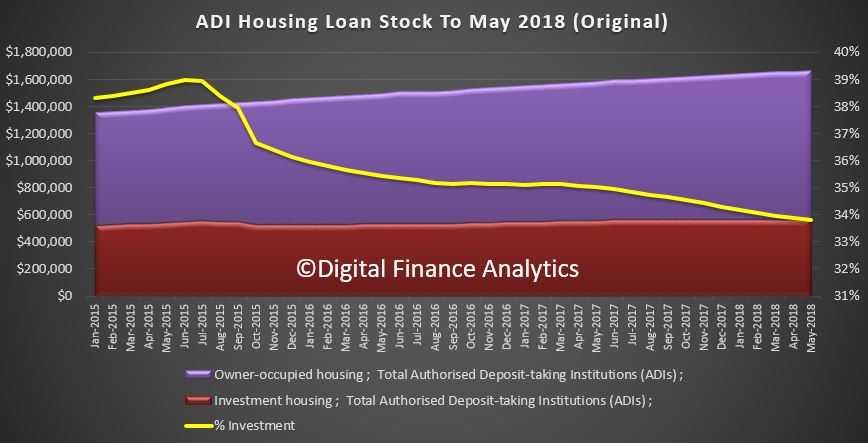
The ABS data shows that total lending stock grew again in May. This is original data split between owner occupied and investment loans.
Total housing loan stock rose 0.5% in the month to $1.66 trillion. Within that owner occupied lending rose 0.5% to $1.1 trillion and and investment lending rose just 0.1% to $563 billion. Investment loans fell to be 33.8% of all loans. Overall growth is circa 6% annualised. As for whether growth at 3 times income is “healthy” to quote Wayne Byers; well that’s another story. Remember debt has to be repaid, eventually.
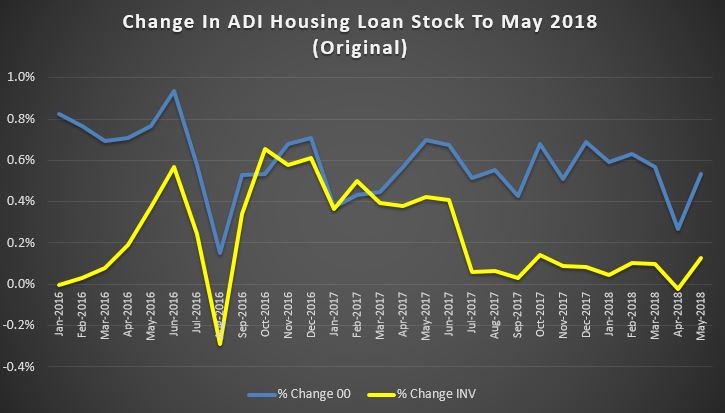
Growth has been strongest in owner occupied lending, but investment lending was also higher.
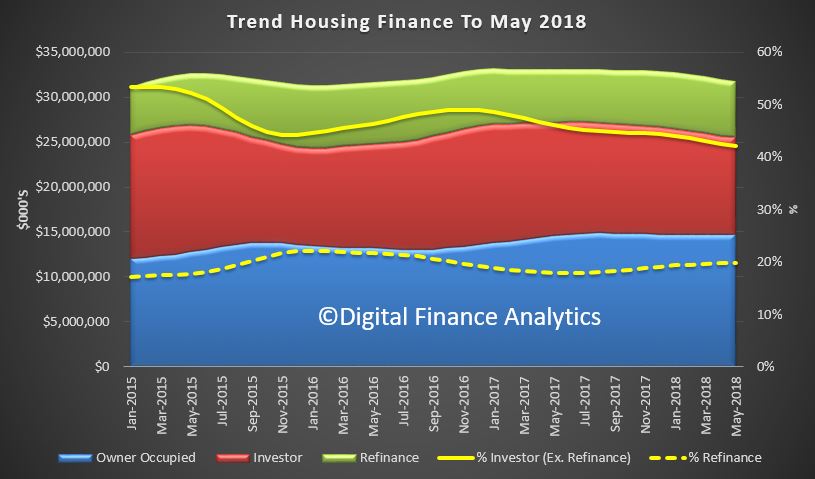
The trend housing flows were down month on month with a fall of 0.1% in owner occupied lending to $14.7 billion and investment lending down 1.9% to $10.7 billion. There was$6.3 billion of refinancing, a drop of 0.4%. 42% of lending was for investment purposes (excluding refinancing) and 19.9% of lending was refinancing, this proportion rose a little.
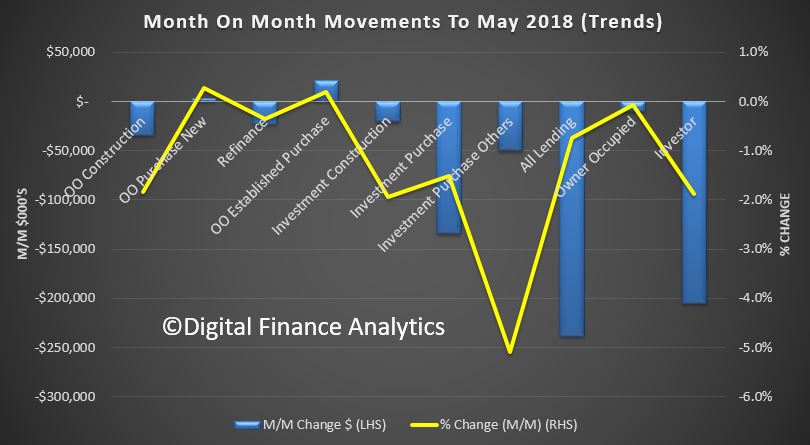
Looking in more detail at the trend movements by category, only owner occupied purchase of established dwellings rose, all other categories fell back. Investor lending continued to slide on a relative basis.
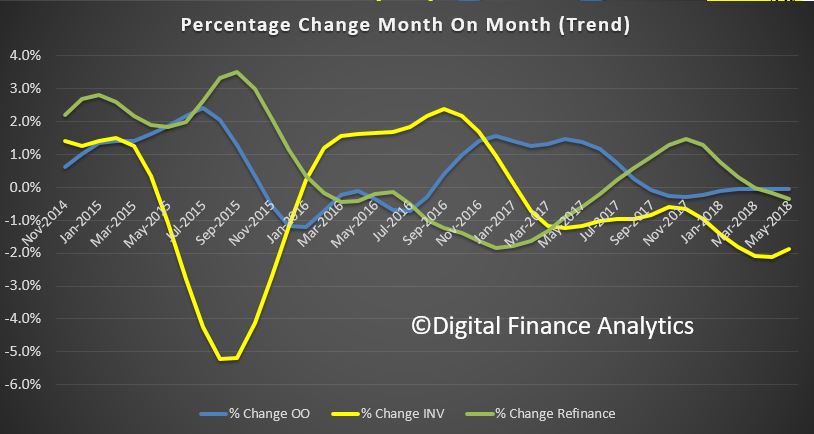
The month on month changes show the movements, and we note a slower rate of decline in investor lending.
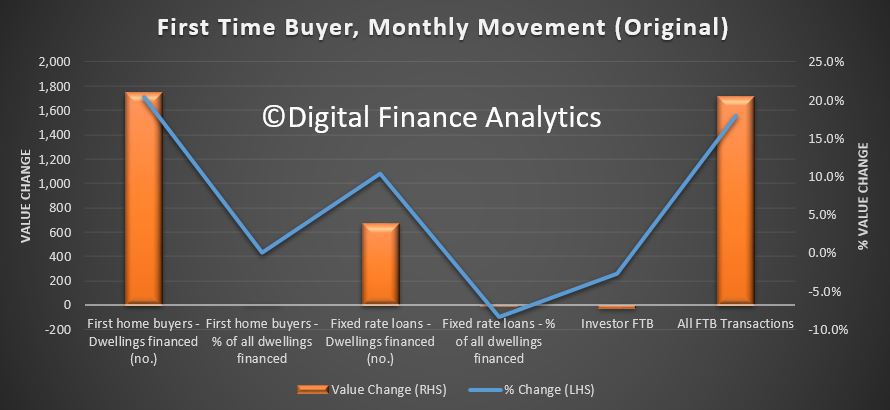
First time buyers continue to support the market, with a 17.6% share of all loans written but a significant rise in the absolute number of first time loans written (up 20.5% on last months) as well as a rise in non first time buyer borrowers. These are original numbers, so they do move around from month to month, and does reflect the incentives for first time buyers in some states.
The number of investor first time buyers continues to fall.
The month on month movements show the additional 1,750 buyers in the month. Worth noting also that the average loan size continues to grow, at $412,000 for non-first time buyers, up 0.4% on the previous month and $344,000 for a first time buyer, up 0.5%. There are some variations across the states, but I won’t include those here. There was also a further fall in the number of fixed rate loans being written, down to 12.1% from 13.2% last month.
To me this begs the question, if credit is still running at these levels, and APRA says the tightening is all but done, will we see home prices starting to trend higher? Clearly the plan is to keep the debt bomb ticking for yet longer.
But this may well mean the RBA will lift rates sooner than I expected.
ASIC has banned former National Australia Bank branch manager, Rabih Awad, from engaging in credit activities and providing financial services for seven years.
The ban is the result of an on-going ASIC investigation, following a breach report lodged by NAB alleging that bank employees in the greater western Sydney area were accepting false documents in support of loan applications and falsely attributing loans as having been referred by NAB introducers in order to obtain undue commissions.
ASIC found that Mr Awad recklessly gave NAB information and documentation in loan applications that was false or misleading. Mr Awad was found to have given NAB false payslips, letters of employment, and entered false referee contact details in NAB’s lending systems in multiple home loan applications.
A majority of the false documentation submitted to NAB by Mr Awad was provided to him by a real estate agent who was previously registered as a NAB Introducer.
ASIC also found that:
Mr Awad received the false documents directly from the NAB Introducer rather than the customer, in violation of NAB’s Introducer Program; and
on occasion, Mr Awad received false documents from the NAB Introducer via email to his personal email account, before forwarding the documents to his NAB email account and subsequently attaching them to various customers loan applications.
Mr Awad has the right to lodge an application for review of ASIC’s decision with the Administrative Appeals Tribunal.
Background
On 16 November 2017, NAB announced a remediation program for home loan customers after an internal review, prompted by whistleblower reports it had received, found that some home loans may not have been established in accordance with NAB’s policies.
NAB identified that around 2,300 home loans since 2013 may have been submitted with inaccurate customer information and/or documentation, or incorrect information in relation to NAB’s Introducer Program.
Mr Awad’s banning follows the permanent bans of former NAB employees, Danny Merheb and Samar Merjan (also known as Samar Awad) from engaging in credit activities and providing financial services (refer: 18-205MR).