Open banking – the invisible reform that will shake up UK financial services

From The Conversation.

Open banking launched on January 13 in the UK. It requires major banks to share data with third party financial providers. This will bring a new level of transparency and encourage competition, shaking up the financial services industry and levelling the playing field for new challengers to take on the more established high street banks.

The reforms follow a 2016 investigation by the Competition and Markets Authority into retail banking. Its report concluded that the existence of barriers to entry for smaller and newer banks made the banking market less competitive.

This paved the way for open banking, which requires banks to securely share customers’ financial data with other financial institutions – provided customers give their permission. This should boost the range of products and deals made available to people and facilitate more switching, with offers better tailored to individuals, based on their past spending habits.

It will also enable people to bring together their financial information from different providers so they can, for example, open one app and see a list of their accounts with other banks.

All in all open banking is set to change the financial services industry in several ways.

Better banking options

The launch of open banking will be a turning point for large retail banks in the UK. The traditional retail banking business model will be transformed from a closed one to a modern, open source one.

The basis is a united financial platform that has been designed to provide users with a network of their financial data. This will disrupt the existing advantages that big banks in the UK have where they have a monopoly on customers’ data, not making it easy for customers to see the alternatives that are out there.

With more access to customers’ data, new financial technology (fintech) start ups, which are able to provide innovative solutions and modern financial products, will develop and challenge the traditional industry. Meanwhile, the increased competition and narrower profit margins will force existing big banks to adopt new technologies, improve their customer services and open up new revenue streams to keep up.

Better payment systems

Open banking will enable financial institutions to launch easy, fast and innovative global payment methods. Linked with the EU’s Second Payment Services Directive, which also comes into force this year, open banking also aims to boost competition in payment methods, which has been in need of a modernisation in the digital era.

The open access to people’s financial data means that new payment services can be developed. New providers will be able to initiate online payments (whether to friends, retailers, charities) directly from the payer’s bank account, avoiding the use of intermediaries like banks. Paying bills and transferring money will become as easy as sending a message.

As well as the emergence of new services that are more efficient, they should also be secure. Key to the new open banking standards is enhancing financial safety. Third party financial services providers will be required to obtain licenses and to meet the rules set by the main UK bank regulator, the Financial Conduct Authority.

Collaboration between banks and fintech

Open banking will digitise UK banking and strengthen UK fintech. Under the new regulation, fintech firms will play a more important role in the financial services industry and a huge number of fintech startups will enter into competition with existing major banks.

In a world of digital financial systems, big banks will have to rethink their position. Until now, collaboration between banks and fintech firms has mostly involved the financing of acquisition of fintech firms by big banks or partnership agreements, which enable a bank to use or acquire a digital solution developed by the fintech company.

Collaboration needs to become more customer focused – providing people with better products and solutions. Plus, a successful strategy for banks lies in greater cooperation with fintech firms to improve their own, often older technology to help them lower costs and improve customer experience, as well as developing new income streams so they can compete in the long term.

There are still unanswered questions about how open banking will play out. Security and privacy is fundamental to its successful implementation. Nonetheless, it is a revolutionary experiment aimed at boosting retail banking competition and will help new challengers in the financial services space to grow.

Authors: Ru Xie, Senior Lecturer in Finance, University of Bath;
Philip Molyneux, Professor of Banking and Finance, University of Sharjah

Why Stamp Duty Bills are Snowballing – HIA

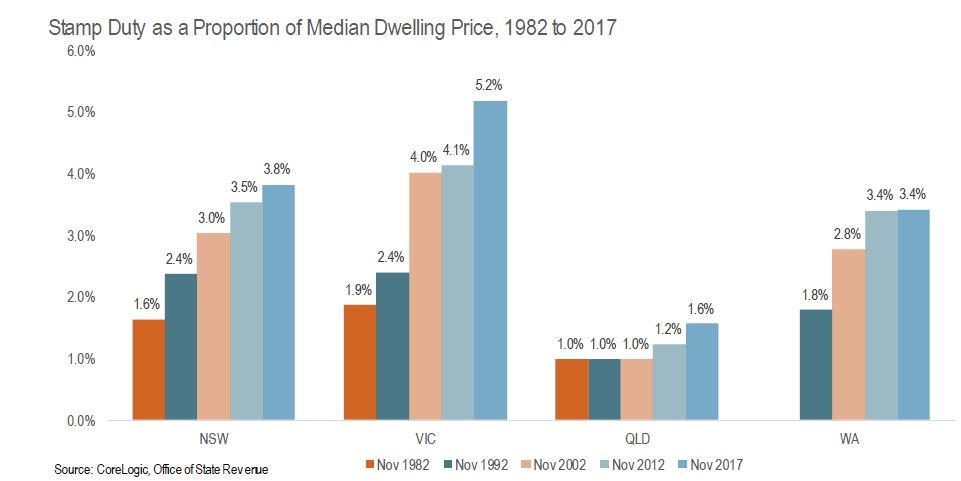
The HIA says that stamp duty bills have increased almost three times faster than house prices since the 1980s and this trend will continue unless stamp duty is reformed. This result is contained in the latest edition of the HIA’s Stamp Duty Watch report which provides an analysis of state governments increasing reliance housing taxes.

The results also highlight just how much high property prices are helping to stoke state coffers – $20.6 billion in 2016- and the risks attached should this change! A switch to a broader property or land tax might be an option, but is politically risky. This would need to be part of broader property sector reform.

HIA Senior Economist, Shane Garrett says

In Victoria, the typical stamp duty bill increased from 1.9 per cent to 5.2 per cent of the median dwelling price between 1982 and 2017 – equivalent to a surge of 4,000 per cent in the cash value of stamp duty. NSW homebuyers fared little better with the stamp duty burden rising from 1.6 per cent to 3.8 per cent over the same period.

Increases in home prices cause stamp duty bills to accelerate because stamp duty rate brackets are rarely updated. This is the problem of stamp duty creep.

In NSW, stamp duty rates have not been reformed since the average house price was $70,000 (1985).

State governments are compounding the housing affordability crisis. Total stamp duty revenues have almost doubled over the past four years: from $11.7 billion in 2011/12 to $20.6 billion in 2015/16 – most of which is likely to have come from residential building. State governments are now more reliant on stamp duty revenues than at any time for a decade. This trend will continue unless state governments recalibrate their taxes on housing.

State governments are increasingly reliant on rising stamp duty revenues. This situation is not sustainable.

The stamp duty burden is increasing under every metric: nominal dollars, real dollars, as a proportion of dwelling prices and as a share of total state revenue. Without reform, this trend will continue.

By draining the pockets of homebuyers to the tune of over $20 billion each year, stamp duty is a central pillar of the affordability crisis. A long plan to do away with the scourge of stamp duty would be a huge victory for housing affordability in this country.

Removal of Negative Gearing Would LIFT Home Ownership

More evidence that negative gearing should be revised was contained in a preliminary paper released recently, having been discussed with the RBA in November. Melbourne University researchers Yunho Cho, Shuyun May Li, and Lawrence Uren suggest their modelling shows that the removal of negative gearing would potentially lift homeownership rates by 5.5%, and that “renters and owner-occupiers are winners, but landlords, especially young with high earning landlords, lose”. They stress this is preliminary, but nevertheless it adds to the weight of evidence that negative gearing should be reformed. Their data also again shows how a small number of affluent landlords are benefiting disproportionately at the expense of the tax payer .

The welfare analysis suggests that eliminating negative gearing would lead to an overall welfare gain of 1.5 percent for the Australian economy in which 76 percent of households become better off.

This is significant, given the annual government expenditure
on negative gearing is estimated to be $2 billion, or 5 percent of the budget deficit for the year 2016. Eliminating negative gearing would reduce housing investments and house prices, and increase the average home ownership rate. The supply of rental properties falls, rents increase but only marginally because its demand also falls.

The data in their report also underlines the significant growth in property investors, and the consequential rise in mortgage lending and negative gearing.

The left panel in Figure 1 shows that the proportion of landlords has risen by around 50 percent over the last two decades. The right panel in Figure 1 shows that the real housing loan approvals have also increased dramatically during the same period. In particular, the loan approvals for investment purposes increased more sharply than that for owner-occupied purposes, surpassing it by around $0.5 billion in the early 2010s.

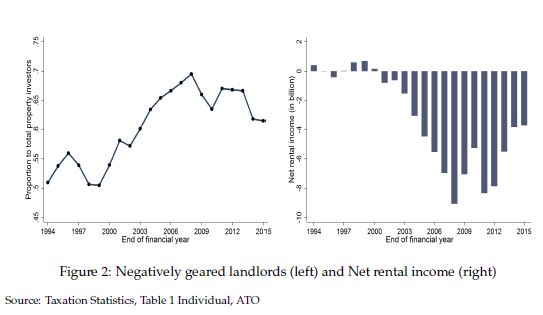
Figure 2 documents the proportion negatively geared landlords and the aggregate net rental income across the period from 1994 to 2015. The left panel in Figure 2 shows that the proportion of negatively geared landlords has increased from 50 percent in 1994 to around 60 percent in 2015. The right panel in Figure 2 shows that the aggregate net rental income became large negative from the early 2000s onwards. Evidence shown in Figures 1 and 2 suggest that Australian households increasingly participate in the residential property investment and take advantage of negative gearing, reducing tax obligations with the flow loss incurred from their housing investment.

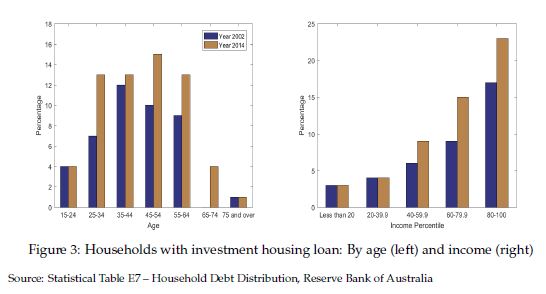
Figure 3 compares the share of households with home loans for investment by age (left panel) and income percentile (right panel) for the years 2002 and 2014. There has been a significant increase in the share, particularly among young to middle-aged households.

The largest increase was occurred in the age group 25 – 35, increased by 85 percent from 7 percent to 13 percent. From the right panel, we find that the share of households with investment housing loans has increased mainly among those in upper income percentiles.

These evidence are in line with the arguments by opponents of negative gearing that the policy essentially benefits the rich households who borrow and speculate in the property market. The fact that the distribution of housing investment loans is different across age and income also motivates our use of a heterogeneous agents incomplete markets model to study the implications of negative gearing.

This is consistent with our own surveys and analysis on negative gearing. Good data and analytics can negate political rhetoric, even it takes time…!

Finally, of course is the important point, should interest rates rise then the value of negative gearing claimed will rise, putting a heavier burden on the Treasury, at a time when the cost of Government borrowing would be also rising. A double whammy – a multiplier effect.

The Problem With Productivity – Is The Finance Sector To Blame?

Silvana Tenreyro, External MPC Member, Bank of England, spoke on “The fall in productivity growth: causes and implications” as the 2018 Maurice Peston Lecture.

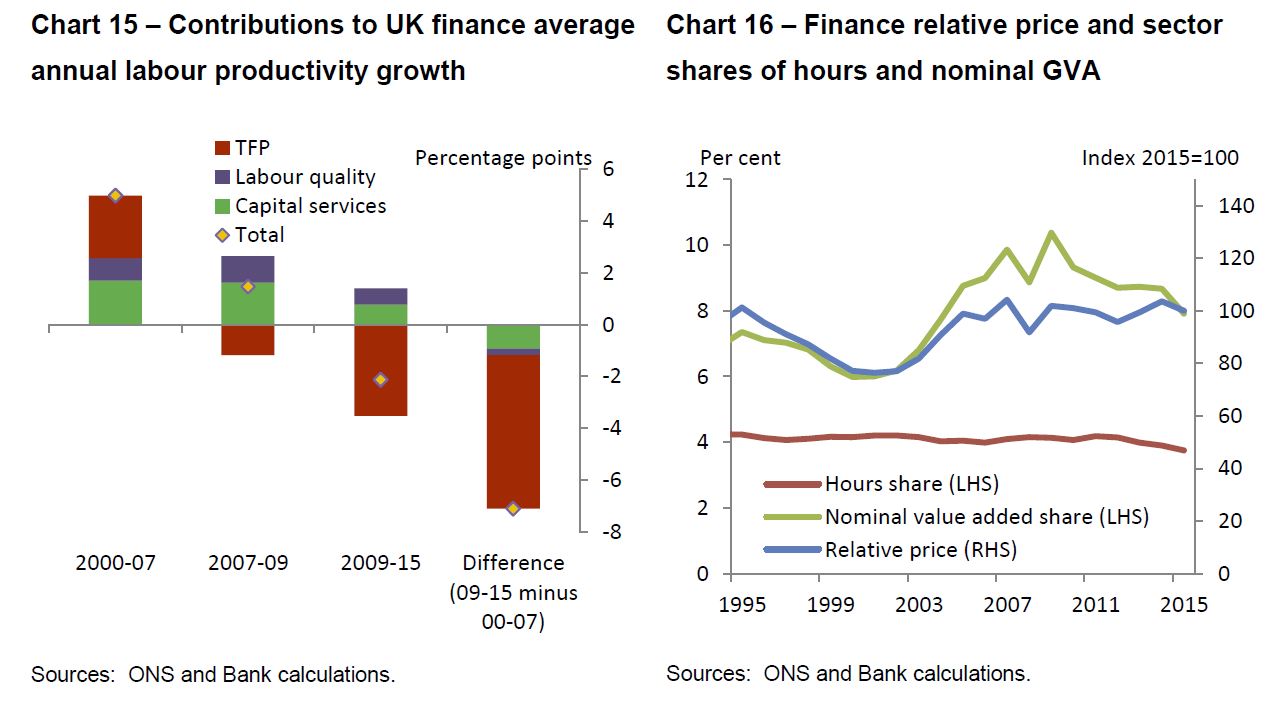
She explores the problem of low productivity since the GFC, and using UK data shows that the brake on productivity growth is from finance, manufacturing followed by ICT and services. But finance appears to be the number one sector causing the problem. It had the fastest-growing labour productivity of any sector in the run-up to the crisis, at 5% per year. Since 2009, productivity has actually shrunk by 2.1% per year. Indeed, key contributors to the crisis itself – risk illusion and increasing financial-sector leverage – may have increased (correctly measured) pre-crisis productivity growth.

Reading from this, as the finance sector continues to respond to pressure on margins, increased regulation, and lower growth, we think it will continue to be a brake on productivity, and it is possible that the growth of financial activities somehow crowded out the growth in the rest of the economy in a competition for talent and resources. Echoes of our recent discussion on Zombie firms! Relying more on the finance sector for growth looks like a problem.

Here is a summary of the speech.

Though commentators have referred to different measures of productivity, most have focused on aggregate labour productivity, defined as the total value added of the economy divided by the total number of hours worked.

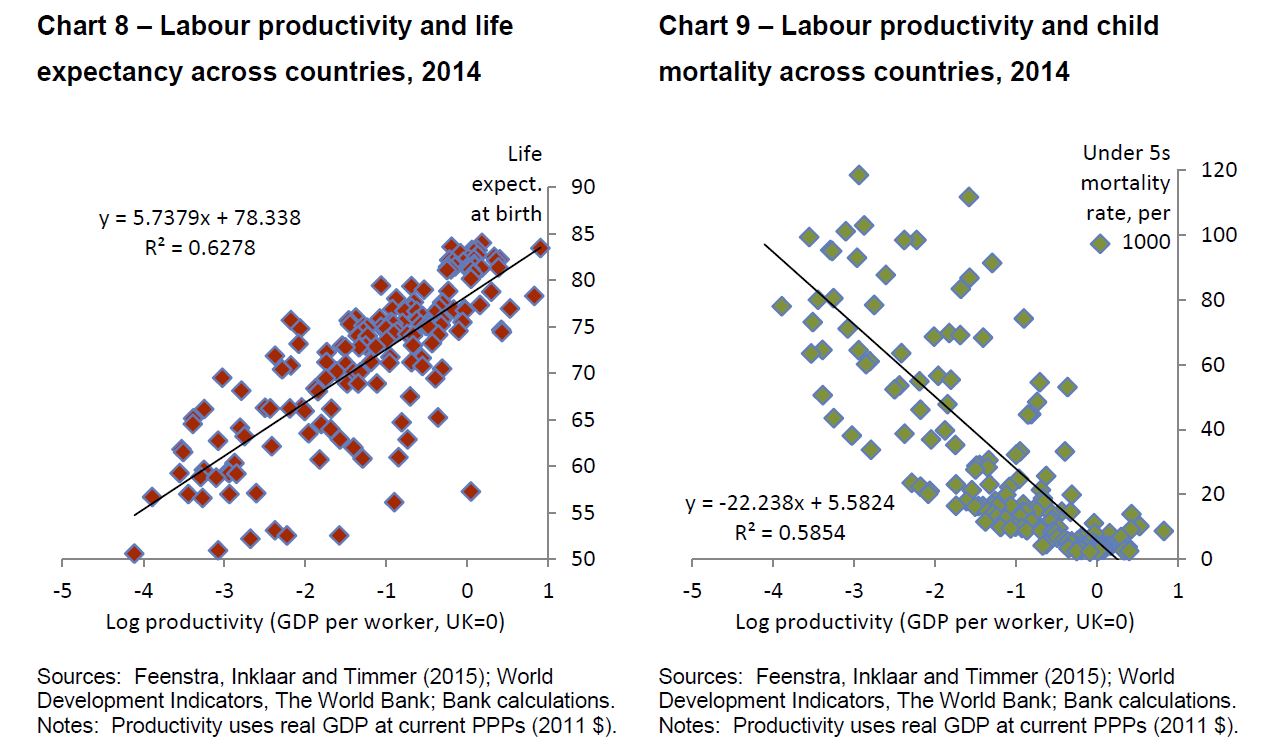
Productivity matters for welfare. Over time and across countries, higher productivity is reliably associated with higher wages, higher consumption levels and improved health indicators.

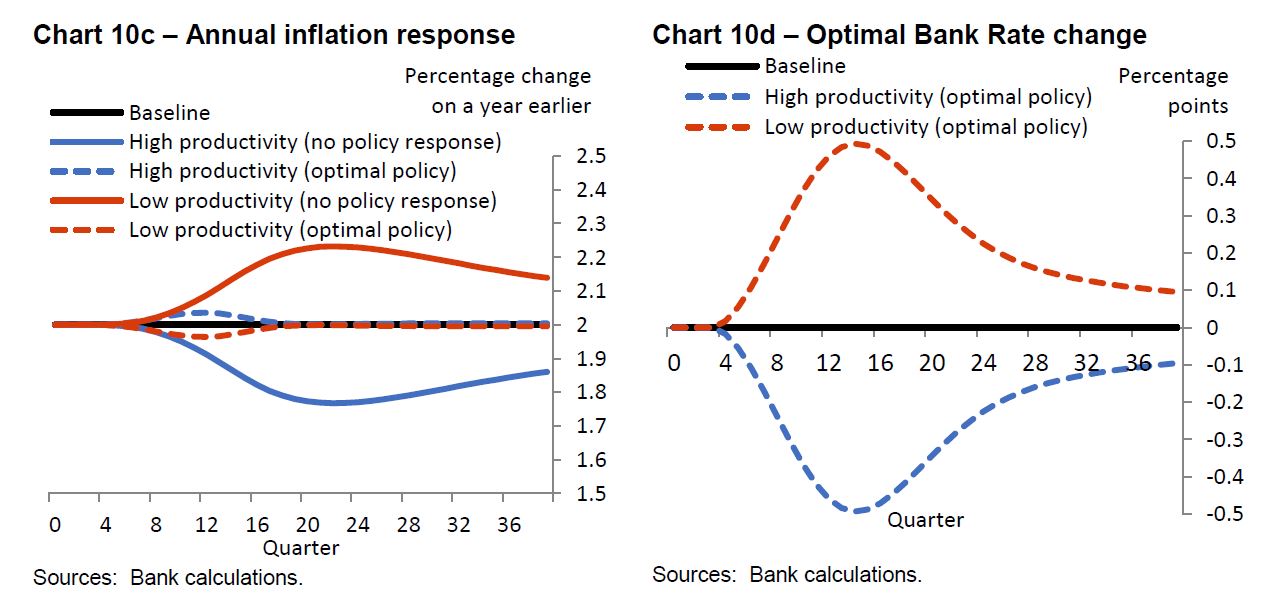
Productivity is crucial to setting monetary policy. The MPC’s remit sets out a 2% inflation target over an appropriate time horizon with the rationale that inflation stability can lay the foundations for strong and sustainable growth. Productivity growth is the key determinant of how much demand can grow without creating inflation and hence it is a critical input into our forecast and deliberations.

The blue solid lines show a scenario where a 1% growth rate for potential productivity was overly pessimistic. The blue solid lines show a scenario where a 1% growth rate for potential productivity was overly pessimistic.

Over the three decades before the global financial crisis, productivity growth averaged 2.3% per year. Productivity fell in 2008 and 2009 as the financial crisis hit, and, in the seven years since, it has only grown by an average 0.4% per year. As a result, the typical worker in 2016, while still twice as productive as the 1970s, could only produce 1% more than in 2007.

Focusing just on the past half-century, the decade since the crisis looks like an aberration. Productivity growth barely deviated from its 2% trend until 2007 (Chart 2). It is little wonder, therefore – looking at these data – that forecasters (the Bank of England included) consistently predicted that productivity growth would recover to a rate close to its 1970s-2000s average.

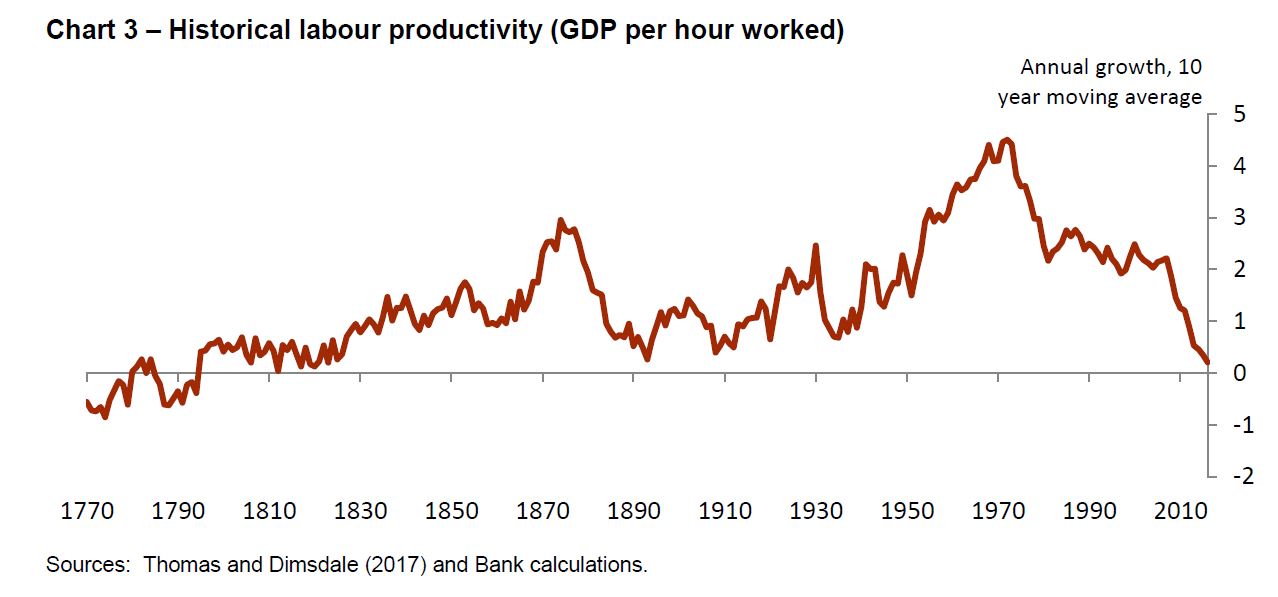
Over a longer sweep of history, the past decade is far from unusual. Chart 3 shows annual UK labour productivity growth since 1760. Prior to the 1970s, there were often large shifts in the average growth rate of productivity from one decade to the next. Depending on how you interpret the chart, that could be a good-news or a bad-news story.

The ‘glass half full’ reading might note that we have been through several temporary periods of weak productivity growth before, but have always recovered. But there is also a ‘glass half empty’ interpretation. Robert Gordon from Northwestern University has argued that the hundred years spanning from 1870 to 1970 were exceptional in the number and scope of life-changing break-through innovations and there is absolutely no reason to expect growth to be as high and broad-based now. The progress since 1970, he argues, has been concentrated in a relatively narrow part of the economy: entertainment, communication and information processing. But in other essential areas like food, clothing and shelter, progress has been much slower.

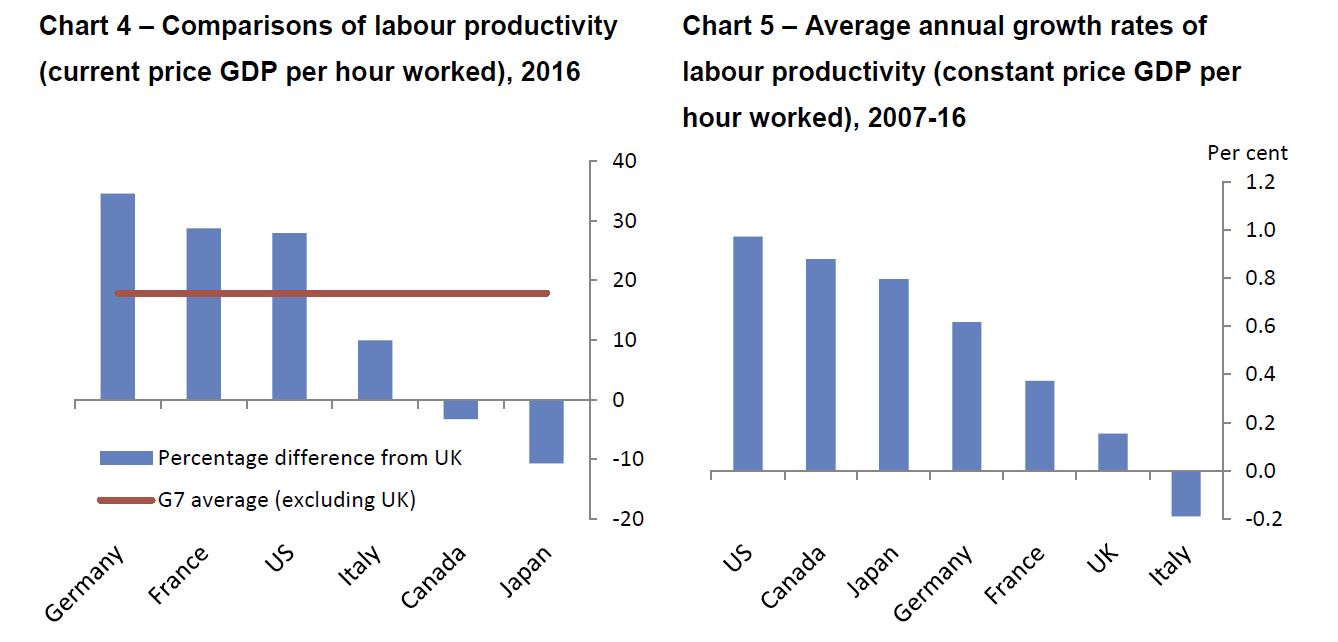
Cross-country comparisons are tricky, but the ONS estimates that compared to the UK, labour productivity is on average 18% higher in the other six members of the G7, 28% higher in the US and 35% higher in Germany (Chart 4). These are significant differences. If British workers were able to catch-up to the G7 average, what currently takes us five days’ work to produce could be done in little over four. If we were able to catch up to Germany, we might all be able to go home from work on Thursday afternoon each week without any fall in GDP.

The plots have illustrated the UK productivity slowdown, both relative to other countries and also relative to the UK’s own recent past.

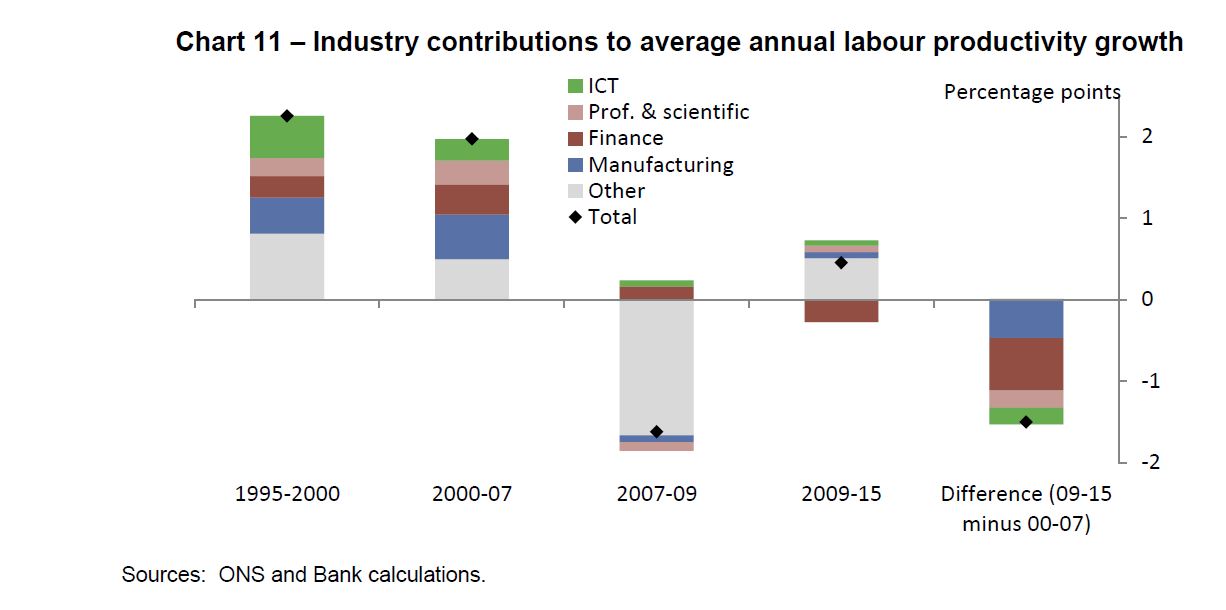
To attempt an answer, why productivity got lost, it is helpful to carry out a sectoral analysis, breaking down the productivity slowdown by industry. The sectoral distribution of productivity growth can help us locate where it has slowed. The slowdown, or difference in the aggregate productivity growth rates between the pre- and post-crisis periods for the UK economy amounted to (a negative) 1.5 percentage points. Remarkably, three-quarters of this productivity growth shortfall is accounted for by just two sectors: manufacturing and finance.

A further quarter of the slowdown is explained by two more sectors: information and communication technologies (ICT); and professional, scientific and technical services. The remaining 14 sectors contributed 0.5pp to productivity growth, both pre- and post-crisis. In other words, productivity outside those four sectors has been growing at a roughly constant, modest rate.

The finance sector is the biggest contributor to the productivity slowdown. It had the fastest-growing labour productivity of any sector in the run-up to the crisis, at 5% per year. Since 2009, productivity has actually shrunk by 2.1% per year.


It is unlikely that the entire slowdown in financial sector TFP is down to mismeasurement. A complementary explanation is that the key contributors to the crisis itself – risk illusion and increasing financial-sector leverage – may have increased (correctly measured) pre-crisis productivity growth. In doing so, they may also have sowed the seeds of the crisis and subsequent weakness. Increased leverage and higher risk tolerance boosted profits, earnings and output. That may have attracted capital and employees from other sectors of the economy. More broadly, rapid credit growth and low risk premia fed into higher asset prices, with positive spillovers to demand elsewhere in the economy. As the crisis hit, these channels went into reverse, leading to falls in wealth and higher uncertainty. Both lowered spending and output and probably also increased households’ labour supply.

Whatever the ultimate trigger of the finance-sector slowdown, its contributions to measured GDP and productivity growth are unlikely to pick up to those we saw in its pre-crisis boom. To achieve that would require a repeat of the type of unsustainable increases in leverage that we saw in the 2000s. The sector’s post-crisis performance has been as poor as its pre-crisis performance was strong. Credit and deposit growth have been weak as banks and households have sought to deleverage. It is possible that the growth of financial activities somehow crowded out the growth in the rest of the economy in a competition for talent and resources.

The financial-stability reforms we have seen since the crisis were put in place precisely to prevent the damaging consequences of those episodes.

Note: The views are not necessarily those of the Bank of England or the Monetary Policy Committee.

Credit conditions ‘the tightest they’ve been in 15 years’

From The Adviser.

Members of the industry have challenged the assertions of a professor of economics regarding the state of the current lending market and broker remuneration, with one broker stating that it’s harder than ever to get a loan.

In an opinion piece for The Australian Financial Review, a professor of economics at UNSW Business School, Richard Holden, warned that Australia is “blithely repeating” the US housing market “mistakes” that led the housing “implosion” and global financial crisis.

According to Mr Holden, there are several “markers” that point to this, including lenders that “let you borrow a lot compared to your income”, “risky” mortgage structures and, most notably, mortgage broker commissions and incentives.

The professor wrote: “A remarkable 55 per cent of all new mortgages come through a broker. And those brokers get paid based on how many dollars of home loans they write.

“Their incentives are thoroughly misaligned with both borrowers and lenders — just as was the case in the US a decade ago. There are also high-powered incentives for those originating loans with banks, creating more moral hazard.”

The claims have been dismissed by the executive director of the Finance Brokers Association of Australia (FBAA), Peter White, who told The Adviser that he believed Mr Holden’s analysis “shows absolute ignorance, to the nth degree, of what actually happened in the US. It had nothing to do with brokers. Brokers are a distribution channel. What caused the US GFC was that the wholesale corporate bond market was getting greedy on low-doc lending and then had bonds that they wouldn’t sell. It had nothing to do with brokers whatsoever.”

Mr White added that broker remuneration and incentives had been the subject of several reviews in recent years, and that the professor’s comments, therefore, “don’t make any sense whatsoever in the context of the current market”.

Touching on Mr Holden’s comments about there being a “moral hazard”, the FBAA head said: “Australia is globally known as being one of the most regulated countries in the world and it ensures that any potential risk is mitigated and looked at to ensure that there is no moral question.

“Bonus incentives have been looked at to try and remove any risks, and that is what we’ve done. These are things that were done in the past, it’s not current. So, he is not up to speed with what is happening in the current reality of the current market.

“Drawing these analogies to the US market and pointing some line to brokers and their payment and incentives is just garbage.”

Several brokers also contacted The Adviser to voice their opposition.

Credit conditions ‘the tightest they’ve been in 15 years’

Speaking to The Adviser, Smartline mortgage broker Ian Simpson said that he “deeply disagreed” with a number of Mr Holden’s assertions.

Mr Simpson said that the comparison to the US subprime market was “wrong” because low-doc lending pre-subprime in the US constituted more than half of lending and did not require verification of income, whereas Australia has less than 5 per cent low-doc loans, and it largely used alternative income verification.

He continued: “I completely refute both of the broker allegations. There has been an exhaustive review and analysis of the whole broker remuneration model etc and what they have discovered is that brokers actually have very little influence on the amount a borrower can borrow. In 99 per cent of cases, we look at a customer’s scenario, a borrower’s situation and assess income, how much deposit they have, fixed liabilities etc and work out, based on their current situation, how much they could borrow. But the amount that the client borrows is not dictated by us; it’s dictated by their situation.

“Within the broker community, I’d say that 90 per cent of brokers have a long-term concern of their clients (in every industry around 10 per cent do), because if you don’t have a concern for the long-term health and welfare of the client, you don’t actually have a business. And given all the levels of compliance and continued education and scrutiny, you’re not thinking about getting a few extra dollars in commission now at the detriment of your client. Your client needs always come first, and their best interests come first, because our business are only built on happy clients and long-term relationships.”

The Smartline broker added that the lending market, rather than being loose, was actually tighter now than he had seen it for more than a decade.

“Australian lending standards are probably the tightest lending standards that I have seen in my 15 years of being a broker,” Mr Simpson said.

“I’ve never seen such a gargantuan gap between interest rates and servicing rates, but that is not necessarily a bad thing. Borrowing money is hard. Banks are asking more questions than they ever used to ask — it’s a daily challenge getting loans approved.

“Credit conditions are tight, the tightest I have seen them ever. And now with the Royal commission, banks are going to be asking more and more questions, not less and less.

“So, from a remuneration point of view, we’re working as hard as we ever had for our money. And from a systemic point of view, the market is healthy, and if the regulators weren’t, there then the housing market would be putting the financial system at risk.

“Just because the US housing market went up and then had an almighty housing crash does not mean that we are going to have one here in Australia. I don’t believe that at all, considering the house price growth in the last 12 months has risen [by] 3 per cent. That’s hardly a market out of control.”

More lenders to change their commission models

From Australian Broker.

Other lenders are expected to amend their remuneration structures following ANZ’s changes to its upfront commission model, with major banks to lead the way.

ANZ will pay brokers an upfront commission of 62.5 basis points effective 1 February 2018, up from the current 57.5 basis points.

Under the new structure, ANZ will no longer give brokers volume-based incentives, following the Combined Industry Forum’s proposal to stop the payment of volume-based bonus commissions and campaign-based commissions in response to the ASIC and Sedgwick reviews.

ANZ’s trail commission structure remains the same.

While ANZ is ahead of the curve, other lenders are likely also re-examining their own broker remuneration models in the wake of the CIF reforms.

“It’s indicative of what’s going to happen – the pressure as a result of the ASIC inquiry to remove soft benefits and incentives, particularly volume-based incentives,” said Martin North, principal at Digital Finance Analytics.

He believes the change in ANZ’s upfront commission model is a good move because it streamlines the structure and makes it clearer.

“The problem with volume incentives and soft benefits is that they raise complexity and confusion in the minds of potential consumers, on whether they are getting the best advice they could get and whether the advice is in some way being influenced by financial incentives. Anything that can be done to remove that ambiguity is a good thing,” he said.

While some brokers believe it is still too early to tell how further changes to broker commission will affect their business, they welcome such changes if they will help improve customer experience.

“Ultimately, if the reforms help deliver better customer outcomes, then that is a good thing,” said John Flavell, CEO of Mortgage Choice.

David Meadows, client services manager at Astute Financial, said further regulatory reviews and changes to remuneration structures will affect profitability, but that such changes are not entirely bad. “Increased regulatory reviews are happening across the financial services industry,” he said. “We are not the only ones going through them.”

For now, ANZ’s tweaking of its commission system is not believed to be a disincentive for brokers. It in fact represents a slight increase in broker commission, said North.

“My understanding is that not very many brokers would have gotten the higher commission previously because it was volume-incentivised.”

The UK’s “Open Banking” Initiative Went Live Last Saturday

Open Banking, where customers can elect to share their banking transaction information with third parties went live in the UK.

This initiative is designed to lift completion across financial services, and of course in Australia, there are early moves in this direction, though the shape of those here are not yet clear. An issues paper from August 2017 outlines the questions being considered by the Australian Review into Open Banking.

What data should be shared, and between whom?

How should data be shared?

How to ensure shared data is kept secure and privacy is respected?

What regulatory framework is needed to give effect to and administer the regime?

Implementation – timelines, roadmap, costs


The report was due to report end 2017.  So the UK experience is useful.

In essence, consumers (if they choose to) are able to give access to the data on their bank accounts to selected third parties, which allows them potentially to offer new and differentiated banking and financial services products.  In practice, whilst some firms rely on simple (and risky) “screen scraping” the idea is that banks will provide a standard application programme interface (API) to allow selected third parties to access agreed data.  Screen scraping is based on sharing the standard internet banking password and credentials, whilst API’s are more selective, using special passwords, which can time-limit access. This is more secure.

In addition, customers give access by logging on to their bank account, and establishing the data share from there, so again is more secure. Also, in the UK, firms wanting to access the data must be registered, and will be listed on an FCA directory. This is to avoid fraud. In addition, there is some protection for consumers if validly shared credential are misused, unlike the current state of play, where if banking passwords are shared, banks may avoid liability.

It is too soon to know whether this is truly a banking revolution, or something more incremental, but in the light of the emerging Fintech wave, we think the opportunities could be large, and the impact disruptive.

For example, Moody’s says the UK’s Open Banking initiative is credit positive for consumer securitisations.

By directly accessing current accounts, the lenders will gain valuable data about its customers’ disposable income and spending patterns. This data will complement the less detailed data that credit reference agencies provide and will result in stronger underwriting and better risk-adjusted returns when prudently applied.

The improved access to information also will benefit the debt collection process. Data on disposable income provides a realistic picture of a consumer’s debt repayment patterns. A clearer picture of consumers’ repayment patterns increases the probability of successful debt collection while ensuring compliance with the UK’s Financial Conduct Authority’s guidelines on fair treatment of customers.

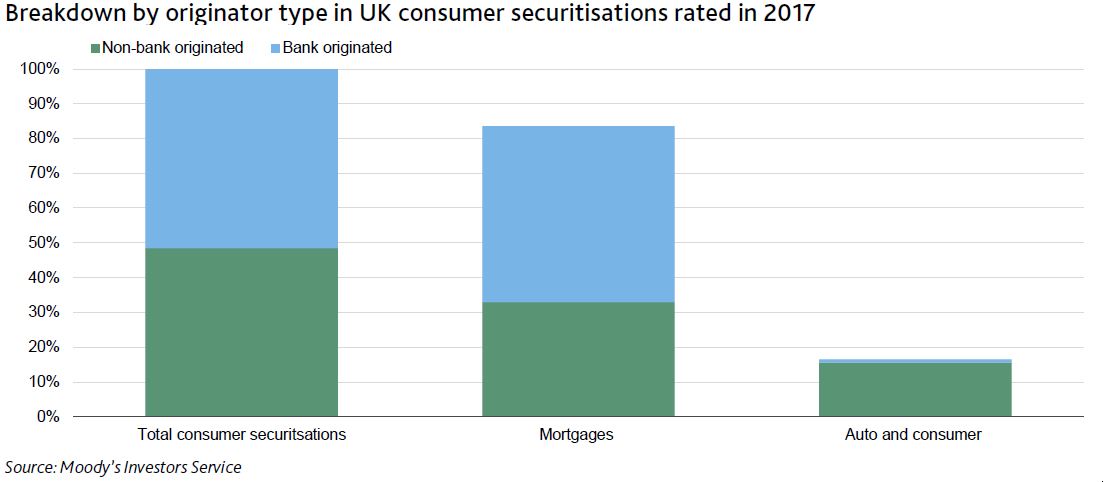
Of the approximately £32 billion of UK consumer securitisations that we publicly rated in 2017, around half were backed by pools solely originated by non-banks. The exhibit below shows that auto and consumer pools, which will benefit most from improved underwriting, are almost entirely originated by non-banks lenders. We include auto-captive bank lenders in the non-bank category since they do not have a material current account presence.

The nine banks with the largest current accounts market share in the UK that will be obliged to share their data are Allied Irish Banks, Bank of Ireland (UK), Barclays Bank , Danske Bank, HSBC Bank, Lloyds Bank, Nationwide Building Society, The Royal Bank of Scotland and Santander UK plc. Four of the nine banks have been granted an extension of six weeks and the Bank of Ireland has until September to meet the technical requirements.

There is an initial six weeks trial during which only bank staff and third parties will be able to test new services.

Moody’s also notes that “the Open Banking requirements coincide with the European Union’s (EU) Second Payment Services Directive (PSD2), which requires all payment account providers across the EU to provide third-party access. For as long as the UK remains part of the EU, it will need to comply with the EU’s legal framework. However, the regulatory technical standards on customer authentication and secure communication under PSD2 have yet to be agreed, meaning that full data sharing under PSD2 likely will be applied no earlier than third-quarter 2019”.

The Game Is Up – The Property Imperative Weekly 13 Jan 2018

The game is up. Major changes are rippling through the property market, with continued pressure on many households, so we examine the latest data.

Welcome to the Property Imperative weekly to 13 January 2018. Watch the video or read the transcript.

In this week’s review of the latest finance and property news, we start with the AFG Mortgage Index with data to December 2017. While the view is myopic (as its only their data) it is useful and really highlights some of the transitions underway in the industry.  First, there has been an astonishing drop in the number of interest only loans being written, from 60% of volume in 2015, to 20% now – WOW! We also see a small rise in first time buyer volumes, as expected. So the regulatory intervention is having some impact. However, average loans size is rising (and faster than income and inflation), and Victoria stands out as the state to watch with an increase in average loan size over the past 12 months nearly double the size of the increase in New South Wales. So more still needs to be done on the regulatory front. Overall, the national average loan size is up 2.8% over the past 12 months. The average loan size in New South Wales is now $613,084. Queensland has increased by 3.4% to now be sitting at $416,921. South Australia is up 3.4% to $390,706. The Northern Territory is up 22% to $469,502, albeit from a low volume. Reflecting the challenges being encountered by the WA economy, the state’s average loan size is down 1.1% to $439,944. Finally, the share of the major’s banks is falling, as we have seen from other data, as smaller players and non-banks pick up the slack. The majors now have just 64.2% of the market compared to the non-majors sitting at 35.8%.

There is more evidence of poor mortgage lending practice, according to online property lender Tic:Toc Home Loans as reported in The Australian Financial Review. This is another version of the ‘liar loans’ story, and shows that borrowers are more stretched than some lenders suspect. Tic:Toc says, one in five property borrowers are exaggerating their income and nearly half understating their spending, triggering new concerns about underwriting standards and vulnerability to sharp economic corrections. We see similar issues in our own surveys, as households stretch to get the largest mortgage they can, whatever the cost, and whatever the risk.

APRA  released the final version of the revised reporting requirements for residential mortgage lending. It comes into effect from March and lenders will have to report more fully, including data on gross income, (excluding super contributions), new reporting on self-managed superannuation funds (SMSFs) and non-residents, as well as all family trusts holding residential mortgages. Reporting of refinanced loans should include date of refinance (not original funding date) and APRA says the original purpose of the loan is not relevant to reporting when refinanced. Once again we see APRA in catch-up mode trying to get the data to manage the mortgage lending sector more effectively. We think they have been late to the party, and have much to do.

The chairman of the Australian Competition and Consumer Commission has revealed that there will be some “surprises” in the upcoming draft report into how the banks price residential mortgage products. The inquiry into how the major banks price their mortgage is the first undertaking of the ACCC’s new Financial Sector Competition Unit, which is tasked with undertaking regular inquiries into specific competition issues across the financial sector. Starting with the $1.2 million inquiry into residential mortgage product pricing, the ACCC is aiming to understand how the banks affected by the major bank levy explain any changes or proposed changes to fees, charges or interest rates in relation to residential mortgage products. The inquiry relates to prices charged until 30 June 2018. A draft report will be published in February or March. This will be an important piece of work especially, as the corporate watchdog has also previously warned that the big banks could be in breach of the ASIC Act over the reasons given for hiking interest rates.

Turning to broader economic news, The November data from the ABS shows that Australian retail turnover rose 1.2 per cent in November 2017, seasonally adjusted, with Black Friday and iPhone X sales driving the outcome This follows a 0.5 per cent rise in October 2017. Some will spruke this as a positive sign. However, the more reliable trends are less positive, with the estimate for retail turnover up 0.1 per cent in November 2017 the same as October 2017. This is just 1.7 per cent over that past year, so still weak, reflecting stagnant wage growth, rising costs and high levels of debt. The state trend data showed NSW, ACT and QLD had no change, NT fell 0.2% along with WA, while VIC rose 0.3% and SA 0.4%, and TAS rose 0.2%. Online retail turnover was a new record at 5.5 per cent of total retail turnover. But the key takeaway is that households are continuing to keep their wallets firmly in their pockets.

The latest ANZ Job Ads series for December in seasonally adjusted terms, fell 2.3% largely unwinding the increase over the previous two months. On an annual basis job ads are up 11.4%, a slight moderation from 12.0% y/y growth the previous month. The labour market in 2017 was characterised by widespread job growth (particularly in full time jobs), an increase in participation and a fall in the unemployment rate to a four-year low of 5.4%. Growth in ANZ Job Ads provided a leading signal of this strong performance. But of course this has not been converted to rising wages growth so far.

The Building Approvals data from the ABS was much stronger than expected, with the number of dwellings approved up 0.9 per cent in November 2017, in trend terms, and has risen for 10 months. The strong results were driven by renewed strength in approvals for apartments. Approvals for private sector houses fell 0.1 per cent in November. Private sector house approvals fell in Western Australia (3.3 per cent), New South Wales (0.8 per cent) and Queensland (0.4 per cent), but rose in South Australia (1.3 per cent) and Victoria (1.1 per cent).

Consumer Confidence was stronger in the first week of January according to the ANZ/Roy Morgan index, which jumped 4.7% to 122 last week, leaving it at the highest level since late 2013. It often jumps after Christmas, and perhaps the holidays and ashes victory are colouring perspectives. Certainly, it makes an interesting contrast to our own Household Financial Security Index, which we released this week, based on December 2017 survey data. The latest edition of the Digital Finance Analytics Household Financial Security Confidence Index, fell from 96.1 last month to 95.7 this time, and remains below the neutral measure of 100. You can watch our video where we discuss the research.

Analysis of households by their property owning status reveals that property investors are in particular turning sour, as flat net rental incomes, and rising interest rates hit many, at a time when property capital growth is stalling. Owner occupied households are faring a little better, thanks to a range of ultra-cheap mortgage rates on offer at the moment, but they are also concerned about price momentum. Those without property interests remain the least confident, as the costs of renting outstrip income growth, and more are slipping into rental stress.

More questions came out this week, when The ABC is reporting that a Treasury  FOI request has shown that Federal Labor’s negative gearing overhaul would likely have a “small” impact on home values, official documents reveal, contradicting Government claims the policy would “smash” Australia’s housing market. The previously confidential advice to Treasurer Scott Morrison from his own department said the Opposition’s plan might cause “some downward pressure” and could have “a relatively modest downward impact” on prices. This is further evidence that tackling negative gearing should be a strategic priority to help bring our housing market back to reality.

There is also a blind spot at the heart of macroeconomics according to Claudio Borio Head of the BIS Monetary and Economic Department – the BIS is the Central Bankers Banker. He argues that a core assumption implicit in policy setting is that macroeconomics can treat the economy as if it produced a single good through a single firm. The net effect of this assumption is to drag down interest rates and productivity. The truth is much more complex, and within the economy there are “zombie firms” where resources are effectively misallocated, leading to reduced productivity and lower than expected economic outcomes, which will cast a long shadow through the economic cycle. The bottom line is first, credit booms tend to undermine productivity growth as they occur and second, the subsequent impact of the labour reallocations that occur during a financial boom is much larger if a banking crisis follows. This may also help to explain the current gap between employment and wages growth.

Finally, if you want more evidence of the risks in the system look at the RBA chart pack which was released this week. You can watch our video on this, but first, relative to the ultra-low cash rate, actual mortgage rates are rising – no surprise given the rise in mortgage stress we are registering. Next, home loan approvals are on the slide – expect more of this as tighter underwriting standards bite, and many interest only borrowers are forced to switch to higher cost interest and principal loans. Home price indices are trending lower (but still net positive growth overall at the moment). Expect more falls in the months ahead. Household debt continues higher. Now double disposable income, and we have some of the most highly in debt households in the world. Lending growth is still three times income, so this is likely to continue higher. All this is bearing down on household consumption as real income growth stalls. The savings ratio is falling, as households tap these to prop up their finances, OK in the short term, but unsustainable longer term.

In summary, UNSW’s Professor Richard Holden wrote that troubling borrowing and lending markers in the Australian housing market suggest that the lessons from the US mortgage meltdown have not been learned. He rightly draws comparisons with the USA, as we discussed in last week’s Property Imperative, with loose lending standards, a high penetration of interest only loans, many of which will need to be refinanced to higher rate principal and interest loans down the track, and liar loans. Plus, there are questions about where borrowers are getting their deposits from (even drawing from credit cards or borrowing from the Bank of Mum and Dad), and while more loans are originated via brokers, he suggests the banks are myopic to the risks in their portfolio.  He says we are still left with highly indebted households who have nearly $2 of debt for every $1 of GDP, a raft of interest-only loans that will soon involve principal repayments, and stagnant wage growth, and concludes “Having lived in the US during the mortgage meltdown I’m sorry to say that I’ve seen this movie before. The question is: why haven’t our bankers?” I would add, our Regulators should answer the same question. We are on the brink; the game is up!

And that’s the Property Imperative weekly to 13 January 2018. If you found this useful, do like the post, add a comment, or subscribe to receive future updates. In the past week our YouTube Channel followers have grown by a third, so thanks to all those who joined and the comments you left.  We are busy collecting questions for our next Q&A session, so keep a look out for that.

Meantime, we will be back with more insights in the next few days, and many thanks for taking the time to watch.

ANZ Confirms UDC sale to HNA is not proceeding

ANZ today announced the agreement to sell UDC Finance to HNA Group will not proceed as the agreement with HNA has now been terminated in accordance with the contracted timeframe.

This follows the 21 December 2017 announcement that New Zealand’s Overseas Investment Office had declined HNA Group’s application to acquire UDC Finance.

ANZ Group Executive and New Zealand CEO David Hisco said: “Following the termination of the agreement with HNA, we’ll continue to assess our strategic options regarding the future of UDC, although there is no immediate requirement to do anything.

“It will be business as usual for staff and customers. UDC continues to be a very profitable business with a strong capital position and a growing loan portfolio across a range of industries.

“Its focus remains on its core business of financing vehicles and equipment for people and companies across New Zealand,” Mr Hisco said.

Global lender selects Aussie fintech, Trade Ledger, as worldwide technology partner

Zürich-based lender, TradePlus24, has selected Australian deep tech startup, Trade Ledger, as its global technology partner to roll out its new trade insurance wrapped lending product across their European lending network, and enter the Australian market.

TradePlus24, backed by Credit-Suisse, chose Trade Ledger because its platform not only automates the entire credit assessment process, allowing for rapid scale, but because it can also assess SME supply chain data in real-time while calculating risk down to the individual invoice in real-time – two things no other lending tech can currently do.

“A major problem for banks and other lenders across the globe is the cost, effort, and perceived higher risk of loan origination in the SME sector in particular,” said Martin McCann, CEO and Co-Founder of Trade Ledger.

“This sector has long been plagued by outdated credit assessment technologies that prevent lenders from easily or cost-effectively acquiring real-time information about persistent risk, individual transactions, or trade document updates.

“The result is enormous uncertainty, leading lenders to either applying a premium, or avoiding lending to individual SMEs altogether. According to PWC’s recently released report, the Australian SME working capital gap is more than $90 billion as a result – though this is on the low side of our estimates.

“By removing these technical limitations around documentary trade processes, and completely automating the credit process, lenders can significantly reduce the cost of loan origination, completely eliminate certain types of risk and fraud, and rapidly increase the volume of their loan book – all without adding extra staff,” continued Martin McCann.

“We are extremely excited to partner with TradePlus24 because we feel their secured global receivables financing solution is unmatched in the Australian market, and allows SMEs and mid-market companies to leverage their domestic and export accounts receivables in a completely new and unique way.

“We believe this makes them one of the most advanced SME lending products in the world, so we’re extremely proud to assist in bringing such a quality product to the local market,” concluded Martin McCann.

The Trade Ledger platform will facilitate TradePlus24’s entrance into Australia, which is a market deemed highly attractive because of its historically high margins and minimal competition from global players.

TradePlus24 expects to select a local Australian banking partner, but wanted a “born global” solution for its technology needs, to automate and manage its entire global operation spanning Europe, Asia, and Australasia, all on one advanced platform.

“To realise our growth ambitions, it was imperative to find a comprehensive technology solution that could be seamlessly applied across our entire global value chain,” said Ben James, CEO of TradePlus24.

“We believe the future of lending is not with slow-moving lenders employing legacy technologies, rather with strategic technology partnerships that give lenders a competitive edge by cracking the SME working capital market.

“It’s our opinion that the Trade Ledger platform is the key to cracking this market for us,” concluded Ben James.

For more information on Trade Ledger: www.tradeledger.io and TradePlus24:www.tradeplus24.ch/index.php/en/