The latest update on bank reform has revealed the slow and varying progress made by banks in changing broker commissions.
Ian McPhee’s report, commissioned by, but independent of the Australian Bankers Association, asked banks how far they had implemented the Sedgwick Review’s recommendations. Stephen Sedgwick called for an end to volume-based incentives and for banks to ensure remuneration was not directly linked to loan size.
Macquarie Bank, My State Bank, and Bank Australia were amongst the furthest ahead banks, with ‘substantial alignment’ of their broker remuneration to Sedgwick’s recommendation. Only Qudos Bank was fully aligned with the recommendations.
Conversely, Commonwealth Bank’s broker remuneration and governance arrangements were ‘not aligned – planning and/or some implementation progressed’. Work on reforming remuneration had not started at Bank of Queensland, and work reforming governance had not begun at Bank of Sydney.
Of the other majors, ANZ, NAB, and Westpac reported partial implementation of Sedgwick’s reforms.
An imperfect scorecard
McPhee himself notes that “it is not appropriate to draw early conclusions on the status of individual banks’ implementation programs.”
For a start, banks self-reported their own progress with minimal oversight from McPhee. Furthermore, banks’ reporting cycles vary; a bank that reports at the end of the financial year may appear further advanced than a bank that reports at the end of the calendar year, for instance.
According to McPhee “the Sedgwick Review recommendations relating to banks’ arrangements with third parties are least progressed, with a number of banks reporting that they are still in the planning phases. This reflects the time taken to establish the Combined Industry Forum and agree industry-wide responses.”
The Combined Industry Forum set out its changes to remuneration in December.
NAB says that appetite for equity investing among Australian Self-Managed Super Fund (SMSF) investors surged in 2017, with international shares, domestic exchange traded funds, mFunds and partially paid shares the top new investment picks for investors.
The nabtrade data, which looked at the equity trading patterns of SMSFs in the 12 months to 15 December, showed this group of investors had almost tripled their investment in mFunds, and raised their holdings in ETFs and partially paid shares by 55 per cent and 51 per cent respectively.
Preference shares were equally popular with SMSF investors, with holdings up 34 per cent. Traditional equity holdings were also solid, up 13.5 per cent, while SMSFs retreated from investing in floating rate notes and options over the same period.
NAB Director of SMSF and Customer Behaviour, Gemma Dale, said SMSF investors were overall very active in equity markets in 2017, with total portfolios up more than 15 per cent on the previous year.
“The analysis shows that investors are getting comfortable with the more exotic equity instruments in the market and are prepared to spread risk. Low levels of volatility and the strong performance of domestic and international markets gave investors’ confidence to look for new opportunities,’’ Ms Dale said.
“As with previous years, financials and materials were the most heavily traded sectors, accounting for 36 per cent and 17 per cent of the turnover in 2017. NAB, Commonwealth Bank and Telstra were the most traded stocks in 2017.
“Telecommunication services, healthcare and consumer discretionary stocks were also popular among investors.”
The data also showed SMSF investors are also getting more confident in international equity investing and prepared to take bets on new and innovative sectors such as robotics and aerospace using ETFs.
“International trading surged nearly 100 per cent over the previous year, with US equities and US ETF’s the most traded equity instruments on international markets throughout the year,’’ Ms Dale said.
‘’Like retail investors, SMSF investors are turning to offshore markets to diversify their portfolios and to access high growth sectors in the US.’’
Most popular equity investments by SMSF Investors in 2017 Top Ten Domestic Equity instruments in 2017
NATIONAL AUSTRALIA BANK. Ordinary Fully Paid
COMMONWEALTH BANK OF AUSTRALIA. Ordinary Fully Paid
WESTPAC BANKING CORPORATION. Ordinary Fully Paid
AUSTRALIA AND NEW ZEALAND BANKING GROUP. Ordinary Fully Paid
TELSTRA CORPORATION. Ordinary Fully Paid
BHP BILLITON. Ordinary Fully Paid
WESFARMERS. Ordinary Fully Paid
CSL. Ordinary Fully Paid
WOOLWORTHS GROUP. Ordinary Fully Paid
WOODSIDE PETROLEUM. Ordinary Fully Paid
Source: nabtrade
Top Ten International Equity instruments in 2017
AMAZON COM ORD Common Stock
APPLE ORD Common Stock
FACEBOOK CL A ORD Common Stock
ALIBABA GROUP HOLDING ADR REP 1 ORD Depositary Receipt
ENPHASE ENERGY ORD Common Stock
TENCENT ORD Common Stock
TESLA ORD Common Stock
NVIDIA ORD Common Stock
MICROSOFT ORD Common Stock
BANK OF AMERICA ORD Common Stock
Source: nabtrade
Calls to reduce the current regulatory restrictions, for example on investor and interest only loans, will probably fall on deaf ears. Last year, the Bank of England confirmed that its own version of APRA lending curbs will become a “structural feature” of the British housing market, forcing Australian economists to begin questioning whether APRA’s macro-prudential measures could be permanent. This from the excellent James Mitchell via The Adviser.
A leading mortgage professional has criticised the prudential regulator for not providing a clear time frame for its macro-prudential measures or explaining what it is ultimately looking to achieve.
Speaking to The Adviser on a recent Elite Broker podcast, Intuitive Finance managing director Andrew Mirams said that he can’t see the complexities in the mortgage market easing up “anytime soon”.
Australian banks are still required to limit their investor mortgage growth to 10 per cent, while interest-only loans can only account for 30 per cent of new lending.
“Late last year, [APRA chairman] Wayne Byres came out and said these are all temporary measures,” Mr Mirams said. “But he’s never articulated to anyone about how temporary or what measures might change in the future or what their actual outcome.
“I think a lot of the things they’ve done, they’ve got right. An investor getting a 97 per cent interest-only loan just didn’t make sense. You’re just putting people at risk should the markets move, and we all know markets move at different times.
“But they haven’t articulated what they were trying to achieve, what sort of timeline and what outcomes they are hoping to get. I think that would help all of us manage client expectations. Because all of us will have lots of clients that are getting frustrated with being told ‘no’. And you can’t really give them an outcome of what or when they might be able to move again.”
In October last year, Mr Byres spoke at the Customer Owned Banking Convention in Brisbane, where he indicated that the regulator would like to start scaling back its intervention, provided that banks can continue to lend responsibly.
“We would ideally like to start to step back from the degree of intervention we are exercising today,” Mr Byres said.
“Quantitative benchmarks, such as that on investor lending growth, have served a useful purpose but were always intended as temporary measures. That remains our intent, but for those of you who chafe at the constraint, their removal will require us to be comfortable that the industry’s serviceability standards have been sufficiently improved and — crucially — will be sustained.”
Macro-prudential measures are a relatively new instrument but have becoming increasingly popular across the globe. In addition to Australia, lending curbs are also being used in the UK, New Zealand and Hong Kong.
Last year, the Bank of England confirmed that its own version of APRA lending curbs will become a “structural feature” of the British housing market, forcing Australian economists to begin questioning whether APRA’s macro-prudential measures could be permanent.
AMP Capital chief economist Shane Oliver believes that APRA’s measures, or at least some of them, will become permanent.
“I suspect that, as time goes by, they will likely become a permanent feature because of the control over risky behaviour that they allow over and above that achieved by varying interest rates and because the regulatory framework necessary to administer them will become more entrenched,” Mr Oliver said.
Mr Oliver believes that APRA’s mortgage curbs may be seen as increasingly attractive from a social policy perspective, in that they can “tilt lending away from non-first home owner-occupiers”.
There are other reasons why APRA’s measures are likely to remain.
“Poor affordability and high household debt levels, neither of which are likely to go away quickly,” Mr Oliver said.
The ATO published the latest data on Self-managed superannuation funds to 2016. The number and balance of funds continues to grow and contributions are growing faster than to retail or industry funds. More property is held and under limited recourse borrowing arrangement.
In 2015–16, estimated average return on assets for SMSFs was positive (2.9%), a decrease from the estimated returns in 2014–15 (6.0%). This was the same as the investment performance for APRA funds of more than four members (2.9%) and remains consistent with the trend for APRA funds over the five years to 2016.
We also see a rise in property investment within SMSFs, with 7% of SMSFs reported $25.4 billion assets held under limited recourse borrowing arrangement (LRBAs), which is slightly higher than in 2015 (6%). The majority of these funds held LRBA investments in residential real property and non-residential real property.
The estimated average total expense ratio of SMSFs in 2016 was 1.21% and the average total expenses value was $13,700. This would be lower than the typical costs in a retail fund.
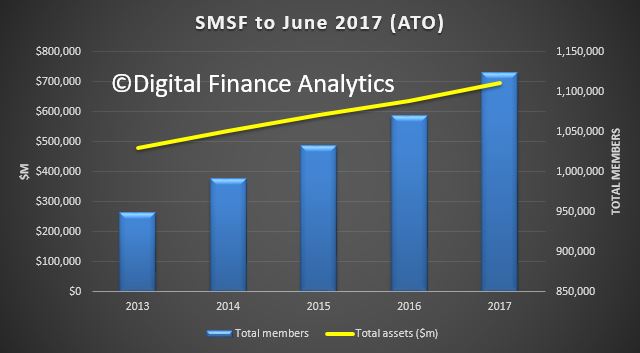
SMSF’s make up 30% of all superannuation assets which in total are worth $2.3 billion. There were 597,000 SMSFs holding $697 billion in assets, with more than 1.1 million SMSF members as at 30 June 2017. Over the five years to 30 June 2017, growth in the number of SMSFs averaged almost 5% annually.
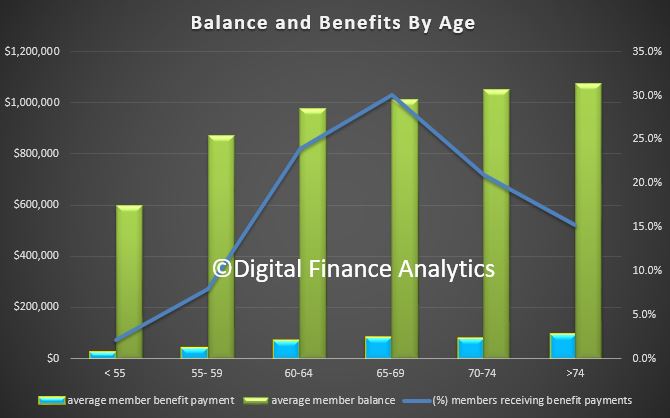
At 30 June 2016 the average SMSF member balance was $599,000 and the median balance was $362,000, an increase of 26% and 32% respectively over the five years to 2016.
The average member balances for female and male members were $511,000 and $641,000 respectively. The female average member balance increased by 30% over the five-year period, while the male average member balance increased by 22% over the same period.
Over the five years to 2016, the proportion of members with balances of $200,000 or less decreased from 42% to 32% of all members.
In 2016, the majority of members had balances of between $200,001 and $1 million.
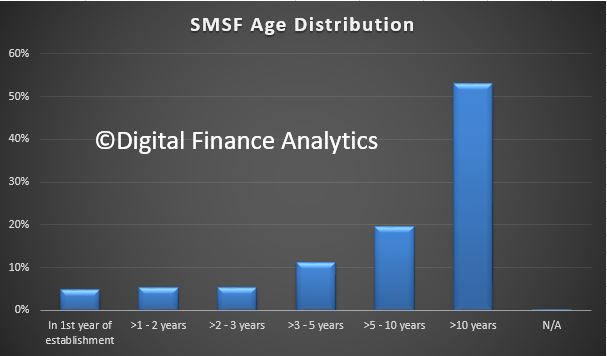
53% of SMSFs have been established for more than 10 years, and 16% have been established for three years or less.
For the 2015–16 income year, the average assets of SMSFs were just over $1.1 million, a growth of 25% over five years and 3% from 2015. Total contributions to SMSFs increased by 21% over the five years to 2016. This is significantly higher than the growth of total contributions to all superannuation funds (16%) over the same period. The majority of SMSFs continued to be solely in the accumulation phase (53%) with the remaining 47% making pension payments to some of or all members.
At 30 June 2017, 57% of all SMSFs had a corporate trustee rather than individual trustees.
Of newly registered SMSFs in 2015 to 2017, on average 81% were established with a corporate trustee.
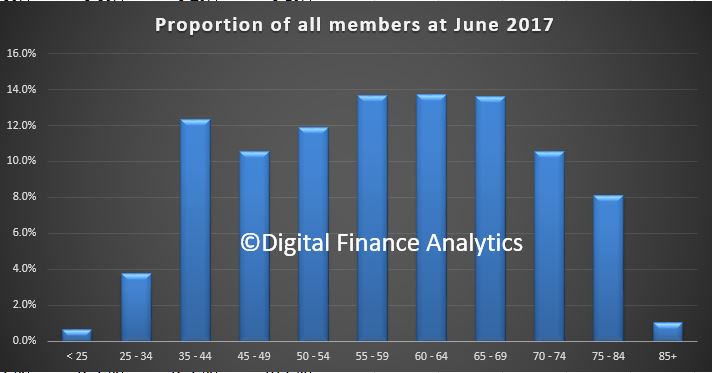
At 30 June 2017 there were 1.1 million SMSF members, of whom 53% were male and 47% female.
The trend continued for members of new SMSFs to be from younger age groups. The median age of SMSF members of newly established funds in 2016 was 47 years, compared to 59 years for all SMSF members as at 30 June 2017.
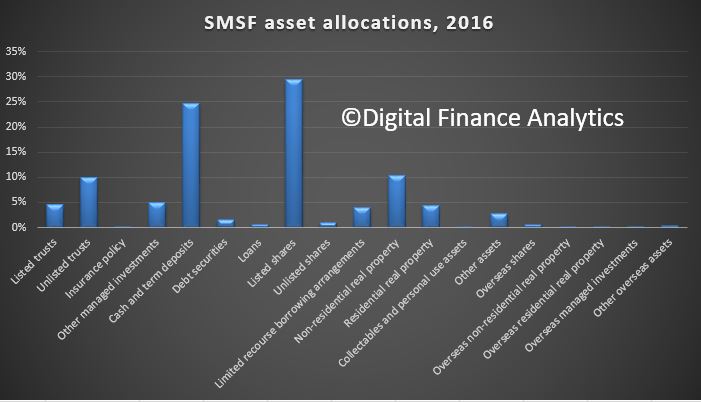
SMSFs directly invested 80% of their assets, mainly in cash and term deposits and Australian-listed shares (a total of 54%).
In the five years to 2016, cash and term deposits decreased (by 7%) to 25% of total SMSF assets.
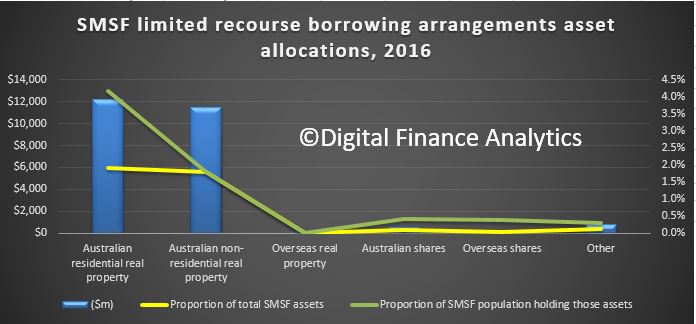
In 2016, 7% of SMSFs reported $25.4 billion assets held under Limited recourse borrowing arrangement (LRBAs), which is slightly higher than in 2015 (6%). The majority of these funds held LRBA investments in residential real property and non-residential real property. In terms of value, real property assets held under LRBAs collectively made up 93% or $23.7 billion of all SMSF LRBA asset holdings in 2016.
The estimated average total expense ratio of SMSFs in 2016 was 1.21% and the average total expenses value was $13,700.
The average ‘investment expense’ and ‘administration and operating expense’ ratios were consistent at 0.65% and 0.56% respectively.
Lenders are facing a dilemma, do they chase mortgage lending growth, and embed more risks into their portfolios, or accept the consequences of lower growth and returns as household debt explodes and we join the 200% Club!
Welcome to the Property Imperative weekly to 20 January 2018. We offer two versions of the update, the first a free form summary edition in response to requests from members of our community:
Alternatively, you can watch our more detailed version, with lots of numbers and charts, which some may find overwhelming, but was the original intent of the DFA Blog – getting behind the numbers.
Tell us which you prefer. You can watch the video, or read the transcript.
In our latest digest of finance and property news, we start with news from the ABS who revised housing debt upward, to include mortgage borrowing within Superannuation, so total Household Liabilities have been increased by approximately 3% to $2,466bn. The change, which required the accurate measurement of property investment by self-managed superannuation funds, brought the figure up from 194 per cent so we are now at 200% of income. A record which no-one should be proud of. It also again highlights the risks in the system. Australian households are in the 200% club.
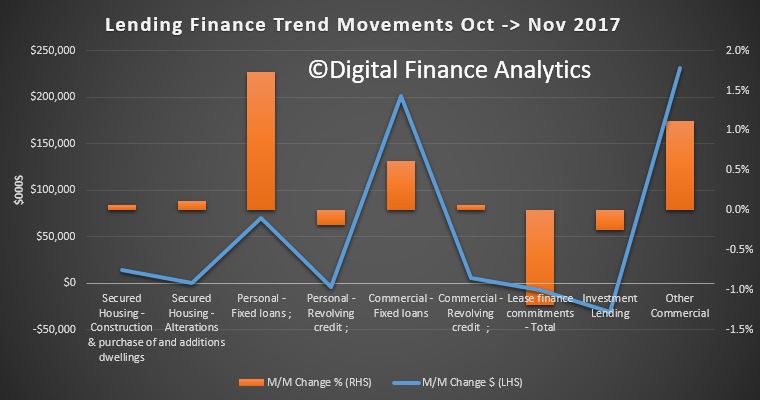
The final set of data from the ABS – Lending Finance to November 2017 which also highlights again the changes underway in the property sector. Within the housing series, owner occupied lending for construction fell 0.88% compared with the previous month, down $17m; lending for the purchase of new dwellings rose 0.25%, up $3m; and loans for purchase of existing dwellings rose 0.11%, up $12m.
Refinance of existing owner occupied dwellings rose 0.28%, up $16m.
Looking at investors, borrowing for new investment construction rose 5%, up $65m; while purchase of existing property by investors fell $74m for individuals, down 0.75%; and for other investors, down $21m or 2.28%.
Overall there was a fall of $16m across all categories.
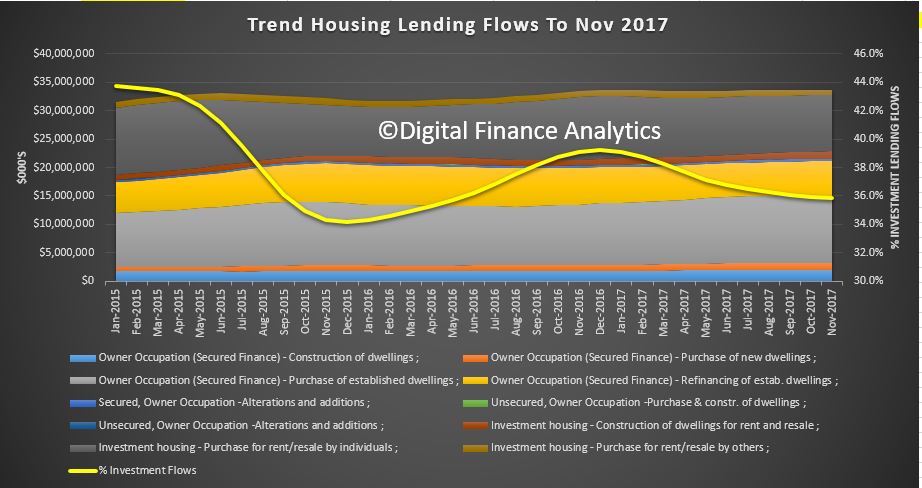
We see a fall in investment lending overall, but it is still 36% of new lending flows, so hardly a startling decline. Those calling for weakening of credit lending rules to support home price growth would do well to reflect that 36% is a big number – double that identified as risky by the Bank of England, who became twitchy at 16%!
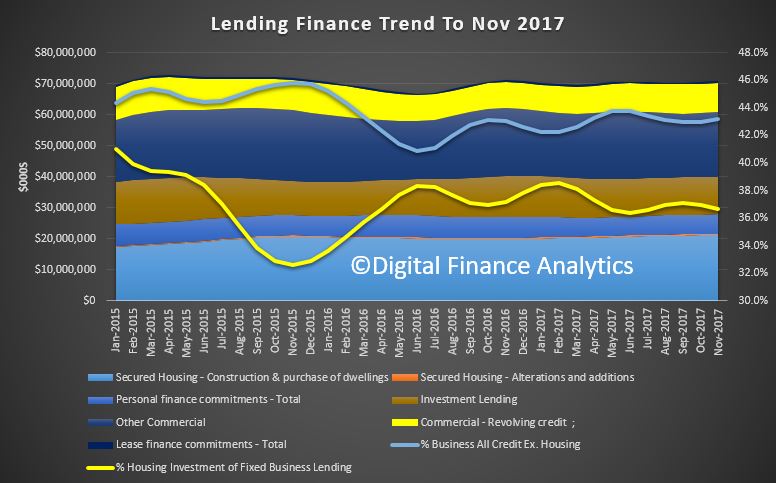
Looking then across all lending categories, personal fixed credit (personal loans rose $70m, up 1.74%; while revolving credit (credit cards) fell $4m down 0.18%. Fixed commercial lending, other than for property investment rose $231m or 1.12%; while lending for investment purposes fell 0.25% or $30m. The share of fixed business lending for housing investment fell to 36.7% of business lending flows, compared with 41% in 2015. Revolving business credit rose $6m up 0.06%.
A highlight was the rise in first time buyer owner occupied loans, up by around 1,030 on the prior month, as buyers reacted to the incentives available, and attractor rates. This equates to 18% of all transactions. Non-first time buyers fell 0.5%. The average first time buyer loan rose again to $327,000, up 1% from last month. We do not think the data gives any support for the notion that regulators should loosen the lending rules, as some are suggesting. That said the “incentives” for first time buyers are having an effect – in essence, persuading people to buy in at the top, even as prices slide. I think people should be really careful, as the increased incentives are there to try and keep the balloon in the air for longer.
So, what can we conclude? Investment lending momentum is on the turn, though there is still lots of action in the funding of new property construction for investment – mostly in the high rise blocks around our major centres. But in fact momentum appears to be slowing in Brisbane, Sydney and Melbourne. This does not bode well for the construction sector in 2018, as we posit a fall in residential development, only partly offset by a rise in commercial and engineering construction (much of which is state and federal funded). What I’m noticing is that those in the construction sector – from small builders to sub-contractors – have significantly lower confidence levels than they did six months ago, based on our surveys.
Whilst lending to first time buyers is up, there are risks attached to this, as we will discuss later.
The good news is lending to business, other than for housing investment is rising a little, but businesses are still looking to hold costs down, and borrow carefully. This means economic growth will be slow, and potential wages growth will remain contained.
Fitch Ratings says Australian banks’ profit growth is likely to slow in 2018 as global monetary tightening pushes up funding costs, loan-impairment charges rise, and tighter regulation has an impact on business volumes and compliance costs from the 15 or so inquiries or reviews across the sector (according to UBS). They say Australian banks are more reliant on offshore wholesale funding than global peers, as the superannuation scheme here has created a lack of domestic customer deposits. Global monetary tightening could therefore push up banks’ funding costs. Indeed, The 10-Year US Bond yield is moving higher, and whilst the US Mortgage rates were only moderately higher today, the move was enough to officially bring them to the highest levels since the (Northern) Spring of 2017.
The main risks to banks’ performance stem from high property prices and household debt. Australian banks are more highly exposed to residential mortgages than international peers, while households could be sensitive to an eventual increase in interest rates or a rise in unemployment, given that their debt is nearly 200% of disposable income. Indeed, Tribeca Investment Partners said this week that local equities may be hurt by troughs in the domestic property market. “A heavily indebted household sector that is experiencing flat to negative real income growth, as well as dealing with higher energy and healthcare costs, and which has drawn down its savings rate, is unlikely to fill the gap in growth”
In local economic news, the latest ABS data on employment to December 2017, shows the trend unemployment rate decreased slightly to 5.4 per cent in December 2017, after the November 2017 figure was revised up to 5.5 per cent. The trend unemployment rate was 0.3 percentage points lower than a year ago, and is at its lowest point since January 2013.
The seasonally adjusted number of persons employed increased by 35,000 in December 2017. The seasonally adjusted unemployment rate increased by 0.1 percentage points to 5.5 per cent and the labour force participation rate increased to 65.7 per cent. The number of hours worked fell. By state, trend employment rose in NT, WA and SA. Over the past year, all states and territories recorded a decrease in their trend unemployment rates, except the Northern Territory (which increased 1.6 percentage points). The states and territories with the strongest annual growth in trend employment were Queensland and the ACT (both 4.6 per cent), followed by New South Wales (3.5 per cent).
The ABA released new research – The Edelman Intelligence research conducted late last year which tracks community trust and confidence in banks. Whilst progress may be being made, the research shows Australian banks are behind the global benchmark in terms of trust. Based on the Annual Edelman Trust Barometer study released in January 2017, Australia remains 4 points behind the global average.
The Australian Financial Review featured some of our recent research on the problem of refinancing interest only loans (IO). Many IO loan holders simply assume they can roll their loan on the same terms when it comes up for periodic review. Many will get a nasty surprise thanks to now tighter lending standards, and higher interest rates. Others may not even realise they have an IO loan!
Thousands of home owners face a looming financial crunch as $60 billion of interest-only loans written at the height of the property boom reset at higher rates and terms, over the next four years.
Monthly repayments on a typical $1 million mortgage could increase by more than 50 per cent as borrowers start repaying the principal on their loans, stretching budgets and increasing the risk of financial distress.
DFA analysis shows that over the next few years a considerable number of interest only loans (IO) which come up for review, will fail current underwriting standards. So households will be forced to switch to more expensive P&I loans, assuming they find a lender, or even sell. The same drama played out in the UK a couple of years ago when they brought in tighter restrictions on IO loans. The value of loans is significant. And may be understated.
We also featured research on the Bank of Mum and Dad, now a “Top 10” Lender in Australia. Our analysis shows that the number and value of loans made to First Time Buyers by the “Bank of Mum and Dad” has increased, to a total estimated at more than $20 billion, which places it among the top 10 mortgage lenders in Australia. Savings for a deposit is very difficult, at a time when many lenders are requiring a larger deposit as loan to value rules are tightened. The rise of the important of the Bank of Mum and Dad is a response to rising home prices, against flat incomes, and the equity growth which those already in the market have enjoyed. This enables an inter-generational cash switch, which those fortunate First Time Buyers with wealthy parents can enjoy. In turn, this enables them also to gain from the more generous First Home Owner Grants which are also available. Those who do not have wealthy parents are at a significant disadvantage. Whilst help comes in a number of ways, from a loan to a gift, or ongoing help with mortgage repayments or other expenses, where a cash injection is involved, the average is around $88,000. It does vary across the states. But overall, around 55% of First Time Buyers are getting assistance from parents, with around 23,000 in the last quarter.
There was also research this week LF Economics which showed that some major lenders are willing to accept a 20% “Deposit” for a mortgage from the equity in an existing property, and in so doing, avoided the need for expensive Lenders Mortgage Insurance.
Both arrangements are essentially cross leveraging property from existing equity, and is risky behaviour in a potentially falling market. More evidence of the lengths banks are willing to go to, to keep their mortgage books growing. We think these portfolio risks are not adequately understood.
So, we conclude that banks are caught between trying to grow their books, in a fading market, by offering cheap rates to target new borrowers, and accept equity from existing properties, thus piling on the risk; while dealing with rising overseas funding, and in a flat income environment, facing heightened risks from borrowers as they join the 200% club.
That’s the Property Imperative Weekly to 20 January 2018. If you found this useful, do leave a comment, subscribe to receive future updates and check back for our latest posts. Many thanks for watching.
The final set of data from the ABS – Lending Finance to November 2017 highlights again the changes underway in the property sector. They also contain some revisions from last month. As normal we will focus on the trend series, which smooths some of the monthly changes.
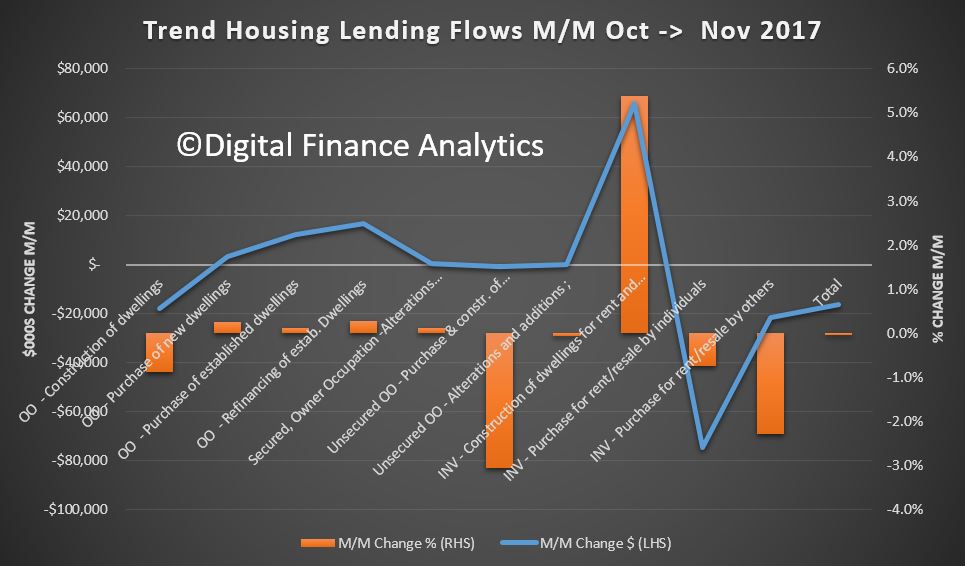
Within the housing series, owner occupied lending for construction fell 0.88% compared with the previous month, down $17m; lending for the purchase of new dwellings rose 0.25%, up $3m; and loans for purchase of existing dwellings rose 0.11%, up $12m.
Refinance of existing owner occupied dwellings rose 0.28%, up $16m.
Looking at investors, borrowing for new investment construction rose 5%, up $65m; while purchase of existing property by investors fell $74m for individuals, down 0.75%; and for other investors, down $21m or 2.28%.
Overall there was a fall of $16m across all categories.
We see a fall in investment lending overall, but it is still 36% of new lending flows, so hardly a startling decline. Those calling for weakening of credit lending rules to support home price growth would do well to reflect that 36% is a big number – double that identified as risky by the Bank of England, who became twitchy at 16%!
Looking then across all lending categories, personal fixed credit (personal loans rose $70m, up 1.74%; while revolving credit (credit cards) fell $4m down 0.18%. Fixed commercial lending, other than for property investment rose $231m or 1.12%; while lending for investment purposes fell 0.25% or $30m. The share of fixed business lending for housing investment fell to 36.7% of business lending flows, compared with 41% in 2015. Revolving business credit rose $6m up 0.06%.
So, what can we conclude? Investment lending momentum is on the turn, though there is still lots of action in the funding of new property construction for investment – mostly in the high rise blocks around our major centres. But in fact momentum appears to be slowing in Brisbane, Sydney and Melbourne. This does not bode well for the construction sector in 2018, as we posit a fall in residential development, only partly offset by a rise in commercial and engineering construction (much of which is state and federal funded).
The good news is lending to business, other than for housing investment is rising a little, but businesses are still looking to hold costs down, and borrow carefully. This means economic growth will be slow, and potential wages growth will remain contained.
Finally, here is the ABS reporting the data. Note the significant swings between the trend and seasonal adjusted series. You can pick your number, and weave a story to suit, as people are doing.
The total value of owner occupied housing commitments excluding alterations and additions rose 0.1% in trend terms, and the seasonally adjusted series rose 2.7%.
The trend series for the value of total personal finance commitments rose 1.0%. Fixed lending commitments rose 1.7%, while revolving credit commitments fell 0.2%.
The seasonally adjusted series for the value of total personal finance commitments rose 1.1%. Revolving credit commitments rose 2.8% and fixed lending commitments rose 0.1%.
The trend series for the value of total commercial finance commitments rose 0.5%. Fixed lending commitments rose 0.6% and revolving credit commitments rose 0.1%.
The seasonally adjusted series for the value of total commercial finance commitments rose 14.7%. Fixed lending commitments rose 22.0%, while revolving credit commitments fell 8.1%.
The trend series for the value of total lease finance commitments fell 1.2% in November 2017 and the seasonally adjusted series fell 8.0%, after a rise of 4.1% in October 2017.
There could be troubled times ahead for small businesses and contractors working in construction, with property analysts and economists kicking of the year with predictions the residential apartment sector slowdown could cause pain.
“There is absolutely no question we have seen a considerable softening in the construction end of the residential apartment space,” Watpac managing director Martin Monro warned in The Australian today.
While data from the Australian Bureau of Statistics shows new housing starts in the year to September rebounded, experts and industry leaders have been divided in commentary on the state of the sector and what the next 12 months will hold for builders and their suppliers.
Digital Finance Analytics principal Martin North says while it’s not a uniform trend across the country, there are troubling signs on the eastern seaboard in particular.
“What I’m noticing is that those in the construction sector – from small builders to sub-contractors – have significantly lower confidence levels than they did six months ago,” he says.
“Their forward pipeline of work is wilting, especially across Brisbane and Melbourne. And now I’m seeing it in and around Sydney for the first time.”
And it’s demand for high rise apartments, he says, that is seeing the biggest drop.
“Investors are quite concerned because capital values look to have stalled and could be reversing. It’s also much more difficult to get financing now and foreign buyers have defected,” he says.
North says there could be more pain to come in Queensland.
“Brisbane is where the pain is most extreme, but I’m seeing it in and around Melbourne and Sydney now.”
Sub-contractors concerned over risks of non-payment
Weakness in the Brisbane market has already claimed its casualties, with several builders having liquidated in the last year.
With several other builders having suffered a similar fate, there are fears any continued slowdown could see more sub-contractors not getting paid. Those working as contractors in the building space are worried more pain could be to come this year.
“The industry is a shambles and is overseen by an inept QBCC who are hamstrung by poor legislation,” says Subbie United’s John Goddard.
Goddard claims sub-contractors have a difficult time recovering what they owe in the event a building company collapses.
“You then have pre-insolvency advisors telling these builders how to hide assets before they recommend a friendly liquidator to defeat creditors who are in the main, subbies.”
Housing a cyclical industry
However, small business ombudsman Kate Carnell says while weakness exists in some parts of the building sector, small businesses and contractors should not be alarmed.
“The thing about the industry is it’s cyclical. There’s big ups and downs and that’s how it works. And in some places there’s an oversupply in that space,” she says.
“But if you look at some of the figures around new home starts, there’re looking pretty good and strong. There’s still a dearth of new homes in the markets as we’ve got quite strong population growth.”
Australian banks’ profit growth is likely to slow in 2018 as global monetary tightening pushes up funding costs, loan-impairment charges rise, and tighter regulation has an impact on business volumes and compliance costs. Fitch Ratings maintains its negative sector outlook to reflect these pressures.
Australian banks are more reliant on offshore wholesale funding than global peers, as the superannuation scheme has created a lack of domestic customer deposits. Global monetary tightening could therefore push up banks’ funding costs. That said, the impact is likely to be contained by banks’ hedging of foreign-currency borrowing back to Australian dollars, while only a portion of the wholesale funding is refinanced each year. Meanwhile, improved liquidity should mitigate the risks associated with dependence on wholesale funding.
Loan-impairment charges fell close to record lows in 2017, which is one reason why profit growth held up better than we had expected. However, impairment charges are likely to increase this year, with asset quality still being challenged in some sectors and regions. At the same time, write-backs from previously impaired assets are likely to fall. Implementation of the Australian equivalent of IFRS9 might also result in higher provisioning charges.
Despite the headwinds, the major Australian banks are likely to remain more profitable than most international peers, owing largely to dominant domestic market positions that give them strong pricing power.
The main risks to banks’ performance stem from high property prices and household debt. We forecast house prices to rise modestly this year. Moreover, the proactive approach by regulators to address household debt risks – such as a tightening of underwriting standards and restrictions on investment mortgages and interest-only loans – should offer some protection to banks’ asset quality in the event of a housing market downturn.
Nevertheless, Australian banks are more highly exposed to residential mortgages than international peers, while households could be sensitive to an eventual increase in interest rates or a rise in unemployment, given that their debt is nearly 200% of disposable income. A significant deterioration in asset quality in the mortgage sector could undermine bank profitability and weaken capitalisation, although this is not our base case.
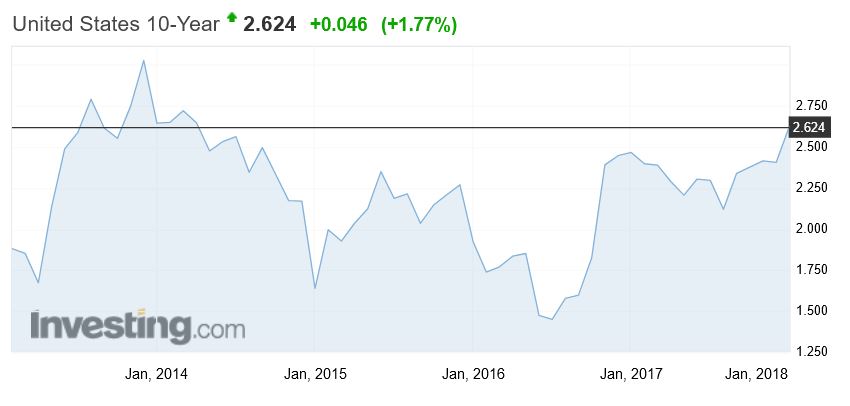
The 10-Year US Bond yield is moving higher. This is important because it has a knock-on effect in the capital markets and so Australian Bank funding costs, potentially putting upward pressure on mortgage rates.
Whilst the US Mortgage rates were only moderately higher today, the move was enough to officially bring them to the highest levels since the (Northern) Spring of 2017.
So this piece from Moody’s is interesting. Is the markets view that rates won’t go higher credible?
Earnings-sensitive securities have thrived thus far in 2018. Not only was the market value of U.S. common stock recently up by 4.5% since year-end 2017, but a composite high-yield bond spread narrowed by 23 basis points to 336 bp. The latter brings attention to how the accompanying composite speculative-grade bond yield fell from year-end 2017’s 5.82% to a recent 5.72% despite the 5-year Treasury yield’s increase from 2.21% to 2.39%, respectively.
Thus, the latest climb by the 10-year Treasury yield from year-end 2017’s 2.41% to a recent 2.62% is largely in response to the upwardly revised outlook for real returns that are implicit to the equity rally and the drop by the speculative-grade bond yield. The 10-year Treasury yield is likely to continue to trend higher until equity prices stagnate, the high-yield bond spread widens, interest-sensitive spending softens, and the industrial metals price index establishes a recurring slide. In view of how the PHLX index of housing sector share prices has risen by 4.5% thus far in 2018, investors sense that home sales will grow despite the forthcoming rise by mortgage yields.
Moreover, increased confidence in the timely servicing of home mortgage debt has narrowed the gap between the 30-year mortgage yield and its 10-year Treasury yield benchmark from the 172 bp of a year earlier to a recent 152 bp. The latter is the narrowest such difference since the 150 bp of January 2014, which roughly coincided with a peaking of the 10-year Treasury yield amid 2013-2014’s taper tantrum.
Do suppliers of credit to the high-yield bond market and mortgage market correctly sense an impending top for benchmark Treasury yields? If they are wrong and the 10-year Treasury yield quickly climbs above its 2.71% average of the six-months-ended March 2014, they will regret having acquiesced to the atypically thin spreads of mid-January 2018.
Although global equity markets are looking strong for 2018, local equities may be hurt by troughs in the domestic property market, says Tribeca Investment Partners.
According to Tribeca Investment Partners portfolio manager Sean Fenton, there is mounting evidence that the Australian housing cycle has already reached its peak, further reinforced by APRA’s efforts in curbing mortgage lending.
“A heavily indebted household sector that is experiencing flat to negative real income growth, as well as dealing with higher energy and healthcare costs, and which has drawn down its savings rate, is unlikely to fill the gap in growth,” Mr Fenton said.
“Further downside risk to the economy may emerge if the current tightening in mortgage lending standards pushes house prices lower and generates negative equity effects.”
With global markets encouraged by “easy monetary conditions”, central banks would be unwilling to make any sudden moves and lower the interest rate too quickly, “particularly as inflation has remained quiescent”.
“This provides fertile ground for equity markets to rally, but also creates an environment of heightened risk as areas of stretched valuation become more apparent,” Mr Fenton said.
Tribeca would continue to underweight sectors sensitive to the interest rate as well as increase its underweight to the building materials, retail and property development sectors.
“Domestically, we are positioned more defensively in gaming, select industrials and a small overweight to banks,” Mr Fenton added.