Balance of Trade Unexpectedly Weakens In November

The latest data from the ABS highlights that in November, Australia’s widened trade deficit widened, against expectations of $550m surplus; which is close to a $1bn miss. It was largely driven by a large fall in non-monetary gold exports. This raises the possibility of weaker than expect fourth quarter growth outcomes.

The ABS says that in trend terms, the balance on goods and services was a deficit of $194m in November 2017, a turnaround of $296m on the surplus in October 2017. In seasonally adjusted terms, the balance on goods and services was a deficit of $628m in November 2017, an increase of $326m on the deficit in October 2017.

In seasonally adjusted terms, goods and services credits rose $141m to $31,853m. Non-rural goods rose $394m (2%) and rural goods rose $25m (1%). Non-monetary gold fell $425m (23%). Net exports of goods under merchanting remained steady at $53m. Services credits rose $147m (2%).

In seasonally adjusted terms, goods and services debits rose $467m (1%) to $32,481m. Consumption goods rose $213m (3%), capital goods rose $190m (3%) and intermediate and other merchandise goods rose $81m (1%). Non-monetary gold fell $100m (25%). Services debits rose $83m (1%).

How Does Uncertainty Affect How UK Firms Invest?

From the Bank Underground Blog.

Uncertainty is in the spotlight again. And the MPC believe it is an important factor influencing the slowdown in domestic demand (August 2017 Inflation Report). Previous work by Haddow et al. (2013) has found a composite aggregate indicator of uncertainty combining several different variables that does appear to have explanatory power for GDP growth; but as Kristin Forbes notes these measures correlate better with consumption than investment. So in this blog post, we look at firm-level data to explore measures of uncertainty that matter for how firms invest in the United Kingdom. Our aggregate measure of uncertainty has a better forecast performance for investment than the composite aggregate indicator does.

Uncertainty is difficult to define, and since it is unobservable, it is hard to measure. It is correlated with other factors that drive an economy but it is unclear whether movements in uncertainty simply reflect the influence of those factors or indicate an independent change in uncertainty (see, for example, Bloom (2014)). This makes it challenging to distinguish its direct effect on the economy. Various approaches have been adopted in recent literature both to measure it and to capture its effects on macroeconomic variables, like GDP, consumption and investment. Jurado et al. (2015) have emphasised certain desirable features of uncertainty measures. First, these measures should be forward-looking since we are interested in uncertain events in the future. Second, they should measure variation in future outcomes (i.e., the width of the probability distribution) rather than specific future outcomes (like a mean or a median). And third, they should not include a component that can be systematically forecast in advance; we are not typically uncertain about outcomes that we can forecast!

One potentially useful measure of uncertainty is based on UK firms’ stock price volatility, inspired by a similar measure introduced for US firms by Gilchrist et al. (2014). The intuition behind the stock market uncertainty (SVU) measure is that we would expect those firms facing a more uncertain environment to have a more volatile stock price. This is because investors are less certain about the value of the company and hence the value of the shares they hold in the company. We use this measure to construct an estimate of UK firms’ uncertainty that has all three of the desirable features mentioned above.

To calculate the SVU measure we use a sample of 622 firms listed on the stock exchange in the UK. To do this, we first estimate the daily variation in individual stock prices that cannot be explained by general market variation in a capital asset pricing model (CAPM) (see, for example, Sharpe (1964)). Then, we calculate the quarterly firm-specific standard deviation of the daily unexplained returns from the first step. The outcome is a firm-specific and time-varying SVU measure. Finally, we estimate a common component of these measures over time, which we interpret as an aggregate-level measure of the SVU.

Because the SVU measure already reflects the expected variation in the stock price based on general market variation in the first step, this measure picks up the unforecastable variation in the price. That helps achieve the desirable features of uncertainty measures discussed above; it is forward-looking (stock prices should include information about future prospects of a firm), it measures variation rather than means or medians, and it makes an attempt to exclude the forecastable component of uncertainty.

Chart 1 shows what the resulting aggregate SVU measure looks like. It also shows how it compares across large firms (over 250 employees) and small and medium-size firms (about 20% of firms in our sample).

The aggregate uncertainty measure is fairly volatile, and there is a large spike during the financial crisis. The SVU measure for small and medium-size firms is even more volatile than for larger firms, probably reflecting the more uncertain environment facing smaller firms. When compared to the Haddow et al. uncertainty indicator, the measures generally move in the same direction. More recently, both increased in anticipation of the EU Referendum, but after it, the SVU measure fell while the Haddow et al. indicator remained elevated (Chart 1).

Chart 1: Different measures of uncertainty

So, what might be the effect of uncertainty on investment? Chart 2 shows that firms which experienced higher uncertainty during the crisis, on average, have subsequently tended to report lower investment (in other words, the distribution for these firms is, on average, more to the left than for the other group of firms). This is in contrast to firms which experienced less uncertainty during the crisis, on average, and have tended to invest more since the crisis. The difference between two groups of firms is statistically significant and suggests that investment dynamics might be negatively affected by uncertainty.

Chart 2: Distributions of firm-level investment-to-capital ratios split by increases in uncertainty during the financial crisis

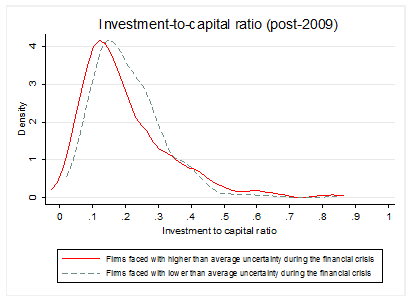
The chart shows sample distributions for investment-capital ratios since 2009 by the size of an increase in uncertainty during the financial crisis.

But Chart 2 is only suggestive. It does not prove any form of causality. To get a better idea of how uncertainty might actually affect investment, we model investment at the level of the firm. We also control for other relevant drivers of investment, as well as variation in investment across time and across firms. More specifically, we regress firm-level investment-to-capital ratios on variables like firm-specific sales, a proxy for future investment opportunities, and different measures of the cost of capital. We find that firm-specific SVU is a very significant explanatory variable for firms’ investment rates in all specifications of the model that we tried, as well as when we include different measures of the cost capital and firm-specific risk premia. We also find that the SVU measure has only been important, in a statistical sense, after the financial crisis.

Given there is evidence that firms’ investment behaviour is correlated with our measure of uncertainty, we can use that insight to study aggregate business investment in the UK. We model uncertainty in a multivariable time series model that also includes other relevant aggregate level variables (GDP, interest rates and inflation). In this framework, an increase in uncertainty produces a relatively persistent effect on investment (Chart 3). This effect peaks after one year and then gradually dies out over the next two years. And a model with our SVU measure forecasts business investment dynamics better over the past than a model with the Haddow et al. uncertainty measure (Chart 4).

Overall, there is evidence that our measure of firm-specific uncertainty can help explain investment behaviour both at the level of the firm and in aggregate. Whereas the work by Haddow et al. suggested that the uncertainty is an important driver of GDP fluctuations, our work provides complementary analysis, using a different measure of uncertainty, to suggest that uncertainty is a crucial factor in firms’ investment decisions.

Chart 3: Impulse response of business investment to an uncertainty shock

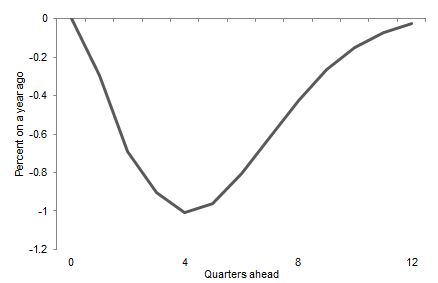
The chart shows percentage changes to a one-standard deviation shock to the uncertainty variable. The impulse response has been identified with a Choleski ordering of the variables (see here for more detailed definitions), where investment reacts with a lag to exogenous shocks in the other variables.

Chart 4: Relative forecast performance of different uncertainty measures on business investment

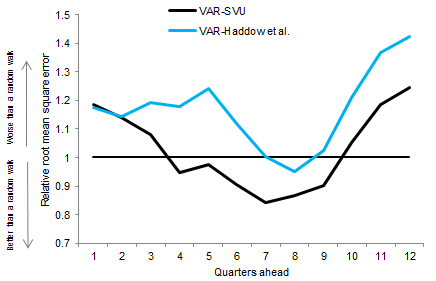
The chart shows the root-mean square error (RMSE) relative to a random walk forecast for annual changes in business investment at different forecast horizons, where random walk = 1. The lower the RMSE, the better the forecast.

Marko Melolinna works in the Bank’s Structural Economic Analysis Division and Srdan Tatomir works in the Bank’s Macro Financial Analysis Division.

Note: Bank Underground is a blog for Bank of England staff to share views that challenge – or support – prevailing policy orthodoxies. The views expressed here are those of the authors, and are not necessarily those of the Bank of England, or its policy committees.

Bank of Mum and Dad Now Offers “Deposit Free” First Time Buyer Loans

Hopping on the “Bank of Mum and Dad” bandwagon, Bluebay Home Loan, a  WA-based mortgage manager has launched a “new” loan offering designed to help first time buyers access the market without a deposit.

Our research shows that many first time buyers are getting help from parents – on average up to $88,000. But there are risks attached (especially in a falling market), as we discussed some time back, and at a time when many lenders are desperate to lend to first time buyers.

Now, Bluebay have introduced a Parent Assist Home Loan, which formalises the Bank of Mum and Dad arrangements and allows first home buyers (FHBs) to receive a loan for a home deposit of 5 per cent to 20 per cent from parents, with interest-only repayments at half the rate of the home loan.

There may be some benefit in a more formal structure, as many Bank of Mum and Dad arrangements are very informal!

By using this structure, first home buyers who borrow 20 per cent of the property from their parents are exempt from lenders mortgage insurance (LMI). LMI premiums are expensive, and many brokers now recommend avoiding them. In addition, first time borrowers can get access to first home owner grants within this structure.

Rather than spend years saving for a deposit, a parent can lend their child up to 20% of the property’s purchase price.

It’s an official structured loan managed by Bluebay Home Loans.

Bluebay Home Loans arranges and manages the remainder of the loan through a large lender.

Because it’s a loan and not a gift, parents are paid back with interest.

Interest is half the interest rate of the Bluebay home loan rate, which helps on the parents loaned amount with lower repayments.

Parents are paid back over time or when the house is sold or refinanced, including their share of any investment growth.

Parents don’t have to become a guarantor so children are not asking them to risk their family home.

The new homebuyer still gets access to the First Home Owner’s Grant and any stamp duty concessions.

Because you’ve contributed a larger deposit you could save paying thousands of dollars in mortgage insurance.

The fees are transparent with an ongoing management fee of only $5 per month.

The new buyer gets a little more financial muscle, which means they’ll have more choice to buy something bigger, somewhere better or maybe even something closer to the family.

And remember, things happen in life Whatever changes occur down the track, parents have official protection over their money.

Most importantly, a Parent Assist Home Loan removes the stress and emotion of borrowing money from a parent


ANZ Tweaks Mortgage Broker Commissions

From The Adviser.

ANZ has advised mortgage brokers that its upfront commission structure will change from next month, by removing the volume incentive.

In a note to brokers obtained by The Adviser, ANZ’s general manager of broker distribution, Simone Tilley, explained that the bank has recently completed a comprehensive review of its commission structure.

“As a result, I wish to advise that ANZ will make changes to its upfront commission structure, effective 1 February 2018,” Ms Tilley said.

“We believe that the planned changes will provide a simpler commission structure which delivers on ANZ, aggregator and broker requirements and is more transparent for the customer.

“There has been no change to ANZ’s current trail commission structure.”

From 1 February 2018, ANZ will pay an upfront commission of 62.5 basis points.

Ms Tilley explained that this base upfront rate does not include any additional LVR adjustment component calculated and payable under the new structure.

The bank currently pays an upfront commission of 57.5 basis points. However, brokers writing more than $100 million with the group receive an upfront payment of 62.5 basis points.

The new change removes the volume-based incentive from ANZ’s commission structure, something that was recommended by the Combined Industry Forum in response to the ASIC and Sedgwick reviews.

ANZ continues to pay the lowest upfront commissions of the big four banks.

ASIC’s report into broker remuneration noted that volume-based and campaign-based bonus commissions that supplement the standard commission model can create potential conflicts of interest and “higher risk that brokers will place customers with lenders for the wrong reasons”.

As such, the Combined Industry Forum outlined that by the end of 2017, industry participants “should respond to ASIC’s recommendation” to cease these payments.

The Combined Industry Forum report, which was released on 11 December, revealed that there were 38 groups collaborating on the response, including the four major banks, five industry associations, aggregators, brokerages and consumer group Choice.

Mobile-First Digital Banking Strategy Takes Hold In The Midwest

From S&P Global.

Banks across the U.S. are adopting a mobile-first strategy for their digital offerings, and the Midwest is no exception.

U.S. consumers value their mobile bank apps more than ever, and expectations for these products are growing increasingly sophisticated. Once-novel mobile features such as photo check deposit and bill pay are now table stakes, and banks seeking to offer a competitive digital experience have to evaluate an ever-evolving range of services.

S&P Global Market Intelligence’s 2017 U.S. Mobile Banking Landscape includes regional insights from our 2017 mobile banking survey and details on the features available in the apps of dozens of U.S. financial institutions, including more than two dozen large banks and 45 companies with less than $50 billion in assets. The latter group consists of five smaller regional and community banks from each of the nine U.S. census divisions. This article focuses on the Midwest, which includes the East North Central and West North Central census divisions.

Our survey found that Midwestern mobile banking customers are most interested in seeing credit score information added to their apps. Consumers’ preoccupation with their credit files is only likely to intensify in the wake of the Equifax data breach. Few of the regional bank apps from around the country that we recently reviewed provide access to this information, although First National Bank of Omaha makes it available to consumer credit card customers.

Which bank app features are missing? (%)

Another highly valued feature for bank app users is fingerprint login, which many Midwestern banks offer. But with the rollout of Apple’s new iPhone X and other evolutions in mobile technology, banks across the country are increasingly having to pay attention to alternative forms of biometric authentication, including face ID. Banks are responding to their customers’ desire for even more convenient access to account information by allowing them to view their balances without logging in to the app.

Customers also want access to certain card controls via their bank apps, including the ability to temporarily switch cards on or off, and to report them lost or stolen. Jefferson City, Mo.-based Central Banco. Inc. and Sioux Falls, S.D.-based Great Western Bancorp Inc. are among the institutions planning to roll out such features in the near future, while Saint Paul, Minn.-based Bremer Financial Corp. makes certain card controls and account alert management available through a separate, third-party app.

The availability of certain features is just one way to assess the quality of a mobile offering. Customers who provide app store reviews clearly value speed, reliability, and an intuitive layout, and they seem to prefer having all features available on one platform.

Central Bank is redesigning its whole app for release next year, with the goal of providing a more user-friendly experience by streamlining navigation and better surfacing popular features such as person-to-person payments. The bank is taking the mobile-first approach seriously, as mobile logins have overtaken desktop logins, and about 65% of the company’s digital traffic is coming through phones.

Great Western Bank, whose deposits are primarily spread across Nebraska, Iowa, South Dakota, and Colorado, also hears from customers that they want improved core functionality, for example, faster transaction alerts. Great Western uses a niche digital vendor for its mobile channel and believes this is more advantageous than using a standard package from core systems providers.

The Midwest is home to some of the nation’s few mobile-ready ATMs. Chicago-area Wintrust Financial Corp. is a relatively early adopter of Cardless Cash, which lets the customer scan a QR code with their smartphone instead of using a debit card to withdraw money. In a competitive banking environment, and especially in heavily banked areas, financial institutions are keeping an eye on customer attrition and looking for an edge. This sometimes means making investments in new ATM hardware or services like mobile P2P payments that do not necessarily add revenue but that have become part of what customers expect from their banks.

It is difficult to quantify the value of a high-quality mobile banking experience, but our survey results give an idea of how important it is to consumers. Despite being generally fee-averse, more than 40% of survey respondents from the Midwest indicated that they would be willing to pay $1 per month to use their bank apps, while more than 20% said they would pay $3 per month. Respondents from the East North Central census division, which includes Indiana, Illinois, Michigan, Ohio and Wisconsin, were more willing to pay a fee. Although banks are unlikely to start charging for their digital services, satisfied mobile banking users could prove stickier deposit customers even as rates continue to rise and other institutions tempt them with promotional offerings.

When it comes to delivering products and services, banks of all sizes have a high bar to meet. Large, deep-pocketed institutions are constantly innovating with their digital channels, and it is not easy for their smaller peers to keep up. But many regional and community banks boast sophisticated mobile apps with desirable features that are not yet ubiquitous among the nation’s largest banks. In a banking landscape populated by fewer branches and with visits to those locations by tech-savvy customers on the decline, the combination of a strong local brand and robust digital experience could give smaller banks a competitive edge.

Methodology

The 2017 mobile banking survey was fielded online between January 26 and February 1 across a nationwide random sample of 4,000 U.S. mobile bank app users 18 years and older. Results have a margin of error of +/- 1.6% at the 95% confidence level based on the sample size of 4,000.

S&P Global Market Intelligence researched mobile apps in June 2017 for more than two dozen financial institutions, including the biggest retail banking franchises in the U.S. and various large regional and branchless banks. Between September 18 and November 10, S&P Global Market Intelligence researched mobile apps for 45 smaller regional players and large community banks. The latter analysis focused, for the most part, on the top five retail deposit market share leaders with under $50 billion in assets in each of the nine U.S. census divisions.

This research is based on product descriptions available on bank websites and in app stores, as well as company-provided information. Some companies may have subsequently updated their apps or may offer additional features and services. Our analysis does not necessarily reflect functionality or services available through text banking, mobile browsers or secure messaging.

How Fiscal Realities Intersect with Monetary Policy

From the St. Louis Fed On The Economy Blog.

How are government deficits financed, and what are the implications for monetary policy and inflation?

The deficit is defined as the difference between expenditures (including the interest paid on debt) and revenues. If the difference is negative, we get a surplus.

Between 1955 and 2007, the deficit of the U.S. federal government averaged about 1.9 percent of gross domestic product (GDP). In the decade since, the deficit averaged about 5.3 percent of GDP. Roughly two-thirds of this increase is attributable to larger expenditures.

Federal Debt Expansion

Deficits are financed by issuing debt. Since 2007, the federal debt in the hands of the public has grown at an average annual rate of 11 percent.1 As a share of GDP, it went from about 30 percent in 2007 to almost 64 percent as of the end of fiscal year 2017.2

According to the Financial Accounts of the United States, about 40 percent of this debt expansion was absorbed by foreigners, mostly in Japan and China.3

Before Congress approved the tax cut package in December, deficits and the debt were expected to grow significantly over the next decade.4 The new tax plan is expected to add further to the deficit. Though estimates of how much have varied widely, the most recent put the increase in the deficit over the next 10 years at about 10 percent.5,6

What Can Monetary Policy Do?

By influencing interest rates, the Fed can affect the servicing cost of debt. The current path of monetary policy normalization will imply generally higher interest rates, which will add to the deficit and require the Treasury to issue even more debt, raise taxes or reduce expenditures.

Federal revenues are supplemented by Federal Reserve remittances. These have been unusually large in recent years, about 0.5 percent of GDP, due to the Fed’s large balance sheet. Monetary policy normalization contributes to the expected increase in the deficit, since remittances are expected to decline to historical levels as the Fed’s balance sheet contracts.

The burden of debt can also be alleviated with higher inflation. This is not unprecedented in the United States. For example, after World War II, high inflation was used to finance part of the accumulated debt.7 Arguably, in the post-Paul Volcker era, the Fed has enjoyed increased independence and has not been very accommodative to the Treasury.

Inflation Becoming a Fiscal Phenomenon

However, as government debt has increasingly become more widely used as an exchange medium in large-value transactions (either directly or indirectly as collateral), the control of the “money” supply has shifted away from the Fed. In other words, the more cash, bank reserves and Treasuries resemble each other, the more inflation depends on the growth rate of total government liabilities and less on the specific components controlled by the Fed (i.e., the monetary base).

Thus, inflation becomes more of a fiscal phenomenon. Traditional monetary policy tools, such as swapping reserves for Treasuries, may be less effective in controlling it.

Though government debt has expanded significantly in recent years and is expected to continue growing, inflation and inflation expectations have not diverged far away from the Fed’s target of 2 percent annually. The likely reason is that demand for government liabilities has kept pace with the growth of the supply.

In this sense, during and after the financial crisis of 2007-08, there was a big appetite for U.S.-dollar denominated safe assets. As mentioned at the beginning of this post, 40 percent of the debt increase since the crisis has been absorbed by foreigners.

The high demand for U.S. Treasuries may continue or may reverse. If taste for U.S. debt declines, the projected deficits (with their associated debt expansion) may imply an increase, potentially significant, in inflation in the long run.

In this last scenario, the Fed would face a difficult challenge if facing a strong-headed Treasury and Congress that refuse to lower the deficit in the long run. Increasing interest rates—as during the Volcker disinflation, but now in an era of liquid government debt—may only exacerbate the deficit problems and do little to lower inflation.

Notes and References

1 The official figures of “Debt in the hands of the public” include holdings by the Federal Reserve Banks. I have netted those out since we are looking at the consolidated government budget.

2 The U.S. government’s fiscal year begins Oct. 1 and ends Sept. 30 of the subsequent year and is designated by the year in which it ends.

3 Martin, Fernando. “Who Holds the U.S. Public Debt?” Federal Reserve Bank of St. Louis On the Economy Blog, May 11, 2015.

4 Martin, Fernando M. “Making Ends Meet on the Federal Budget: Outlook and Challenges.” The Regional Economist, Third Quarter 2017, pp. 16-17.

5 For example, see Jackson, Herb. “Deficit could hit $1 trillion in 2018, and that’s before the full impact of tax cuts,” USA Today, Dec. 20, 2017; and The Associated Press. “The Latest: Estimate says tax bill adds $1.46T to deficit.” Dec. 15, 2017.

6 The Joint Committee on Taxation, the Senate’s official scorekeeper, estimates the deficit increase at about $1.5 trillion; the committee’s macroeconomic analysis of the “Tax Cuts and Jobs Act” is available here (JCX-61-17).

7 Postwar inflation (1946-1948) is estimated to have resulted in a repudiation of debt worth about 40 percent of output. See Ohanian, Lee E. The Macroeconomic Effects of War Finance in the United States: Taxes, Inflation, and Deficit Finance. New York, N.Y., and London: Garland Publishing, 1998.

Blockchain to Transform Employee Rewards

SaaS employment solutions startup, REFFIND Limited, believes that blockchain will radically transform employee rewards programs in 2018, and has acquired a substantial stake in US blockchain leader for the global loyalty market, Loyyal Corporation, to pioneer this transformation.

The US$2.3m proposed transaction will give Reffind exclusive usage rights to Loyyal’s advanced blockchain technology in selected countries across the 4.5 billion-populated Asia-Pacific region, which they will apply to their existing employee engagement and recognition platform, Wooboard.

“Reffind is already reshaping our approach to employee engagement through our signature peer recognition program that has proven far more effective in building and nurturing a culture of engagement than alternative “top down” management-led approaches,” said Tim Lea, CEO of Reffind.

“However, employee rewards systems across the globe are still plagued by frustrations and inefficiencies that render even the most well-intentioned – and expensive – programs almost completely ineffective as a tool for retaining and engaging staff.

“The lack of transparency around determining the level and type of remuneration from employee to employee is a well-known reason why many employees resign. As an example, the period shortly following bonus season in the banking sector is the number one time disgruntled bankers quit in droves,” continued Tim Lea.

“This problem is then further exacerbated when it comes to assessing more subjective or “softer” performance characteristics, such as employee integrity, values, and culture – despite these characteristics being vital to high-performing and happy workplaces.

“Add to this an enormous amount of frustration around the timing of receiving rewards, and the limited ability for employees to spend their rewards when, how, and on what they want, and the result is an epidemic of enormously ineffective rewards schemes being given in some of the largest corporations across the world.

“Effectively companies are throwing away thousands – if not millions – of dollars globally,” said Tim Lea.

The San Francisco-based Loyyal Corporation has quickly attracted Fortune 500 clients since forming in just 2014, including the likes of Deloitte, Dubai Points, IBM, iNet, a large global airline, and a large US Financial Services company.

It was the first company globally to apply the breakthrough advantages of its proprietary blockchain network platform to the global loyalty and rewards industry. It is believed that the inherent characteristics of the advanced blockchain technology will allow employers to overcome the fundamental issues currently seen with these programs.

Blockchain allows for interoperability, or functionality across different systems of rewards, meaning employees can accrue a global system of “points” that can be spent however they wish, instead of being limited to a specific set of items or brands.

It provides complete real-time transparency over the receipt and redemption of points, with employees seeing exactly how many points they’ve accrued in real time, and being immediately able to redeem those points as they wish.

By applying this advanced technology to the points-based peer recognition functionality of Wooboard, Reffind believes it will be in a position to completely transform how organisations – from small operations to multinational conglomerates – to recognise and reward positive employee behaviour.

“As experts in employee engagement, we already understand the psychology behind motivating and retaining staff,” said Tim Lea. “By acquiring the rights to this advanced blockchain technology, we are confident that we will kick off an employee rewards revolution in 2018.”

Reffind recently appointed a blockchain expert as its CEO, Tim Lea, brought on board a strategic global blockchain industry advisor, Matthew Hamilton, and voted in a local blockchain authority to the board, David Jackson.

Top 10 Mortgage Stress Countdown At December 2017

Following our monthly mortgage stress post, released yesterday, we have updated our video which counts down the most stressed households across the country.

As normal, there are some changes from last month, as conditions vary across the states. But overall, we see relatively more stress in Victoria and New South Wales.  We will count down to the post code with the highest levels of mortgage stress.

We also discuss the causes of mortgage stress and what households might do to mitigate the issues.


Mortgage Stress to Trigger Rise in Defaults, says Analyst

From The Adviser.

Defaults are expected to rise this year amid new data which reveals that almost a million Australians are under mortgage stress.

Digital Finance Analytics (DFA) has released its mortgage stress and default analysis for the month of December, revealing that over 921,000 households (29.7 per cent) are under “mortgage stress”, with 24,000 households under “severe mortgage stress”, up by 3,000 from the previous month.

DFA principal Martin North has predicted that more Australians will default on their debts in 2018, with an estimated 54,000 households at risk of 30-day debt defaults in the next 12 months.

“My own view is that we’re going to see default debts rise in 2018,” Mr North told The Adviser. “I can’t see any argument to suggest that it’s going to be different unless income starts to move up in real terms.

“I know that Treasury is forecasting a very positive outlook for wage growth over the next couple of years, [but] I can’t see where that’s coming from at the moment. My own view is that we’re going to see mortgage stress rising and that will actually have a knock-on effect on defaults. So, I’m forecasting defaults will be higher later into the year than they were at the end of last year.”

The data analyst attributed rises in mortgage stress to the “loose” lending standards of previous years.

“Over the last four or five years, lending standards have been a bit too loose,” Mr North said.

“We’ve got a lot of people now who, if they applied for the same mortgage two or three years ago, they wouldn’t now get that mortgage because effectively the affordability criteria has been tightened, the income standards have been tightened, all of the dimensions have been tightened.”

Mr North also urged Australians to keep a budget, and he warned that household accumulation of unsecured debt could further perpetuate mortgage stress.

“There’s an alignment between mortgage stress and rises in other forms of debt,” the principal said.

“What we’re finding is that there’s an accumulation of other debt categories around people with mortgage stress, so it’s part of the problem.”

Despite acknowledging the negative impact that a future rate rise imposed by the Reserve Bank of Australia (RBA) would have on mortgage stress, Mr North believes that the central bank needs to increase its cash rate to ease “systematically structural risk” caused by a high debt ratio.

“The RBA [has] a really tricky situation because we’ve got mortgage lending growing at three times income growth — 6 per cent annual mortgage growth lending and 2 per cent income growth — so, that’s an unsustainable position.

“If they do lift rates, essentially that’s going to put more households under pressure.

“[But] my own view is that the next rate will be up, [and] it won’t be for some months — probably in the second half of 2018 — and I think it’s predicated on what happens to wages.”

Concluding, Mr North said: “I can’t see any logic for driving rates lower, and the challenge is that they should be putting rates higher than they probably will because of the problem with debt overhanging in the system we’ve got at the moment.”