More On Household Debt, From The ABC

ABC’s RN Breakfast‘s Business Reporter Michael Janda discussed household debt as part of his segment on Radio National Breakfast this morning, and was kind enough to mention our recent research on owner occupied and investment housing debt sensitivity.

There was a subsequent flurry on Twitter discussing the DFA research approach.

To be clear, our household modelling is based on a rolling 26,000 statistically robust omnibus survey, to which each month we add 2,000 new households and drop off the oldest set. We have data from more than 10 years of research and it feeds our programme of activity and is reflected in the DFA blog.

From a mortgage stress perspective, we run our modelling, based on our household profiles and segments, which looks at net cash flow (before tax) and we also sensitive the modelling based on potential future rate movements. We take account of their total financial position, including other debt demands, and costs of living.

You can read more about our modelling here.  If you want to read our mortgage stress work, this overview is a great place to start.

P.S. Our research is separate and distinct from other research in the housing affordability arena, including the international Demographia survey. Whilst some of the findings may align, the research is based on different underlying research sources.


ABC 7:30 Does Banking Sales Driven Culture

ABC 7:30 ran a segment on the commission and sales driven sales culture resident within our retail banking sector.

NAB released a statement last night.

CBA said:

“Commonwealth Bank is very supportive of the industry-wide review of sales commissions and product-based payments. This review is underway and we have already provided details of our staff bonus structures and remuneration polices to independent reviewer Stephen Sedgwick AO.

“We don’t encourage the use of league ladders to measure product sales, however we do have regular performance discussions with teams and individuals to track how well we are meeting customer needs with a particular focus on customer satisfaction.

“Bonuses paid to our call centre staff take into account several factors and our reward structures are 50 per cent weighted toward meeting customer satisfaction measures. To be eligible for a bonus payment, all our staff must satisfy risk frameworks and show a commitment to the bank’s values.

“This bonus structure does not vary throughout the year.

“Ms Johnston worked with us from 2010 to earlier this year but we don’t have a record of her raising concerns with us about remuneration structures or how performance is tracked in our call centres during this time. We always encourage our people to raise any concerns and we are committed to ensuring these are investigated and resolved.

“Our employees can speak up in many different ways; they can approach their leader or any member of the management team, contact human resources or place an anonymous call to our employee SpeakUp hotline.”

ABC Lateline Does Housing Affordability

ABC Lateline included a segment on housing affordability, and an extended interview with Angus Taylor, Assistant Minister for Cities. His focus was on supply side issues, but he rejected the notion that investors, and their tax-breaks have messed with the market. He suggested the only way to examine the property sector was at an aggregate level, rather than looking at the behaviour of specific groups. We are not convinced!


Why Gen Y should hold off buying a home

Nice piece from ABC’s Michael Janda.

The big controversy this week was whether Gen Ys should forgo some smashed avo to save up for a house.

The commentariat took Bernard’s advice to millennials with more than a grain of salt — he was demolished on the statistical evidence by Greg Jericho and a raft of other analysts.

Yet, the demographer’s opinion also sparked articles on how Gen Y could get into the housing market.

I think the better question to ask is why the hell anyone in Gen Y would want to buy a house right now?

As a member of Gen Y living in the nation’s most expensive city it’s a question I’ve asked myself many times and, aside from two very fleeting periods in late-2008 and around 2012, it’s been hard to find a good reason to buy.

So if your baby boomer parents are hassling you about rushing into the market to avoid being locked out forever, here are a few responses you can shoot back while you sit down, eat your smashed avo, sip your latte and relax.

1. Australian real estate has never been more expensive

A recent study by global investment bank UBS, using a method developed by a branch of the US Federal Reserve, showed Australian house prices were about 7 per cent above previous peaks in 2003, 2007 and 2010.

What goes up tends to go down, and after each of those peaks house prices tended to stagnate or fall slightly.

And while global real estate markets have been going crazy on low interest rates, Australia has been more insane than just about anywhere else, perhaps excluding Canada, New Zealand and Hong Kong.


The folks at Demographia, who do an annual property study comparing markets across eight nations, found that Sydney was the world’s second most expensive city relative to income after Hong Kong, with prices 12.2 times typical annual earnings.

Don’t smirk too much if you live outside the Harbour City though, with Melbourne equal fourth and the other three capitals with populations over a million rated “severely unaffordable” for the twelth year in a row, plus plenty of regional areas in that category.

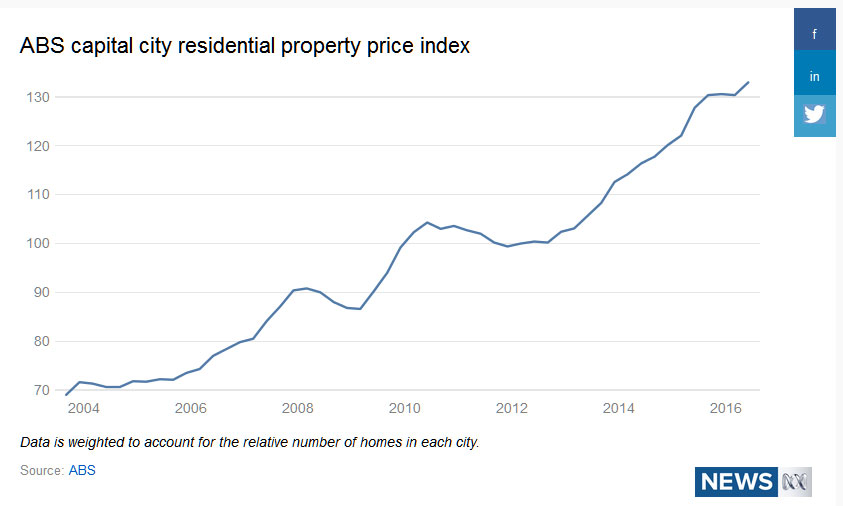
To back up those private sector measures, this is the ABS chart of capital city home prices since 2003. How many other things can you think of that have almost doubled in price over the past 13 years? Certainly not most people’s pay packets.

abc-rrices

 2. We do not have a property shortage and are heading for a glut

But prices have jumped because we have a terrible housing shortage, I hear the property spruikers respond.

Except we don’t.

If we did, it wasn’t nationwide and it wasn’t severe, as I showed in this analysis of ABS population growth and dwelling completion figures last year.

Even in those locations where we might have had a shortage it will soon be replaced by a glut.

According to analysts at Citi, Brisbane is already in a unit glut, Melbourne is on the way and some areas of Sydney are too.

Citi is not alone, with analysts at UBS, Westpac, Morgan Stanley, BIS Shrapnel, Deloitte-Access Economics and even the Reserve Bank, amongst others, warning of an apartment glut.

And when you get a glut prices usually fall, with fairly conservative analysts warning of a 15-20 per cent drop.

So why buy now when you can get more choice and cheaper prices later?

3. We are in one of the world’s biggest property bubbles

See above.

Seriously, prices are at record highs in Australia’s two biggest cities, and many other areas, in absolute terms, relative to incomes, relative to rents, relative to just about any other measure you care to name.

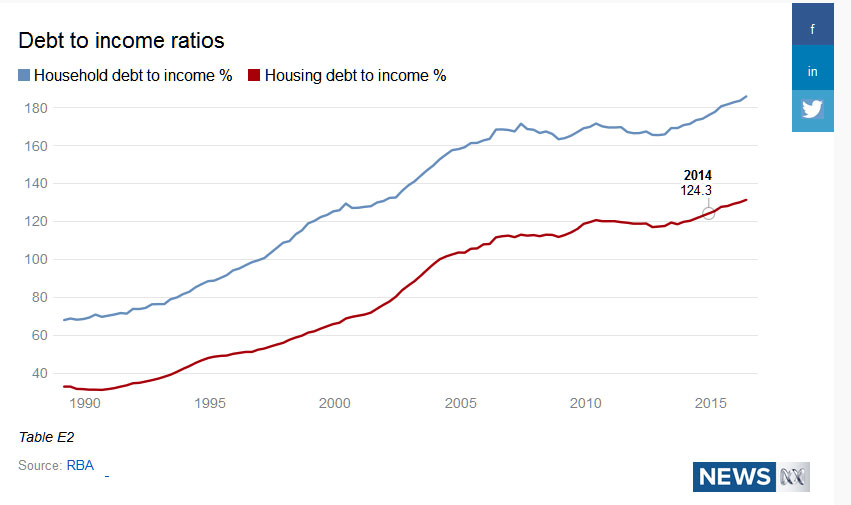
At the same time, household debt, and especially housing debt, is at a record high.

abc-dti

It doesn’t take a genius to figure out why Australian home prices are so high.

The deregulation of the banking system and lower interest rates allowed people to borrow more money, which meant they could keep bidding up the price of homes.

Why is that a bubble?

Basically because you can’t just keep increasing your borrowing faster than your income is growing indefinitely — eventually, even with low interest rates, you simply won’t be able to keep up with the repayments. Ask Greece how this works.

Australia is especially vulnerable since a lot of the money we have borrowed for housing comes from overseas (we’re talking hundreds of billions of dollars here) and if they suddenly stop lending us any more … again, ask Greece.

But you don’t need to take my word for it, ask the OECD, the IMF and the central bank for central bankers, the BIS.

4. Inflation is not going to help you pay off your massive debt

Remember how I said earlier that low interest rates have helped people borrow more money?

Well there’s a big downside to that, explained expertly by Fairfax economics writer Peter Martin.

Basically, rates are low because inflation is low. Inflation is low because wage growth is slow. Slow wage growth means that the size of your repayments don’t shrink much relative to your pay packet over the decades it takes to pay off a home loan.

This is in contrast to most of the baby boomers. Yes they had to put up with peak mortgage interest rates of 17 per cent for a while, but inflation was also much higher which meant the real size of their debt and repayments fell over the life of the loan.

(Not to mention that the initial size of their loans was generally much lower relative to their incomes than it is now).

This was something Glenn Stevens actually warned about in a relatively obscure talk to the Real Estate Institute of Australia when he was an assistant governor of the Reserve Bank in 1997.

5. Interest rates are more likely to rise than fall

There’s more bad news. If inflation does pick up over the medium and longer term, then an inflation-targeting Reserve Bank will have to lift interest rates in response.

While you can get a sub-4 per cent interest rate on many home loans now, more typical interest rates would be around 6.3 per cent, which is the average discount variable rate over the past 12 years.

Most home loans now are for 25 to 30 years, so there’s a fair bet you’ll see rates rise at least a couple of percentage points.

Can you afford that? If not, I wouldn’t even think of buying. In fact, under the bank regulator’s new tighter rules, your financial institution shouldn’t give you a loan.

6. The dangers of negative equity

If you believe that we are in an overvalued housing market, then a key danger you should think about is negative equity.

This is where you owe more to the bank on you home loan than your house or flat is worth.

Provided you can afford the loan it doesn’t have to be a disaster, as you can often ride out a fall in prices by not selling and wait for an eventual recovery.

But it could be a long wait and, in the meantime, you are effectively locked into your home and mortgage because if you sold you couldn’t pay back the bank and you’d be bankrupt.

This has other effects on your life.

For example, if you buy a home with your partner and then have relationship problems it becomes very hard to split up when you can’t sell your property. Think about it, who stays there? Does that person pay rent? You have to stay in touch to manage the property even if you now hate each other. Not good.

7. Rents are relatively cheap … and falling

If you don’t own a home, and don’t live with your folks, you’re probably renting.

While rents feel, and are, expensive in many Australian cities, the fact is that rents are around the lowest they’ve ever been relative to purchase prices – what analysts call the “rental yield”.

Rent increases also haven’t been as low as they are now since the aftermath of the early-1990s recession.

abc-rents

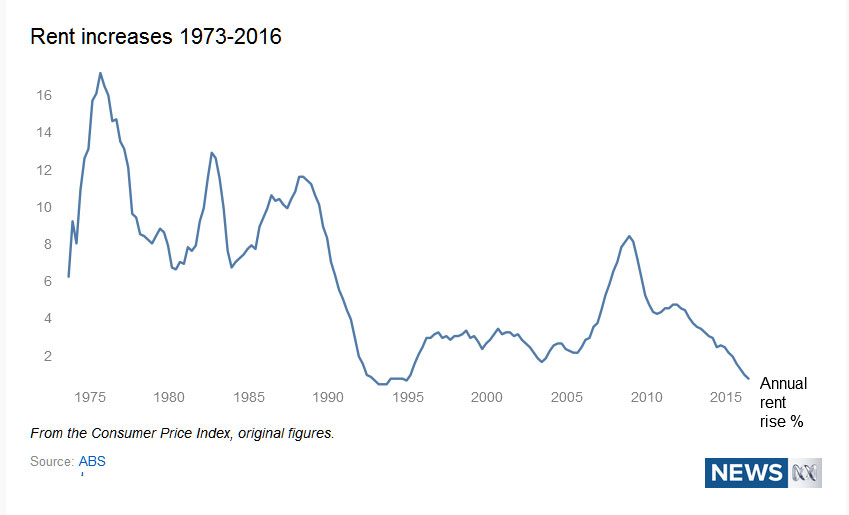
Not only does this mean that you’re unlikely to be slugged by huge rent increases over the next few years while you save up some money to capitalise on a potential house price crash, it also is a sign such a crash may be coming.

You see, low rental growth is a sign of the property glut we talked about earlier.

Even though purchase prices are being bid up by investors, when they go to rent out these places they struggle to find people to fill them, so they discount their rents.

Landlords with existing tenants become reluctant to raise rents because they can find somewhere cheaper to go.

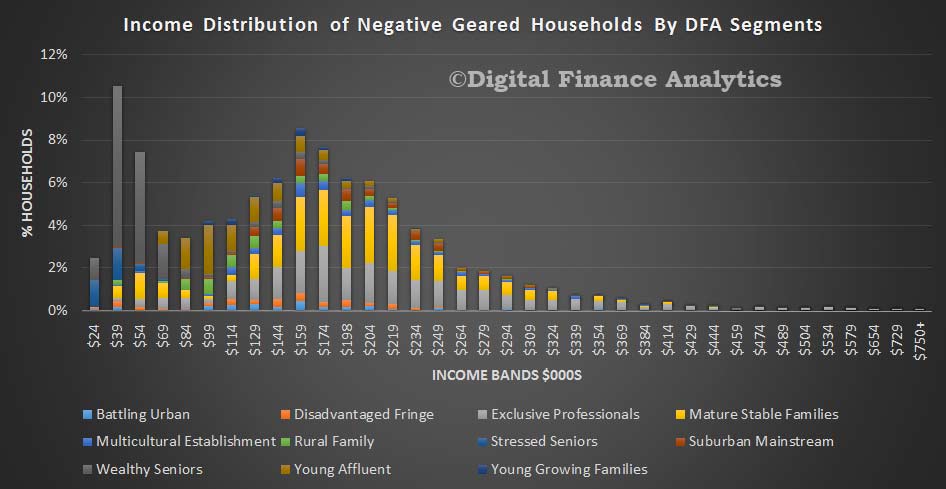
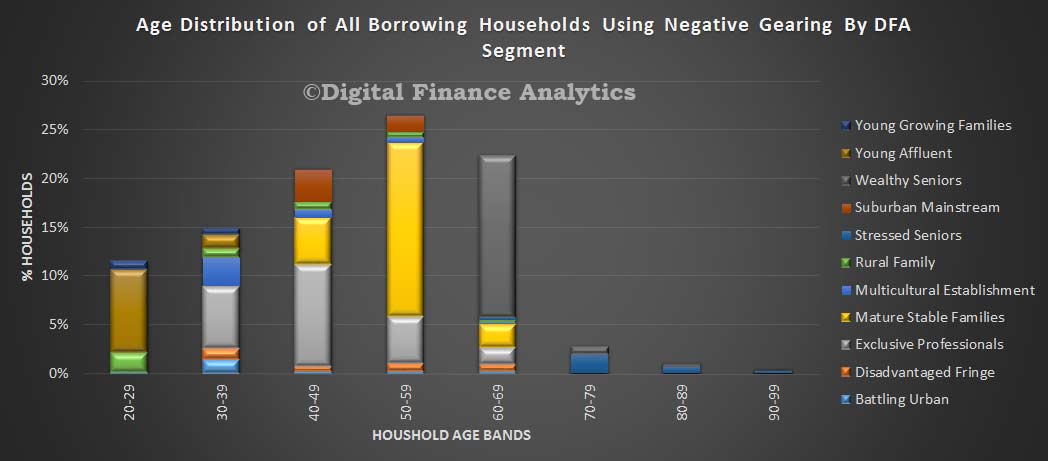
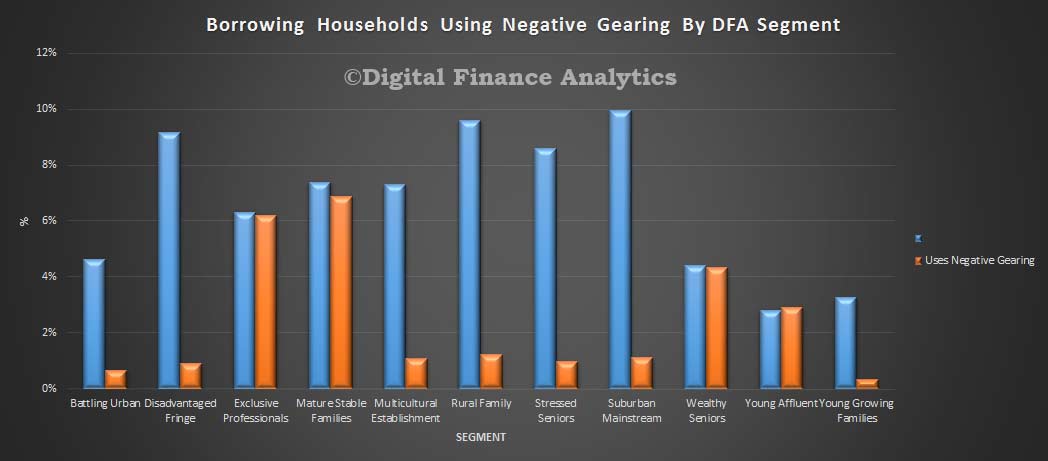
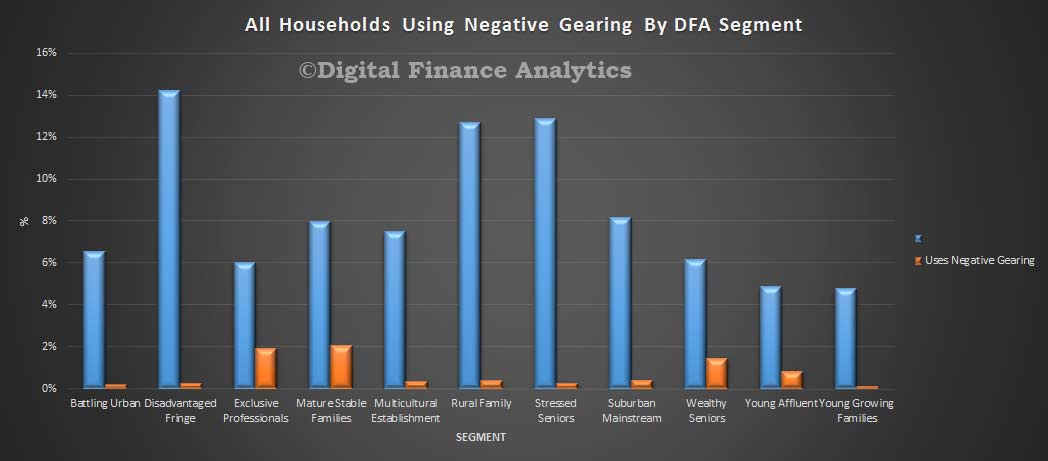
Even though the negative gearing tax break offsets some of these losses for landlords, if there’s no capital gain then they’re still losing dosh, and eventually they’ll sell.

8. Lifestyle

This is where it gets personal. What do you value in life? And I’m not just talking about smashed avo and lattes.

Where do you want to live? If it’s somewhere you can easily afford to rent but can’t afford to buy, then maybe renting for a bit longer while you save is a smart option.

Do you want to keep travelling? Have kids? Change jobs or career down the track?

Remember, a mortgage is often for 25-30 years and selling a home is potentially a lot more complicated and expensive than exiting a lease.

It’s something best done when you have a pretty good idea about where you want to live and prefer stability over flexibility.

Oh, and don’t forget about the negative equity trap that can lock you into keeping a home you don’t want anymore.

There’s plenty of people in Perth, Darwin, and regional Queensland and Western Australia that are learning all about this the hard way.

ABC 7:30 Does Lenders Mortgage Insurance

7:30 did a segment tonight on Lenders Mortgage Insurance (LMI). As we discussed in an earlier post there are a number of issues which make LMI a complex area.  The segment includes comments from DFA.

Households wising to borrow at an LVR above 80% will be required to pay a significant insurance premium to get a mortgage – Lenders Mortgage Insurance. This extra cost may be bundled into their overall mortgage, or will be a large additional cost.

Many households are not clear on what is truly covered by the LMI in case of default. Whilst LMI may protect the bank, households are not necessarily protected.

In addition, the costs of LMI are not necessary transferable, and there are some industry concentration risks caused by the limited market of providers, over and above the captive insurers within the banks.


The Business Does Foreign Property Investors

Interesting segment from the ABC looking at foreign investors, with a focus on Chinese investors. They highlight a number of factors which suggests momentum from this sector may slow.

Loan availability is tightening, and as supply of units in Melbourne and Sydney rise, prices may slide, meaning that some already to committed to purchase off the plan apartments may not be able to complete.

One agent says only 20% of purchasers physically visit the property, and as banks have introduced tough new rules, and the states, surcharges; the market may slow significantly.

That said, some private lenders are filling the mortgage gap though at higher rates and demand still remains.


The Negative Gearing Salvos Continue

The ABC reported that “a Treasury document obtained by the ABC under Freedom of Information (FOI) shows most of the windfall from the property tax break goes to high-income earners.  The modelling said more than half of the negative gearing tax benefits go to the top 20 per cent of incomes in Australia. “Negative gearing benefits high-income families,” the document said.  The report stated those in the bottom 20 per cent were getting just over 5 per cent of negative gearing tax benefits”.

On the other hand, the Government has continued to argue “mum and dad” investors and Australians on average earnings are the main beneficiaries. “It does not change the fact that two thirds of Australians using negative gearing have a taxable income of less than $80,000,” Treasurer Scott Morrison said. This is of course axiomatic, but misses the point, because the whole idea of negative gearing is to offset interest costs and other losses to reduce total income, and therefore taxable income.  Mr Morrison played down the heavily-redacted Treasury submission. “The numbers in the document released by Treasury are not Treasury numbers, but are a summary of a report from an ANU associate professor, Ben Phillips, that Labor uses to justify their negative gearing policy,” he said.

The previously reported RBA FOI had rebutted one of the government’s principal arguments against negative gearing namely that there would be a collapse in home prices. The Grattan Institute had argued for negative gearing reform. You can read the DFA research archive on negative gearing here.

Worth then reflecting on earlier DFA analysis which showed how complex the negative gearing questions is.  We pulled data from the DFA household surveys, to examine the distribution of negative gearing. Our segmented surveys, show some of the nuances in behaviour. We start with age distribution. We find that households of all ages may use negative gearing, but more than a quarter are aged 50-59.  We see the DFA household segmentation in evidence, with a number of young affluent households active aged 20-29, especially using an investment property as an alternative to buying their own place to live. We discussed this before. As we progress up the age bands, we see a strong representation by the more affluent segments, including mature stable families and exclusive professionals. In later life, wealth seniors are also active, especially in the 60-69 year bands. So negative gearing is being used by households across all age groups.

Income-Dist-GearingOur survey suggests that negative gearing, whilst it is spread across the income bands, is indeed concentrated among more affluent households. Four segments, exclusive professionals, mature steady state, wealthy seniors and young affluent households contain the lions share of negative geared investment property. These segments are at different life stages, have different income profiles, and different strategies. For example the young affluent are often using investment property as a potential on-ramp to later owner occupied purchase, whereas wealthy seniors are all about income, and the others more wealth creation.

This analysis shows how complex the true situation is. Prospective changes are likely to impact different segments in diverse ways and there is plenty potential for spill-over impacts and unintended consequences. But the truth is, most negative gearing resides among more affluent households. The current settings are not correct.


Fact Check On Negative Gearing, Using DFA Data

Labor have announced proposals to change the negative gearing and capital gains tax rules relating to property investments. In an interview today on ABC Insiders, Chris Bowen, Shadow Treasurer said that negative gearing would potentially only be available on new property in 2017 , currently half of the benefit goes to top income earners, and proposes changes to CGT concessions, referring to the Murray FSI recommendations. 70% of benefit he says goes to top income earners. What “top” means was not defined.

Expect to see more tax reform shots exchanged as we progress through the year.

We decided to pull data from the DFA household surveys, to examine the distribution of negative gearing. Our segmented surveys, show some of the nuances in behaviour. We start with age distribution. We find that households of all ages may use negative gearing, but more than a quarter are aged 50-59.  We see the DFA household segmentation in evidence, with a number of young affluent households active aged 20-29, especially using an investment property as an alternative to buying their own place to live. We discussed this before. As we progress up the age bands, we see a strong representation by the more affluent segments, including mature stable families and exclusive professionals. In later life, wealth seniors are also active, especially in the 60-69 year bands. So negative gearing is being used by households across all age groups.

Age-GearingThen we looked at distribution, by segment, across the income bands. The horizontal scale shows the upper cut-off in each band, for example, the first is up to $24,000.  Wealth seniors, with lower incomes are well represented in the lower income bands, but as income rises, we see a mix of households using negative gearing. What is true, is that there is a greater proportion of households in the $100-$200k band. Above that, there is a fall in all households represented, but we see those with very large incomes still represented to some extent. Again we see our segments highlighting the strong presence of exclusive professionals and mature stable families.

Income-Dist-GearingIf we then look specifically at borrowing households using negative gearing, as compared to all households in the segments, the picture is quite striking. In our most affluent segment – exclusive professionals, nearly half are using negative gearing for property investment. Wealth seniors and mature steady state families are also well represented. But the most striking observation is that among young affluent households more than half are geared. Other segments are less represented.

Negative-GearingThe final picture is all household, compared with those negatively geared. We see a concentration in the more affluent segments, and other segments where negative gearing hardly exists.

All-Household-Negative-Gearing So, our survey suggests that negative gearing, whilst it is spread across the income bands, is indeed concentrated among more affluent households. Four segments, exclusive professionals, mature steady state, wealthy seniors and young affluent households contain the lions share of negative geared investment property. These segments are at different life stages, have different income profiles, and different strategies. For example the young affluent are often using investment property as a potential on-ramp to later owner occupied purchase, whereas wealthy seniors are all about income, and the others more wealth creation.

This analysis shows how complex the true situation is. Prospective changes are likely to impact different segments in diverse ways and there is plenty potential for spill-over impacts and unintended consequences. But the truth is, most negative gearing resides among more affluent households. The current settings are not correct.

In the RBA’s submission to the Inquiry on Home Ownership, they argue that negative gearing for investment property should be reviewed, because it has the potential to raise risks in the market, lift prices and distort the market.

The UK has just reduced the opportunity for negative gearing, there, and the Grattan Institute also makes a strong case for change.

DFA Comments On Keen Mortgage Pricing, For Some

DFA contributed to a piece on ABC RN Breakfast which discussed the deep discounting currently available for selected mortgage borrowers, reflecting heightened competition, more difficult funding and changes in demand. You can listen to the segment, which also included Sally Tindall, Money Editor, RateCity and Alan Oster, Chief Economist, National Australia Bank. The reporter was Sheryle Bagwell, Business Editor.


ABC Highlights Housing Risk On 7:30

ABC’s 7:30 did a segment on housing risks, and the implications should the bubble burst.  They discussed the risks if interest rates were to rise, against the context of high household debt. SATYAJIT DAS, FINANCIAL ANALYST said “Australians have been playing this Ponzi game of housing where I buy a house and the value goes up and what happens is then I make money by selling it to somebody else and the whole game depends on the buyer always being able to borrow ever larger sums of money and that all depends on incomes and employment, and that side of the economy, the real economy, is looking extremely weak”.

They also flagged the potential for the RBA to cut the cash rate, in response to banks lifting their mortgage rates.