We review the latest lending flow data from the ABS.
https://www.abs.gov.au/AUSSTATS/abs@.nsf/DetailsPage/5601.0Jul%202019?OpenDocument
Digital Finance Analytics (DFA) Blog
"Intelligent Insight"

We review the latest lending flow data from the ABS.
https://www.abs.gov.au/AUSSTATS/abs@.nsf/DetailsPage/5601.0Jul%202019?OpenDocument
We look at the latest data from the ABS on new lending flows.
 Blog")
We discuss the latest ABS research.
https://www.abs.gov.au/AUSSTATS/abs@.nsf/DetailsPage/6160.02011-12%20to%202016-17?OpenDocument
We discuss the latest ABS research.
https://www.abs.gov.au/AUSSTATS/abs@.nsf/DetailsPage/6160.02011-12%20to%202016-17?OpenDocument
The largest quarterly goods and services surplus on record at $19.9 billion and a narrowing net income deficit to $13.9 billion, contributed to Australia recording a seasonally adjusted $5.9 billion current account surplus for the June quarter 2019, according to latest information released by the Australian Bureau of Statistics (ABS). This is Australia’s first current account surplus since the June quarter 1975.
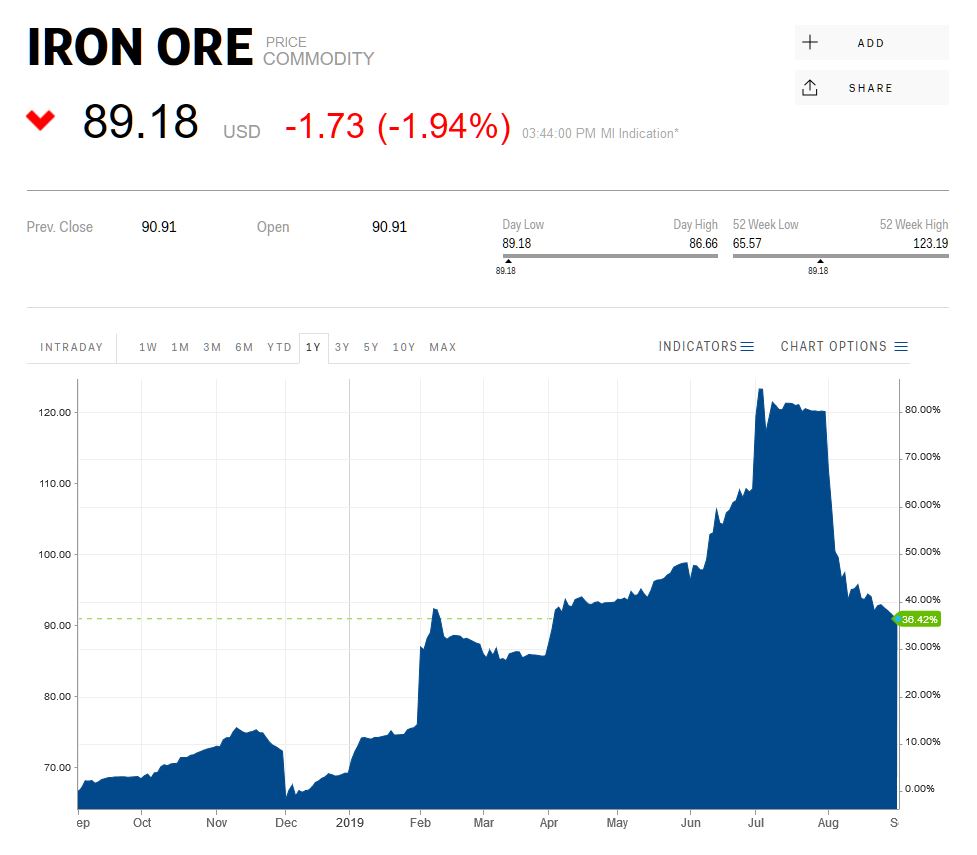
This is thanks to the high iron ore price, which of course has now dropped back significantly. The RBA’s expectation of a 0.8% GDP number tomorrow still seems far fetched, but we might just escape a negative quarter…
The ABS shows this quite clearly.
ABS Chief Economist Bruce Hockman said: “Six consecutive quarters of goods and services surpluses, broadly commodity driven, have laid the foundation for our first current account surplus in 44 years.
“The surplus is both a price and volume story. Similar to the March quarter 2019, continued global supply interruptions have maintained high iron ore prices into the June quarter, boosting our export receipts to record levels.
“Export volumes for the key bulk commodities of liquid natural gas, coal and iron ore were up, while volumes fell across several import categories resulting in an increased June quarter trade surplus.”
Contribution to Gross Domestic Product
In seasonally adjusted chain volume terms, the balance on goods and services surplus increased $2.7 billion, widening the surplus to $6.4 billion. The rising exports and falling imports resulted in an expected contribution of 0.6 percentage points to growth in the June quarter 2019 Gross Domestic Product.
International Investment Position
Australia’s net international investment position was a liability of $1,001.6 billion at 30 June 2019, an increase of $9.2 billion on the revised 31 March 2019 position of $992.3 billion.
Australia’s net foreign debt liability position increased $19.4 billion to $1,143.5 billion. Australia’s net foreign equity asset position increased $10.2 billion to $141.9 billion at 30 June 2019.
Australian retail turnover fell 0.1 per cent in July 2019, seasonally adjusted, according to the latest Australian Bureau of Statistics (ABS) Retail Trade figures.
This follows a rise of 0.4 per cent in June 2019. The trend estimate for Australian retail turnover rose 0.1 per cent in July 2019, following a 0.2 per cent rise in June 2019. Compared to July 2018, the trend estimate rose 2.4 per cent.
“There were falls in four of the six industries and six of the eight states and territories in July,” said Ben James, Director of Quarterly Economy Wide Surveys. “Cafes, restaurants and takeaway services (-0.6 per cent) led the falls. There were also falls in Clothing, footwear and personal accessory retailing (-1.0 per cent), Other retailing (-0.4 per cent), and Department stores (-0.2 per cent). Food retailing (0.3 per cent), and Household goods retailing (0.1 per cent) rose this month”.
In seasonally adjusted terms, there were falls in Queensland (-0.2 per cent), New South Wales (-0.1 per cent), South Australia (-0.5 per cent), Victoria (-0.1 per cent), the Australian Capital Territory (-0.5 per cent), and Tasmania (-0.1 per cent). There were rises in Western Australia (0.6 per cent), and the Northern Territory (0.3 per cent).
Online retail turnover contributed 6.1 per cent to total retail turnover in original terms in July 2019. This is unchanged from June 2019. In July 2018, online retail turnover contributed 5.5 per cent to total retail.
We discuss the latest credit data from the RBA, APRA and also building approvals from the ABS. Wall to wall disappointment!
https://www.rba.gov.au/statistics/frequency/fin-agg/2019/fin-agg-0719.html
https://www.abs.gov.au/AUSSTATS/abs@.nsf/DetailsPage/8731.0Jul%202019?OpenDocument
The ABS released the Capital Expenditure estimates to June 2019 today.
They said that the trend estimate for total new capital expenditure fell by 0.7% in the June quarter 2019 while the seasonally adjusted estimate fell by 0.5%.
The trend estimate for buildings and structures fell by 1.8% in the June quarter 2019 while the seasonally adjusted estimate fell by 3.3%.
The trend estimate for equipment, plant and machinery rose by 0.6% in the June quarter 2019 while the seasonally adjusted estimate rose by 2.5%
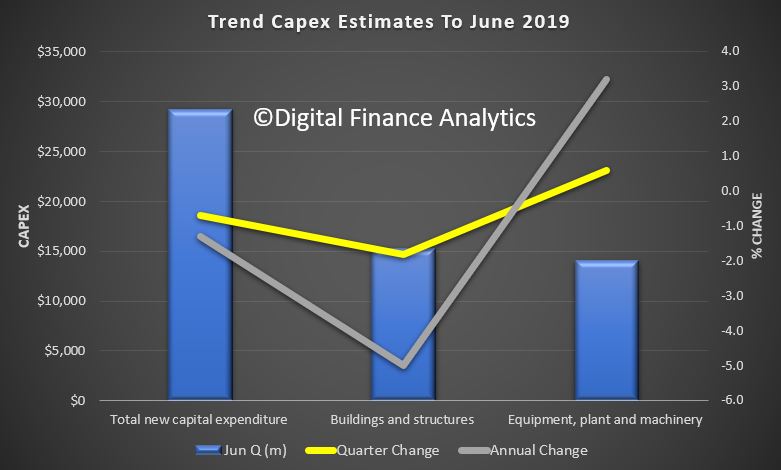
The annual trend changes were down 1.3% overall, with buildings and structures down 5% and equipment plant and machinery up 3.2%.
Overall this will likely reduce the already weak-looking GDP out turn.
Looking ahead the estimates do not look too bad, but given the external and local risk factors, the final results may be lower.
Total capital expenditure
Buildings and structures
The ABS released their June 2019 “Construction Work Done, Australia, Preliminary” today. It paints a picture of slowing momentum once again. This will flow into a weaker GDP number ahead.
The trend estimate for total construction work done fell 2.7% in the June quarter 2019.
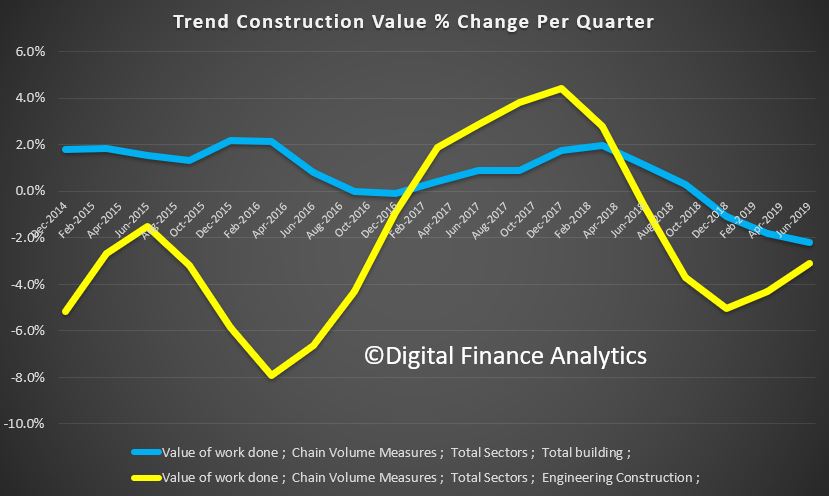
The seasonally adjusted estimate for total construction work done fell 3.8% to $48,778.0m in the June quarter.
The trend estimate for total building work done fell 2.2% in the June quarter 2019.

The trend estimate for non-residential building work done fell 0.8% and residential building work fell 3.0%.
The seasonally adjusted estimate of total building work done fell 5.7% to $28,506.2m in the June quarter.
The trend estimate for engineering work done fell 3.1% in the June quarter.
The seasonally adjusted estimate for engineering work done fell 1.1% to $20,271.8m in the June quarter.
The construction sector is in a downtrend, with activity having peaked in mid-2018. This reflects: (1) the turning down of the home building cycle; (2) a pull-back in public works; and (3) a further winding down of private infrastructure activity led by the mining sector (although this dynamic has largely run its course).
With the construction sector representing around 13% of the economy this result will dent Q2 GDP, potentially in the order of 0.4ppts – depending upon how these quarterly partials flow through to the national accounts estimates.
The housing downturn still has further to go and will weigh on conditions throughout 2019 and into 2020.
On public works, there is a sizeable work pipeline and governments are adding projects to the investment pipeline – suggesting that the segment will be more supportive of conditions over the forecast period. On private infrastructure, commencements have picked-up somewhat (eg some iron ore projects have proceeded in response to the recent elevated prices) and the work pipeline has increased – pointing to an emerging lift in activity during the year ahead.
Australia’s trend unemployment rate increased in July 2019 to 5.3 per cent, from 5.2 per cent in June, according to the latest information released by the Australian Bureau of Statistics (ABS).
ABS Chief Economist Bruce Hockman said: “Australia’s trend unemployment rate increased to 5.3 per cent in July 2019, the same level as this time last year.”
“The trend participation rate increased further to 66.1 per cent, while employment growth continues to show strength,” added Mr Hockman.
Employment and hours
In July 2019, trend monthly employment increased by around 24,600 persons. Full-time employment increased by 15,100 persons and part-time employment increased by 9,600 persons.
Over the past year, trend employment increased by 339,200 persons (2.7 per cent) which was above the average annual growth over the past 20 years (2.0 per cent).
The trend monthly hours worked increased by less than 0.1 per cent in
July 2019 and by 1.8 per cent over the past year. This was slightly
above the 20 year average year-on-year growth of 1.7 per cent.
Underemployment and underutilisation
The trend monthly underemployment rate remained steady at 8.4 per cent
in July with no changes over the past year. The trend underutilisation
rate decreased by 0.1 percentage points over the year.
States and territories trend unemployment rate
The trend unemployment rate remained steady in most states and
territories, except for South Australia (up 0.2 percentage points) and
Queensland and Northern Territory (up 0.1 percentage points).
Over the year, unemployment rates fell in New South Wales, Victoria,
Western Australia and the Australian Capital Territory, and increased in
Queensland, South Australia, Tasmania and the Northern Territory.