Australia’s current account deficit in seasonally adjusted terms decreased $3,582 million in the December quarter 2018 to $7,203 million driven mainly by increased goods and services exports, according to latest figures from the Australian Bureau of Statistics (ABS).
Australia’s net foreign debt liability position increased $35.4 billion to $1,082.9 billion., up 3%.
More downward pressure on the GDP? It looks like the economy has lost considerable momentum over the second half of 2018, thanks to whats happening in housing and weak consumer spending.
The balance on goods and services surplus in the December quarter 2018 was $8,425 million, a rise of $2,661 million. Exports of goods and services rose $3,676 million (3 per cent) and imports of goods and services rose $1,015 million (1 per cent). The net primary income deficit narrowed by $848 million to $15,318 million in the December quarter 2018.
In volume terms, falling exports and rising imports resulted in an expectation for international trade to detract 0.2 percentage points from growth in the December quarter 2018 Gross Domestic Product. In seasonally adjusted chain volume terms, the balance on goods and services surplus decreased $781 million, narrowing the surplus to $1,241 million.
Australia’s net international investment position was a liability of $975.7 billion at 31 December 2018, an increase of $36.5 billion on the revised 30 September 2018 position of $939.1 billion.
Australia’s net foreign debt liability position increased $35.4
billion to $1,082.9 billion. Australia’s net foreign equity asset
position decreased $1.1 billion to $107.2 billion at 31 December 2018
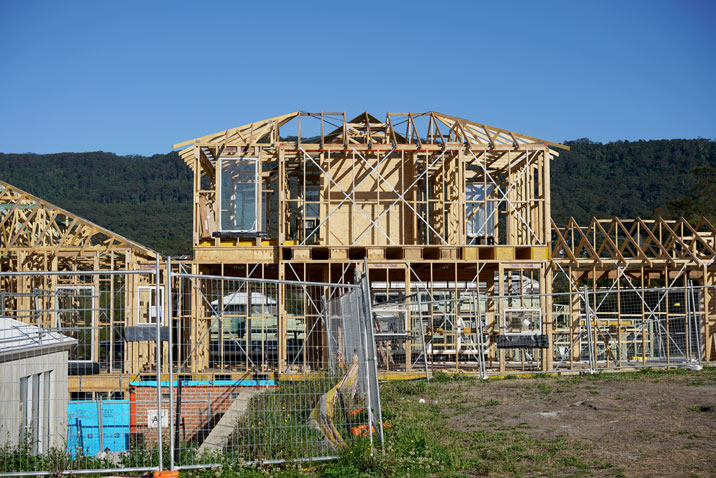
The number of dwellings approved in Australia fell by 3.2 per cent in January 2019, in trend terms, according to data released by the Australian Bureau of Statistics (ABS) today.
“The trend for the total dwelling approvals series has steadily declined over the past year,” said Justin Lokhorst, Director of Construction Statistics at the ABS. “The series is now at its lowest level since May 2013.”
The decrease in January was driven by private sector dwellings excluding houses (e.g. townhouses and apartments), which fell 8.1 per cent in trend terms.
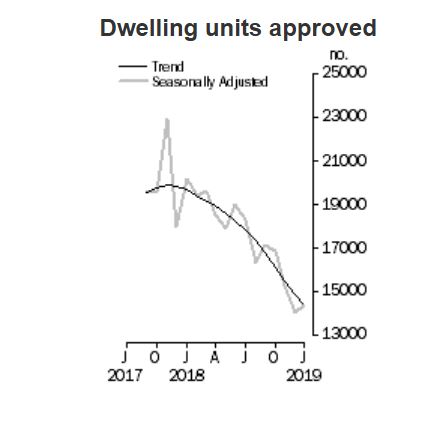
Private sector houses also declined, by 0.4 per cent.
Among the states and territories, total dwelling approvals fell in January in the Australian Capital Territory (19.8 per cent), the Northern Territory (8.0 per cent), Victoria (4.5 per cent), Queensland (3.9 per cent), New South Wales (2.3 per cent) and South Australia (0.8 per cent) in trend terms. Western Australia (2.2 per cent) and Tasmania (1.4 per cent) recorded increases.
Approvals for private sector houses fell 0.4 per cent in January in trend terms. Queensland (1.4 per cent), New South Wales (0.6 per cent) and Victoria (0.3 per cent) declined, while increases were recorded in South Australia (2.3 per cent) and Western Australia (0.2 per cent).
In seasonally adjusted terms, total dwellings rose by 2.5 per cent in January, driven by rises in Western Australia (28.8 per cent), Tasmania (15.4 per cent) and New South Wales (12.0 per cent). Private dwellings excluding houses rose 2.7 per cent, while private houses also increased (by 2.1 per cent).
But as Westpac put it ” As a rule, January housing data should be taken with a large grain of salt – the low flows through the holiday period mean any month to month noise is amplified by seasonal adjustment”.
The value of total building approved fell 1.5 per cent in January, in trend terms, and has fallen for 14 months. The value of residential building fell 2.7 per cent, while non-residential building rose 0.4 per cent.
Australia’s trend unemployment rate remained steady in January 2019 at 5.1 per cent, from a revised December 2018 figure, according to the latest information released by the Australian Bureau of Statistics (ABS).
ABS Chief Economist Bruce Hockman said: “The unemployment rate has remained at 5.1 per cent for a second month, supported by strong participation in the labour force, at 65.7 per cent.” Employment and hours
In January 2019, trend monthly employment increased by 24,900 persons. Full-time employment increased by 16,800 persons and part-time employment increased by 8,100 persons.
Over the past year, trend employment increased by 295,500 persons (2.4 per cent) which was above the average annual growth over the past 20 years (2.0 per cent).
The trend employment to population ratio, which shows how employed the population is, rose to a 10 year high of 62.4 per cent.
“The 15-64 year old employment to population ratio reached a historical high of 74.1 per cent, with almost three of every four ‘working age’ Australians now employed”, Mr Hockman said.
The trend monthly hours worked increased by 0.1 per cent in January 2019 and by 1.6 per cent over the past year. This was slightly below the 20 year average year-on-year growth of 1.7 per cent.
The trend monthly underemployment rate remained steady at 8.3 per cent and decreased by 0.3 percentage points over the year. The trend underutilisation rate also remained steady at 13.3 per cent, and decreased by 0.7 percentage points over the past year.
States and territories
The trend unemployment rate increased in South Australia, Western Australia and Tasmania, decreased in New South Wales and Queensland, and remained steady in all other states and territories.
In January 2019, increases in trend employment were observed in most states and territories except Western Australia (down 1,700 persons),Tasmania (down 300 persons) and South Australia (down 200 persons). The largest increases were in New South Wales (up 11,200 persons), followed by Victoria (up 10,300 persons) and Queensland (up 3,500 persons).
Over the past year, increases in employment were observed in all states except Tasmania (down 1,400 persons). Both territories recorded falls in employment (the Northern Territory down 2,500 persons and the Australian Capital Territory down 2,300 persons). The largest increases were in New South Wales (up 133,900 persons), Victoria (up 118,800 persons) and Queensland (up 27,800 persons). The highest annual employment growth rates were in Victoria at 3.7%, followed by New South Wales at 3.4% and Queensland at 1.1%. New South Wales and Victoria were the only states to have a year-on-year growth rate in trend employment above their 20 year average. The monthly trend unemployment rate increased by 0.1 pts in Western Australia (6.6%) and Tasmania (6.2%). It increased by less than 0.1 pts in South Australia (6.0%) and the Northern Territory (5.0%). It remained unchanged in Victoria (4.5%) and the Australian Capital Territory (3.5%). It decreased by 0.1 pts in New South Wales (4.1%) and less than 0.1 pts in Queensland (6.1%).
The monthly trend underemployment rate increased in the Northern Territory (up 0.3 pts to 5.0%) and Victoria (up 0.1 pts to 8.2%). Decreases were seen in Tasmania (down 0.2 pts to 9.6%), Western Australia (down 0.1 pts to 9.2%) and the Australian Capital Territory (down 0.1 pts to 6.3%).
Increases to the trend participation rate were observed in the Northern Territory (up by 0.2 pts to 74.8%), South Australia (up by less than 0.1 pts to 62.8%), New South Wales (up by less than 0.1 pts to 65.1%) and Victoria (up by less than 0.1 pts to 65.9%). Decreases were observed in Tasmania (down 0.1 pts to 60.1%) and the Australian Capital Territory (down 0.1 pts to 69.6%). The monthly trend participation rate remained unchanged in Queensland (65.6%) and Western Australia (68.5%).
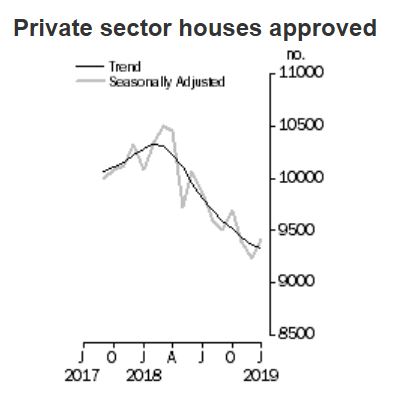
The trend Wage Price Index (WPI) rose 0.5 per cent in December quarter 2018 and 2.3 per cent through the year, according to figures released today by the Australian Bureau of Statistics (ABS). Growth remains anemic.
The trend quarterly rise of 0.5 per cent continues an extended period of moderate hourly wage growth. Annually, private sector wages rose 2.3 per cent and public sector wages grew 2.5 per cent.
ABS Chief Economist Bruce Hockman said that the annual rates of growth in the private sector have been lower than those recorded for the public sector over the last four years.
Remember that from last July the Fair Work Commission lifted the minimum wage by 3.5%. This factor impacted more than 2 million workers and has been responsible for lifting the overall results. But many households have seen no uplift at all.
In original terms, annual growth to the December quarter 2018 ranged from 1.6 per cent for the Information Media and telecommunication services industry to 2.8 per cent for the Electricity, gas, water and waste services and Health care and social assistance industries.
Western Australia once again recorded the lowest through the year wage growth of 1.6 per cent while Victoria recorded the highest of 2.7 per cent.
So if wages growth is stirring, its at the margin, and hardly noticeable.
“This report finds that trends in wages growth across the various measures considered have been fairly similar over the last 20 years. However, growth across these measures has been below the long-term average over the last five or so years,” it said, noting a relatively steady fall in growth rates since the global financial crisis (GFC).
Among the various reasons investigated by the report as potential contributors to low wage growth were the rates of unemployment and inflation, productivity, as well as “structural factors” such as changes across different industries, technology — particularly automation and the gig economy — and changes in employee bargaining power”.
The ABS has released the first in its new combined series of household and business finance – “ 5601.0 – Lending to households and businesses, Australia, Dec 2018″.
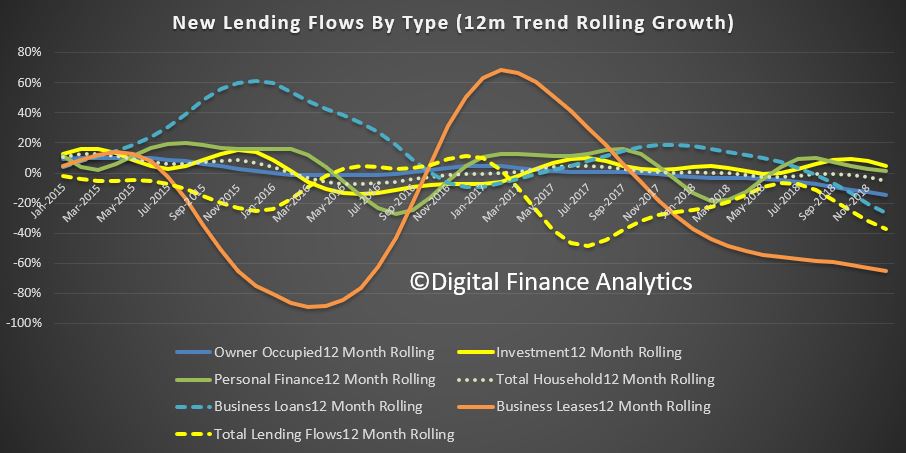
The new data required a rebuild of our analytics, but it is very clear that the rate of growth of new credit continues to ease across the board. The focus of the release is credit flows, the rate of new loans being written. The RBA of course reports the stock at the economy level, and APRA the Bank (ADI) stock. Today we look at the flow data.
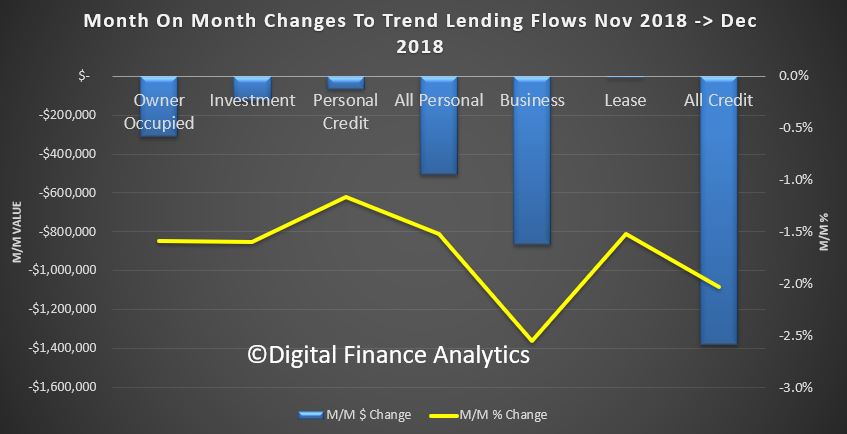
Owner Occupied lending flows fell by 1.59% from November to December, down $310 million dollars. Investment lending fell 1.6%, down $125 million dollars and personal credit fell 1.17%, down $68 million dollars. Total credit flows to households fell 1.52% down $506 million dollars. Business credit flows fell 2.55%, down $866 million dollars and total credit flows dropped 2.03% by $1.38 billion dollars, to $66.5 billion dollars.
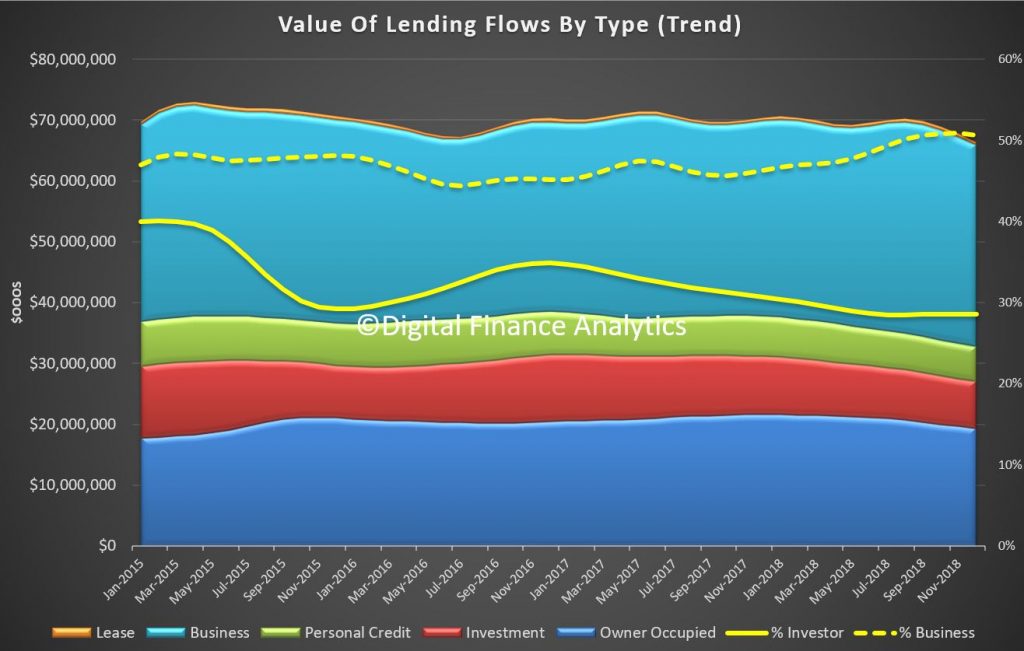
The share of investment loan flows for residential property was 28.5% of housing flows, and lending for business fell to 50.6% of all credit flows.
The credit impulse (the rate of change of credit growth) continues to ease, which signals a weaker economy, and lower home prices ahead. Significantly, owner occupied lending is slowing faster than investor lending now.
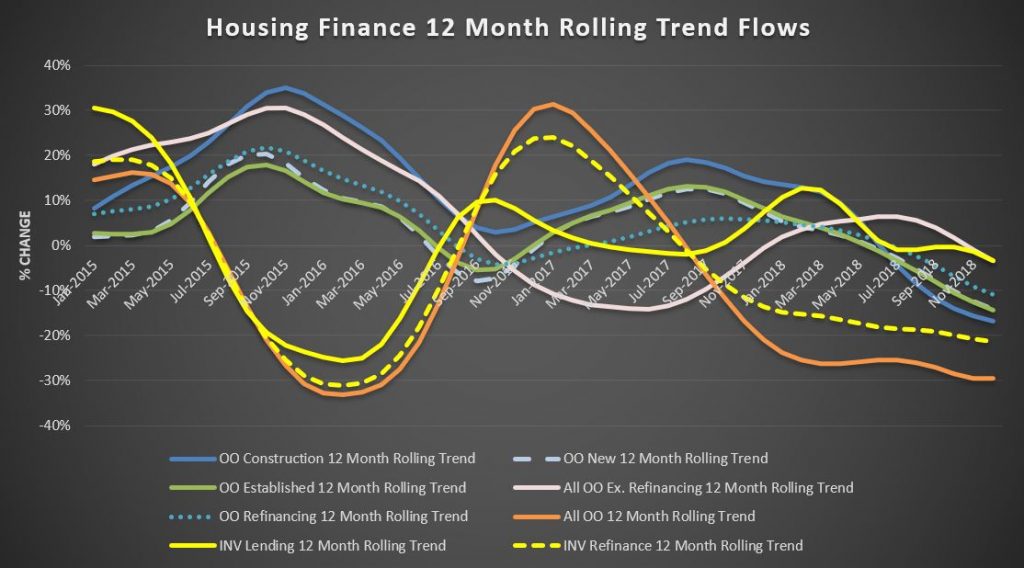
Within the housing categories the rolling 12 month growth rates in credit flows shows that owner occupied construction are down 16.7%, finance for new builds is down 14,2%, finance for established property is down 14.3% and refinanced loans is down 10.9% over 12 months. New investment loan flows fell 3.4% and refinanced investor loans was down 21.3%, which is a significant drop. These are the factors which feed into my overall home price models, and this downward momentum of the credit impulse is highly significant, and why I am looking for more home price falls ahead. Note again, its the owner occupied sector on the slide, not just property investors!
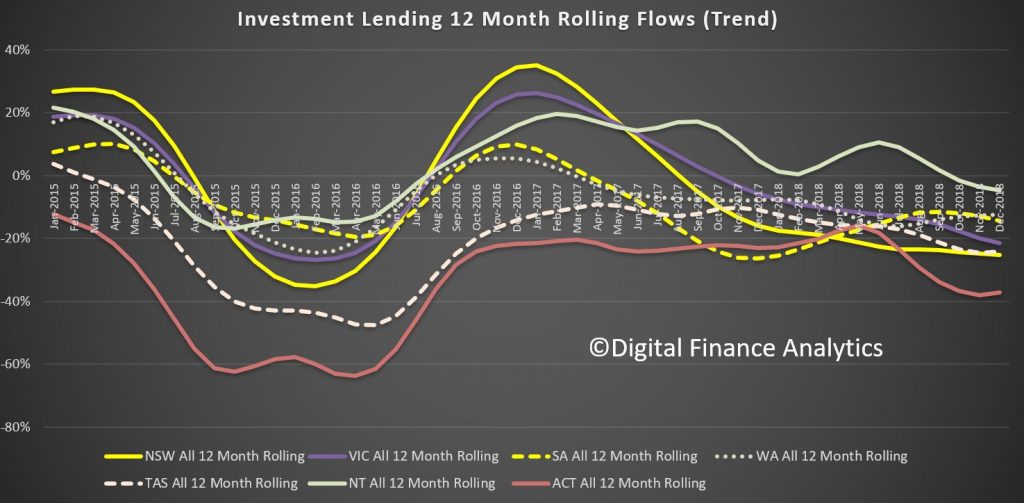
We can look at credit flows for investor purposes across the states. NSW is down more than 25%, VIC down 21.5%, SA down 14%, WA down 12% TAS down 24%, NT down 4.7% and ACT down a massive 37%; all over the past 12 months.
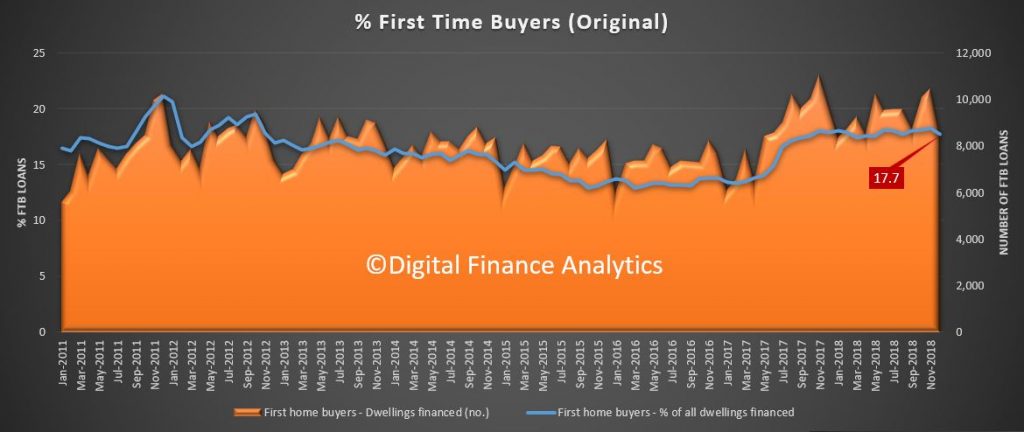
First time buyers continue at a lower rate as our tracker shows, with 17.7% of new loans for first time buyers, down from 18.3% last month, a drop of 1,976 transactions compared with last month, to 8,517.
In addition the number of first time property investor buyers dropped again.
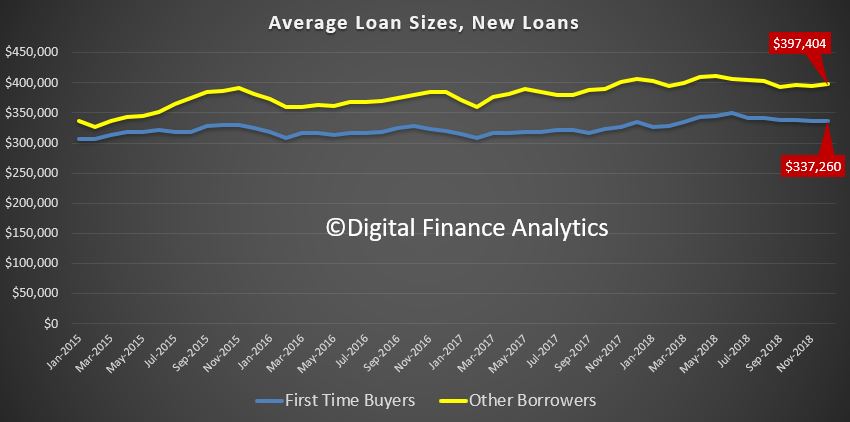
The average loan size for a first time buyer fell to $337,260, indicating tighter lending standards, while other loans were bigger at $397,404.
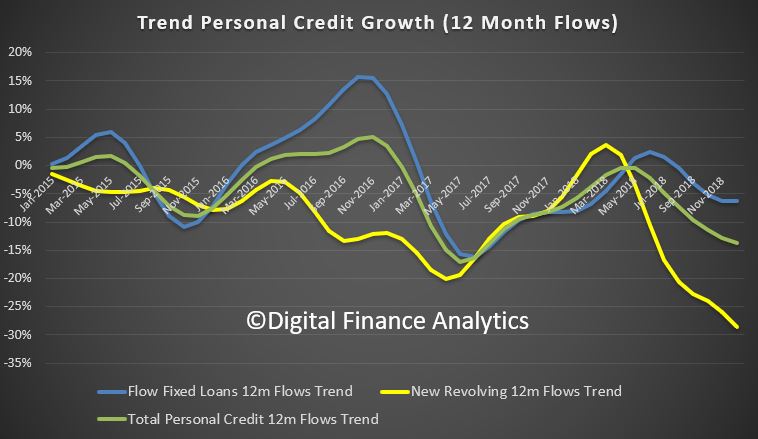
Finally, personal credit flows were down again, with new revolving loans especially hard hit.
The Credit Tide Is Receding
In conclusion, there is nothing in this data to suggest increased momentum in credit, but then this is in December, and before the APRA statement that lending standards will remain tight (7% hurdle rate applies) and the Royal Commission left responsible lending rules where they were.
My conclusion is that the credit impulse will continue to slow. This will have a flow on effect to home prices and household consumption. The decade of credit driven expansion looks to be over for now. The problem is of course this will lead to weaker economic out-turns ahead, and falling home prices.
That said, credit is still growing unsustainably faster than income or inflation with housing credit at 4.9% growth over 12 month. But the rate of growth, as we showed here is easing back.
And I do not think the credit tap will be opened up “to 11” again anytime soon. Welcome to a new, but uncomfortable normal. One in which those with loans they should never have had in the first place continue to struggle with them, and new borrowers, should they chose to borrow, will need to jump through a whole series of higher hoops.
20-30% peak to trough falls in home prices anyone?
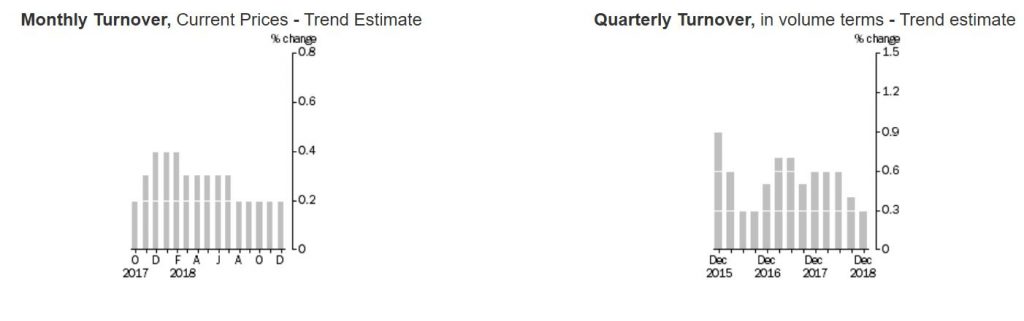
Australian retail turnover fell 0.4 per cent in December 2018, seasonally adjusted, according to the latest Australian Bureau of Statistics (ABS) Retail Trade figures.
This confirms the earlier data, which shows households just do not have the money to spend, (and spent in November to get the discounts).
This follows a 0.5 per cent rise in November 2018.
“Household goods (-2.8 per cent) and Clothing and footwear (-2.4 per cent) led the falls after strong rises in November from Black Friday promotions,” said Ben James, Director of Quarterly Economy Wide Surveys. “There were also falls in Department stores (-1.1 per cent) and Other retailing (-0.1 per cent).”
The falls were partially offset by rises in Food retailing (0.5 per cent) and Cafes, restaurants and takeaway food services (1.1 per cent).
In seasonally adjusted terms, there were falls in New South Wales (-0.6 per cent), Victoria (-0.5 per cent), the Australian Capital Territory (-1.8 per cent), Queensland (-0.1 per cent), South Australia (-0.3 per cent), the Northern Territory (-0.3 per cent), and Tasmania (-0.2 per cent.). The only state to have a rise in December 2018 was Western Australia (0.1 per cent).
Online retail turnover contributed 5.6 per cent to total retail turnover in original terms in December 2018, down from 6.6 per cent in November 2018, highlighting the increasing importance of the November month for online sales. In December 2017 online retail turnover contributed 4.8 per cent to total retail.
The trend estimate for Australian retail turnover rose 0.2 per cent in December 2018, following a rise of 0.2 per cent in November 2018. Compared to December 2017, the trend estimate rose 3.2 per cent.
For the December quarter 2018, there was a 0.1 per cent rise in seasonally adjusted volume terms. This follows a rise of 0.2 per cent in the September quarter 2018. The quarterly rise in volumes was led by Clothing and footwear (2.7 per cent), and Department stores (0.7 per cent). Food retailing (-0.2 per cent), Other retailing (-0.5 per cent), Cafes, restaurants and takeaway food services (-0.5 per cent), and Household goods (-0.3 per cent) fell in seasonally adjusted volume terms.
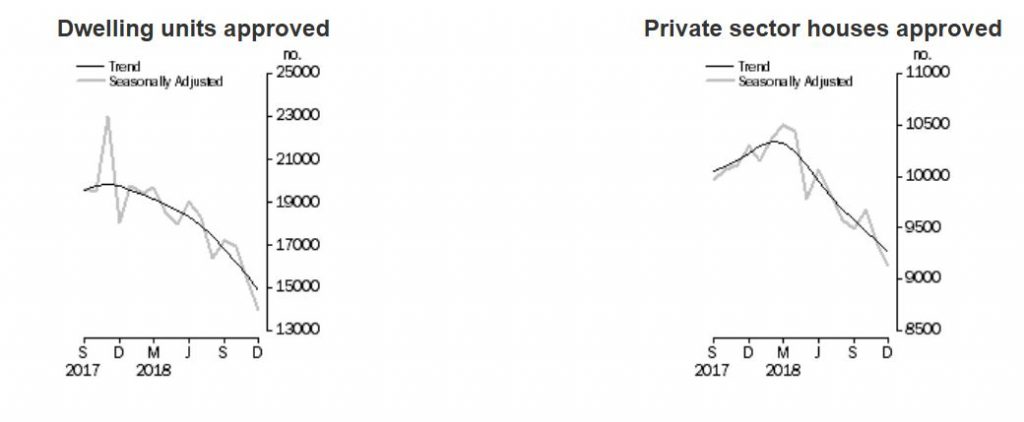
The number of dwellings approved in Australia fell by 4.1 per cent in December 2018, in trend terms, according to data released by the Australian Bureau of Statistics (ABS) today.
“The trend for the total dwelling approvals series has continued to decline over the past year,” said Daniel Rossi, Director of Construction Statistics at the ABS. “The series is now at its lowest level since June 2013.”
The decrease in December was driven by private sector dwellings excluding houses (e.g. townhouses and apartments), which fell 8.5 per cent. Private sector houses also declined, by 1.1 per cent.
Among the states and territories, dwelling approvals fell in December in the Australian Capital Territory (21.3 per cent), Queensland (6.5 per cent), New South Wales (5.0 per cent), Western Australia (3.8 per cent), South Australia (1.5 per cent) and Victoria (1.4 per cent) in trend terms. The Northern Territory (1.7 per cent) and Tasmania (1.1 per cent) recorded increases.
Approvals for private sector houses fell 1.1 per cent in December in trend terms. Queensland (3.6 per cent), New South Wales (1.6 per cent) and Western Australia (0.6 per cent) declined, while increases were recorded in South Australia (0.6 per cent) and Victoria (0.2 per cent).
In seasonally adjusted terms, total dwellings fell by 8.4 per cent in December, driven by a 18.8 per cent decrease in private dwellings excluding houses. Private houses also fell 2.2 per cent.
The value of total building approved fell 1.5 per cent in December, in trend terms, and has fallen for the past 13 months. The value of residential building fell 2.6 per cent, while non-residential building rose 0.2 per cent.
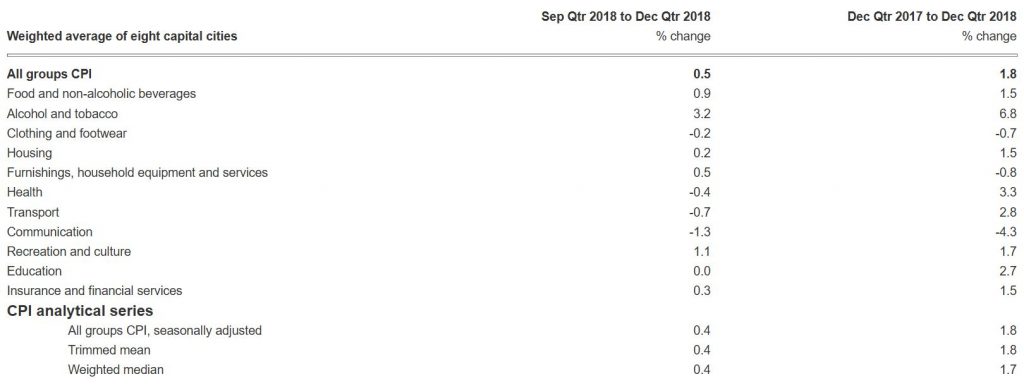
The ABS reports that the Consumer Price Index (CPI) rose 0.5 per cent in the December quarter 2018, which follows a rise of 0.4 per cent in the September quarter.
This means that inflation, on the official measures remains BELOW the RBA’s target range of 2-3%, at 1.8% and may suggest more of a bias towards cutting the cash rate (as we have been suggesting for some time).
Of course the “official” figures bear little resemblance to the real lived experience of many households – and the rental proxy for housing in the figures is understating the real expense of many with mortgages. In fact, one reason why the RBA policy levers look pretty sick is the fact that TRUE inflation in real households is closer to 3.5%, on average and for some even higher. They dropped the cash rate too far and now cannot recover.
The upshot is real net disposable income, after expenditure on necessities is all but shot for many, given the anemic wages growth. This explains why household financial confidence is falling away, as we reported before.
This is how the ABS broke the figures down.
The most significant rises in the December quarter are tobacco (+9.4 per cent), domestic holiday travel and accommodation (+6.2 per cent), fruit (+5.0 per cent), new dwellings purchased by owner-occupiers (+0.4 per cent) and furniture (+1.8 per cent). The rise is partially offset by falls in automotive fuel (-2.5 per cent), audio visual and computing equipment (-3.3 per cent), wine (-1.9 per cent) and telecommunications equipment and services (-1.5 per cent).
While automotive fuel rose 3.3 per cent in October, falls in November and December of 10.8 per cent and 5.0 per cent respectively resulted in a decrease across the quarter of 2.5 per cent.
The CPI rose 1.8 per cent through the year to the December quarter 2018, after increasing 1.9 per cent through the year to the September quarter.
ABS Chief Economist, Bruce Hockman said: “Annual growth in the CPI remains below 2 per cent in the December quarter 2018, with annual growth in tradables inflation of just 0.6 per cent, while non-tradables inflation rose 2.4 per cent. Over the past four years, annual growth in the CPI has only risen above 2 per cent in two of the past 16 quarters.”
The ABS released the latest employment data for December, and reported a trend estimate of employment increased by 23,100 persons in December 2018, with:
the number of unemployed persons decreasing by 3,200 persons;
the unemployment rate remaining steady at 5.0%;
the participation rate remaining steady at 65.6%; and
the employment to population ratio remaining steady at 62.3%.
In fact they revised down last months data to get to the 5%, where it remained in December. This will temper any RBA response to the falling housing market in our view.
Graph 1, Employment to population ratio, Persons, December 2008 to December 2018
The monthly trend unemployment rate increased by 0.1 pts in Western Australia (6.4%) and the Northern Territory (5.0%). It remained unchanged in New South Wales (4.3%), Queensland (6.2%), South Australia (5.8%), Tasmania (5.8%) and the Australian Capital Territory (3.6%). It decreased 0.1 pts in Victoria (4.4%).
They say that over the past year, trend employment increased by 284,100 persons (or 2.3%), which was above the average annual growth rate over the past 20 years of 2.0%. Over the same 12 month period the trend employment to population ratio, which is a measure of how employed the population (aged 15 years and over) is, increased by 0.4 percentage points (pts) to 62.3%.
In monthly terms, trend employment increased by 23,100 persons between November and December 2018. This represents an increase of 0.18%, which was above the monthly average growth rate over the past 20 years of 0.16%.
Underpinning these net changes in employment is extensive dynamic change, which occurs each month in the labour market. In recent months there has generally been around 300,000 people entering and leaving employment in the month. There is also further dynamic change in the hours that people work, which results in changes in the full-time and part-time composition of employment.
In net terms, trend full-time employment increased by 11,800 persons between November and December 2018, and part-time employment increased by 11,200 persons. Compared to a year ago, there are 189,900 more persons employed full-time and 94,200 more persons employed part-time. This compositional shift led to an increase in the part-time share of employment over the past 12 months, from 31.5% to 31.6%.
The trend estimate of monthly hours worked in all jobs increased by 1.1 million hours (or 0.1%) in December 2018, to 1,759.9 million hours. Monthly hours worked increased by 1.5% over the past year, which was below the increase in employed persons (2.3%). The average hours worked per employed person was 138.5 hours per month, or around 31.9 hour per week.
The trend unemployment rate remained steady at 5.0% in December 2018. The number of unemployed persons decreased by 3,200 to 670,900 persons. Over the past year, the trend unemployment rate decreased by 0.5%, with the number of unemployed decreasing by 46,900 persons.
The trend participation rate remained steady at 65.6% in December 2018. The female participation rate increased to 60.5% and the male participation rate remained steady at 70.9%.
The labour force includes the total number of employed and unemployed persons. Over the past year, the labour force increased by 237,200 persons (1.8%). This rate of increase was above the rate of increase for the total Civilian Population aged 15 years and over (339,900 persons, or 1.7%).
The trend participation rate for 15-64 year olds, which controls (in part) for the effects of an ageing population remained steady at 78.0%. The gap between male and female participation rates in this age range is less than 10 pts, at 82.8% and 73.3% respectively, continuing the long term convergence of male and female participation.
The trend participation rate for 15-24 year olds (who are often referred to as the “youth” group in the labour market) remained steady at 67.9%. The unemployment rate for this group remained steady at 11.3% in December 2018 and decreased by 1.0 pts over the year.
The trend series smooths the more volatile seasonally adjusted estimates and provide the best measure of the underlying behaviour of the labour market.
SEASONALLY ADJUSTED ESTIMATES
Seasonally adjusted employment increased by 21,600 persons from November to December 2018. The underlying composition of the net change was a decrease of 3,000 persons in full-time employment and an increase of 24,600 persons in part-time employment. Since December 2017, full-time employment increased by 162,000 persons, while part-time employment increased by 106,600 persons.
Seasonally adjusted monthly hours worked in all jobs increased by 1.3 million hours (or 0.1%) in December to 1,758.9 million hours.
The seasonally adjusted employment to population increased by less than 0.1 pts to 62.4% in December 2018, and increased by 0.3 pts from the same time last year.
The seasonally adjusted unemployment rate decreased by 0.1 pts to
5.0% in December 2018. The participation rate decreased by less than
0.1 pts to 65.6%.
STATE AND TERRITORY ESTIMATES
TREND ESTIMATES
In December 2018, increases in trend employment were observed in the
majority of states and territories. The largest increases were in
Victoria (up 12,000 persons), followed by New South Wales (up 6,400
persons) and Queensland (up 6,000 persons). Employment fell in Western
Australia (down 500 persons), Tasmania (down 200 persons) and the
Australian Capital Territory (down 200 persons).
Over the past year, increases in employment were observed in all states
except Tasmania (down 300 persons). Both territories recorded falls in
employment (the Australian Capital Territory down 4,500 persons and the
Northern Territory down 3,200 persons). The largest increases were in
New South Wales (up 114,800 persons), Victoria (up 114,300 persons) and
Queensland (up 35,200 persons). The highest annual employment growth
rates were in Victoria at 3.5%, followed by New South Wales at 2.9% and
Queensland at 1.4%. New South Wales and Victoria were the only states to
have a year-on-year growth rate in trend employment above their 20 year
average.
The monthly trend unemployment rate increased by 0.1 pts in Western
Australia (6.4%) and the Northern Territory (5.0%). It remained
unchanged in New South Wales (4.3%), Queensland (6.2%), South Australia
(5.8%), Tasmania (5.8%) and the Australian Capital Territory (3.6%). It
decreased 0.1 pts in Victoria (4.4%).
The only increase in the trend participation rate was in Victoria (up
0.1 pts to 65.8%). Decreases were observed in Tasmania (down 0.2 pts to
60.2%), Australian Capital Territory (down 0.2 pts to 69.4%) and New
South Wales (down 0.1 pts to 64.8%). The monthly trend participation
rate remained unchanged in all remaining states and territories.
SEASONALLY ADJUSTED ESTIMATES
In seasonally adjusted terms, the largest increase in employment was in
Queensland (up 11,600 persons), followed by Victoria (up 10,500 persons)
and New South Wales (up 3,800 persons). The largest decrease was in
Western Australia (down 15,300 persons).
The seasonally adjusted unemployment rate increased in South Australia
(up 0.6 pts to 5.9%) and Tasmania (up 0.1 pts to 5.9%). The largest
decreases in the unemployment rate were observed in Victoria (down 0.4
pts to 4.2%), Queensland (down 0.2 pts to 6.1%) and Western Australia
(down 0.2 pts to 6.3%).
The largest increases in the seasonally adjusted participation rate were
in South Australia (up 0.4 pts to 62.7%) and Queensland (up 0.1 pts to
66.1%). The seasonally adjusted participation rate decreased in Western
Australia (down 1.0 pts to 68.0%) followed by Tasmania (down 0.4 pts to
60.0%) and Victoria (down 0.2 pts to 65.8%).
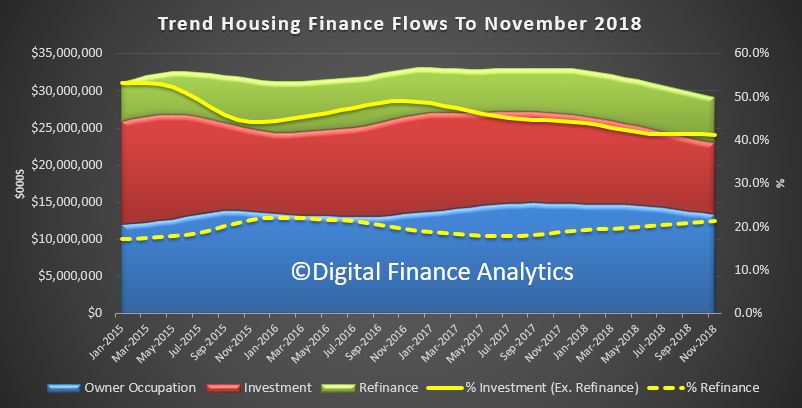
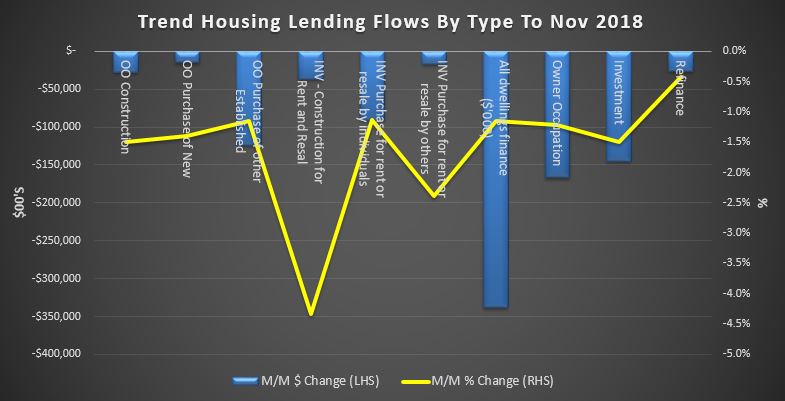
The ABS released their housing finance data to end November 2018. The trend estimate for the total value of dwelling finance commitments excluding alterations and additions fell 1.1%, or $338 million to $29.2 billion dollars. Owner occupied housing, excluding refinance fell 1.2% or $167 million to $13.4 billion and investment housing commitments fell 1.5%, or $145 million to $9.5 billion dollars. Refinanced loans were down 0.4% or $26 million to $6.2 billion. In trend terms, the number of commitments for owner occupied housing finance fell 0.2% in November 2018.
In trend terms, the number of commitments for the construction of dwellings fell 0.9%, the number of commitments for the purchase of new dwellings fell 0.6% and the number of commitments for the purchase of established dwellings fell 0.1%.
Looking in more detail at the movements, Owner Occupied construction fell 1.5%, down $28 million to $1.8 billion, the purchase of new owner occupied property fell 1.4% or $14.9 million, to $1 billion dollars. The owner occupied purchase of existing dwellings fell 1.2% or $123 million to $10.6 billion dollars. Investment construction fell 4.3% or $36 million to $0.8 billion dollars, investment purchases by individuals fell 1.1% or $90 million to $7.9 billion dollars and investment by other entities including self managed super funds fell 2.4% or $17 million to $0.71 billion dollars.
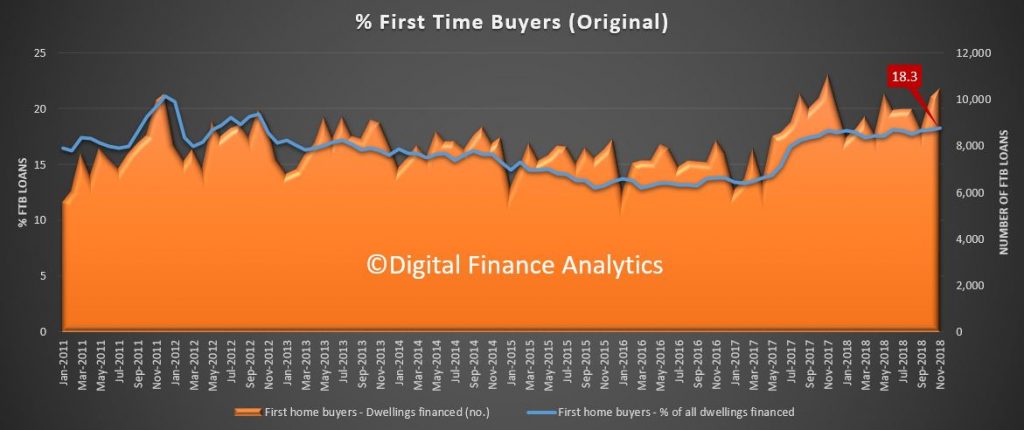
In original terms, the number of first home buyer commitments as a percentage of total owner occupied housing finance commitments rose to 18.3% in November 2018 from 18.1% in October 2018. In November 10,493 first time buyers purchased, 356 more than in the previous month.
The number of first time investors continues to fall, as measured by our surveys, with just 350 transaction written in the month, compared with 2,760 a year ago.
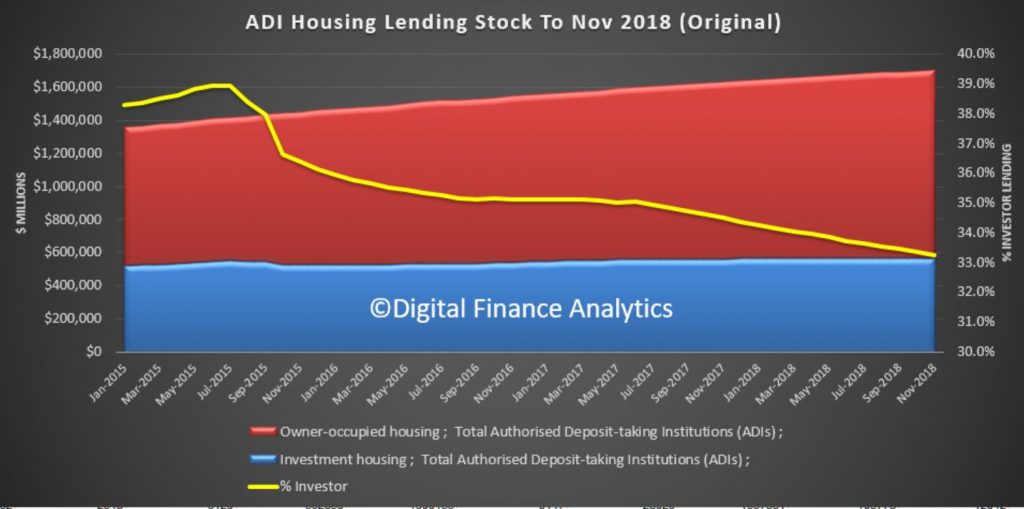
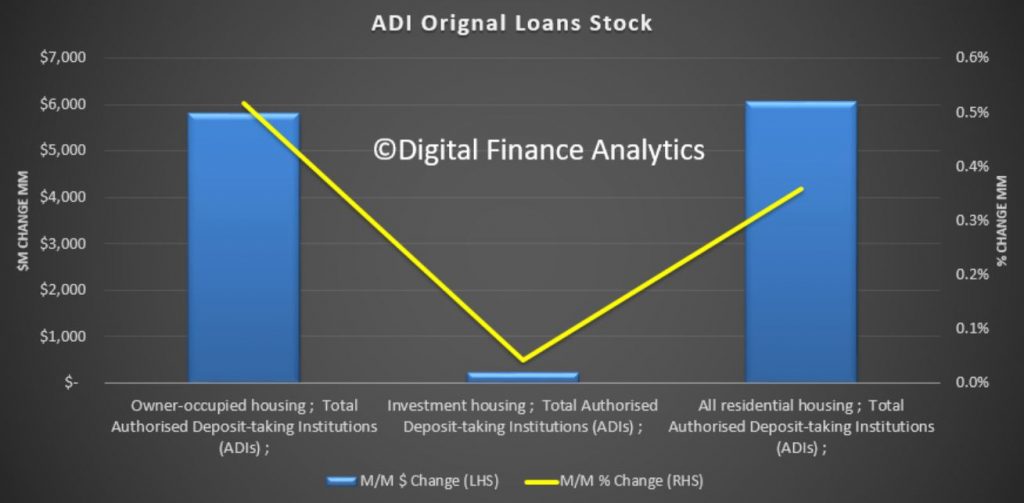
The month on month data shows the relative changes across the categories. Turning to the original stock data, we see total loans growing by 0.5% in the month with investor lending down to 33.26% of all loans. Total ADI loans stood at $1.17 trillion dollars, withe owner occupied loans at $1.1 trillion dollars and investment lending at $0.56 trillion dollars.
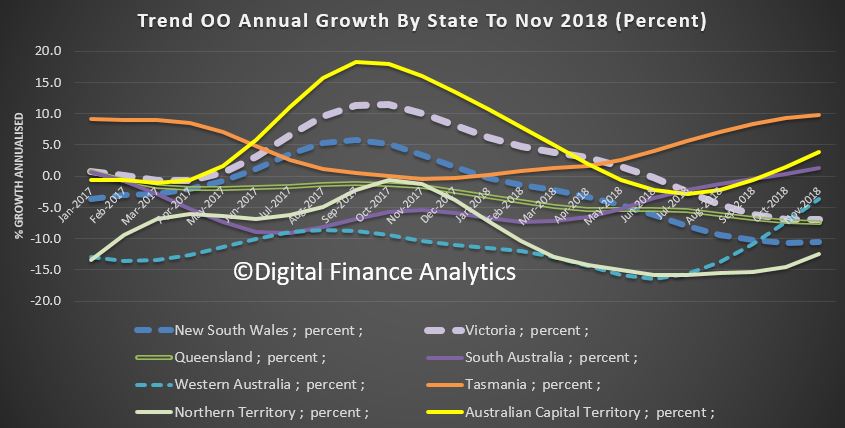
One final cut of the data is to look across the states – here we look at total owner occupied lending. We see a significant fall in NSW and VIC plus QLD, offset only a little by rises in TAS, ACT and SA. This in a nutshell explains why total credit is falling. Frankly the major markets of Sydney and Melbourne set to tone for the entire economy! We do not expect these falls to reverse anytime soon, and as credit drives home prices, the falls will continue. Recent APRA easing will have only small impact.
Finally, note that the ABS says November 2018 is the final issue of the Housing Finance, Australia (5609.0) and Lending Finance, Australia (5671.0) publications. Both publications will be combined into a single, simpler publication called Lending to Households and Businesses, Australia (5601.0).