Wage Growth Still Falling

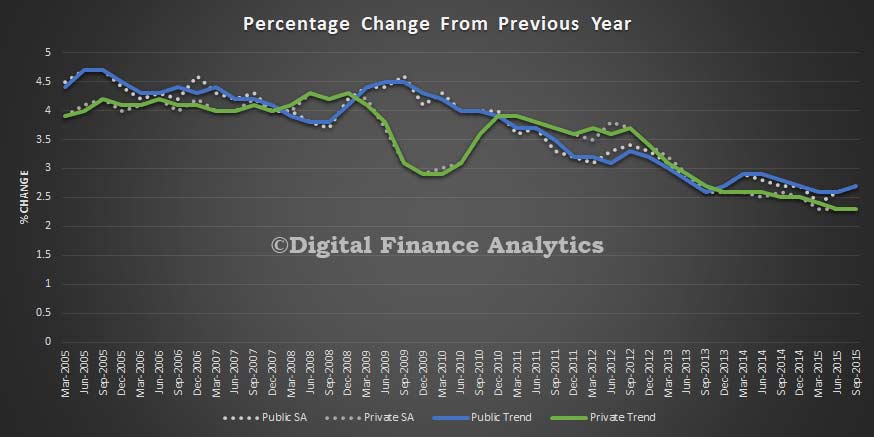
The seasonally adjusted Wage Price Index (WPI) rose 0.6 per cent in the June quarter 2015 and 2.3 per cent over the last year, according to figures released today by the Australian Bureau of Statistics (ABS).

In the June quarter 2015, Private sector wages grew 0.5 per cent and Public sector wages grew 0.7 per cent (seasonally adjusted).

Private sector seasonally adjusted wage growth of 2.2 per cent over the last year is the lowest rate of wages growth since the start of the WPI series. The through-the-year series was first published in September quarter 1998. In the Public sector, wages grew 2.5 per cent over the last year.

Wage-Price-Index-Jun-2015In the June quarter, the largest rise of all industries (original series) is 0.8 per cent in Financial and insurance services. Rental, hiring and real estate services had the smallest rise of 0.1 per cent.

Lending Finance Still About Housing – Record $35bn in June

The latest ABS data for June 2015, covering all lending, continues to portray the momentum in home finance. In June overall $35bn was lent across all the property sectors, out of an overall $94bn lent across the board. $12.bn was for owner occupied loans, $6bn for refinance (an all time record) and $13.7bn for investment loans. Regulatory intervention is too little too late. The 10% speed limit on investment loans was too high, and its implementation too slow to curb the excesses. Property lending is also concentrated in the eastern states.  The risks are mounting.

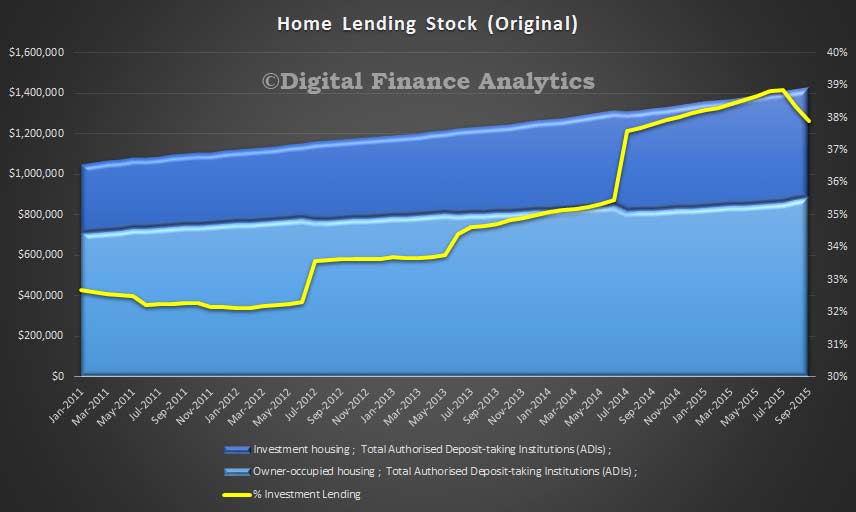
Housing-Finance-June-2015-GrossThe total value of owner occupied housing commitments excluding alterations and additions rose 0.1% in trend terms (our preferred measure). Within the housing data, we see that 53% of lending for housing, excluding refinance and unsecured was for investment purposes, a record. Moreover, even if you add in unsecured finance, and refinance, it is still a peak, of 43% of all lending.

FinainceJune2012Looking across all finance categories, the trend series for the value of total personal finance commitments rose 0.5%. Fixed lending commitments rose 1.5%, while revolving credit commitments fell 1.2%. The trend series for the value of total commercial finance commitments fell 0.2%. Fixed lending commitments fell 0.4%, while revolving credit commitments rose 0.5%. The trend series for the value of total lease finance commitments rose 1.0% in June 2015. In this picture, commercial lending includes both fixed and revolving loans. We also show the proportion of fixed loans which are for investment property purposes – its sitting at 37%.

Interestingly, the ABS also notes that

statistics in this publication are currently derived from returns submitted to the Australian Prudential Regulation Authority (APRA) under the Financial Sector (Collection of Data) Act 2001, primarily for use by the Australian Bureau of Statistics (ABS). The ABS anticipates that in the coming months some lenders will revise residential mortgage data reported to APRA. These revisions are expected to result in changes in the proportion of the investment housing statistics relative to owner occupation statistics. It is not expected that aggregate data on lending statistics for housing will change significantly. The ABS is working closely with APRA and affected lenders as they remediate their data and processes.

We may get more “ANZ” type restatements between loan categories.

Investment Lending Highest Ever At 52.8%

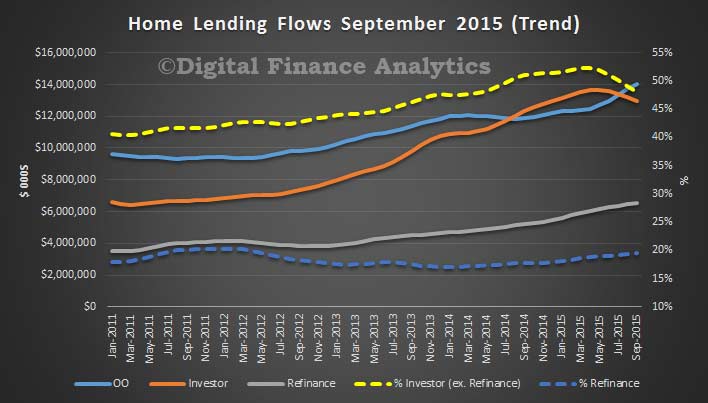
The latest housing finance data from the ABS to June 2015 shows continued growth, especially in refinancing and investment lending. Excluding refinance, 52.8% of all loans written in the month were for investment purposes – another record. No sign of any impact of tighter regulation showing yet. Total lending in the month (trend) was $32.2 billion (up 0.16% from last month), of which owner occupied loans were $12.2 billion (down 0.18%), refinance $6.1 billion (up 0.21%) and investment lending $13.7 billion (up 0.75%).  The ABS rolls in refinance into the owner occupied numbers, which overall went up 0.1%.

Housing-Finance-June-2015Within owner occupied loans, the trend changes clearly show that the purchase of new dwellings continues to grow the strongest,  Refinancing was up as a percentage of all lending to 33.2%. Another record.

OO-Housing-June-2015The rate of change of owner occupied refinancing is slowing, along with construction lending and purchased of established dwellings.

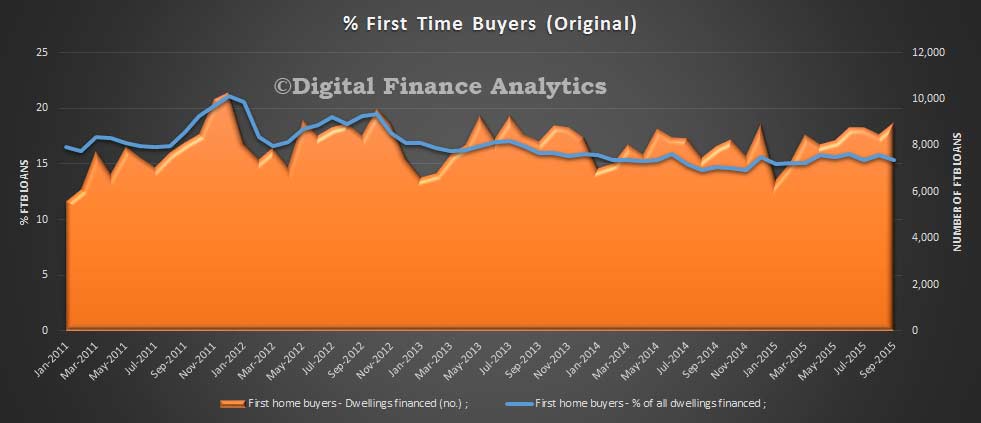
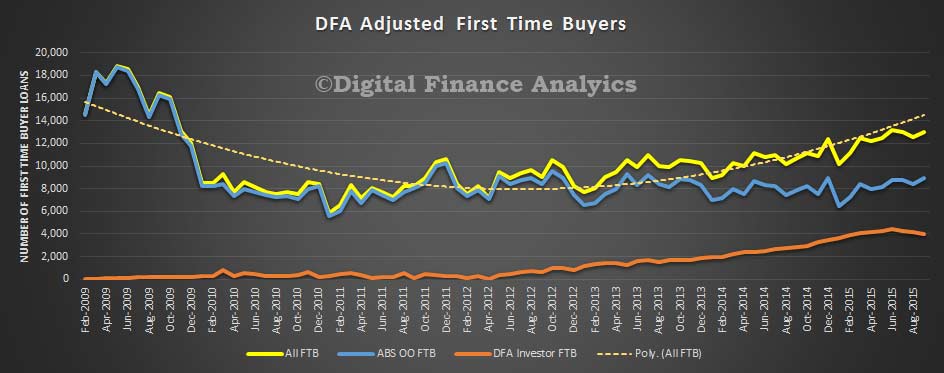
OOPCHousngJune2015The number of first home buyer commitments as a percentage of total owner occupied housing finance commitments rose to 15.9% in June 2015 from 15.6% in May 2015. First time buyers were active, with the original number of first time owner occupied borrowers up 6.8%, to 8,737. In addition, we overlay the DFA household survey data of investor first time buyers, which rose by 3.5% in the month to 4,453. Whilst the bulk were in Sydney we are continue to see a rise in investors in other states. As a result the total number of first time buyer transactions was 13,191, up 5.65%.

FTB-Adjusted-June-2015

Unemployment Rate Up to 6.3% (SA)

The latest ABS data shows that Australia’s estimated seasonally adjusted unemployment rate for July 2015 was 6.3 per cent, an increase of 0.3 percentage points (based on unrounded estimates) from a revised 6.1 per cent for June 2015. The trend (which smooths out the monthly variations to provide a more reliable view), was unchanged at 6.1 per cent. We continue to see monthly gyrations in the underlying data which makes it hard to draw any definitive conclusions. However, the headline jump will, I am sure, garner significant comment.

However, the seasonally adjusted labour force participation rate increased 0.3 percentage points to 65.1 per cent in July 2015. The number of jobs rose, mostly part-time positions, but also more people are seeking work. The ABS reported the number of people employed increased by 38,500 to 11,810,700 in July 2015 (seasonally adjusted). The increase in employment was driven by increases in both full-time and part-time employment, with the largest increase seen in part-time employment for males (up 20,400).

The ABS seasonally adjusted monthly hours worked in all jobs series decreased in July 2015, down 3.4 million hours (0.2 per cent) to 1,633.2 million hours.

The seasonally adjusted number of people unemployed increased by 40,100 to 800,700 in July 2015. This was driven by females who looked for both full-time work (up 18,200) and part-time work (up 14,600).

Building Approvals Fell 1.2% In June

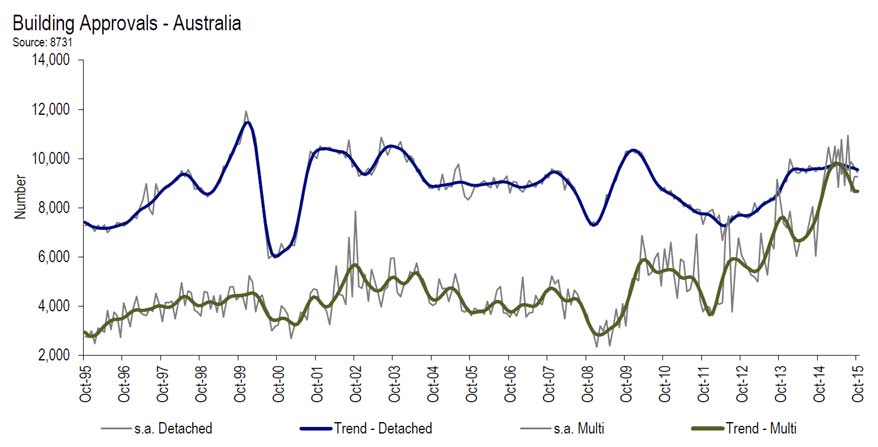
Australian Bureau of Statistics (ABS) building approvals show that the number of dwellings approved fell 1.2 per cent in June 2015, in trend terms, and has fallen for four months. The fall in unit approvals was the reason, confirming a continued slow down.

Building-Approvals-June-2015There were some significant state variations.

Dwelling approvals decreased in June in South Australia (4.1 per cent), New South Wales (2.9 per cent), Victoria (1.8 per cent) and Western Australia (0.4 per cent) but increased in the Australian Capital Territory (14.6 per cent), Northern Territory (8.7 per cent), Queensland (0.2 per cent) and Tasmania (0.1 per cent) in trend terms.
In trend terms, approvals for private sector houses were flat in June. Private sector house approvals rose in New South Wales (2.0 per cent), Queensland (0.3 per cent) and South Australia (0.2 per cent) but fell in Victoria (1.3 per cent) and Western Australia (1.0 per cent).

The value of total building approved fell 0.9 per cent in June, in trend terms, and has fallen for four months. The value of residential building fell 1.0 per cent while non-residential building fell 0.6 per cent in trend terms.

CPI June Quarter 2015 Rises 0.7 per cent – ABS

The ABS released the latest CPI data. The Consumer Price Index (CPI) rose 0.7 per cent in the June quarter 2015, following a rise of 0.2 per cent in the March quarter 2015.

CPI-to-Jun-2105This translates to an annual CPI of 1.5 per cent through the year to the June quarter 2015, following a rise of 1.3 per cent through the year to the March quarter 2015.

Underlying inflation is still in the 2-3% RBA target range, so there would be no impact of potential cash rate movements.

Underlying-Inflation-June-2015
The most significant price rises this quarter were in automotive fuel (+12.2 per cent), medical and hospital services (+4.5 per cent) and new dwelling purchase by owner–occupiers (+1.5 per cent), These rises were partially offset by falls in domestic holiday travel and accommodation (–5.4 per cent) and pharmaceutical products (–1.8 per cent). The increase in fuel is registered in four of the five fuel types with the quarterly rise the largest since December 1990.

Residential Building Growth All About Units

The ABS issued their March 2015 data on Building Activity. The trend estimate of the value of total building work done rose 2.0% in the March 2015 quarter. The trend estimate of the value of new residential building work done rose 3.6% in the March quarter. The value of work done on new houses rose 3.9% while new other residential building rose 3.1%. The trend estimate of the value of non-residential building work done was flat in the March quarter. The most striking trend is the continued relative growth in the value of units, versus houses.

ResidentialWorkDonePCMarch2015It was a strong result, reflecting the speculative demand for investment property.  The data says 53,900 dwellings were commenced during the March 2015 quarter. Units = ‘other dwelling’ commencements (predominantly multi-unit) jumped by 19.2 per cent to 25,140 whilst detached dwelling commencements were steady, increasing by 0.7 per cent in the March 2015 quarter to 28,761. Victoria was a stand out with more than 9,000 multi-unit dwellings started in the quarter, which is a record. In the part year, March 2015, almost 205,000 new dwellings were commenced, and breaking the 200,000 barrier for the first time.

ResidentialWorkDoneMarch2015There are some significant state variations, new home starts increased in New South Wales (up by 1.9 per cent), Victoria (up by 18.8 per cent), Queensland (up by 20.9 per cent) and the Northern Territory (up by 12.0 per cent). But there were significant declines, most notably in South Australia, down 18.0 per cent, Western Australia (down by 4.8 per cent), Tasmania (down by 14.7 per cent) and the ACT (down by 14.4 per cent).

Now, here is the thing. Property building has gained significant momentum at a point where investment mortgage lending is being tightened, and consumer confidence is falling. We wonder whether the supply demand balance is about to swing, with more property on offer than capable purchasers.

Lending Finance For May – Investment Property Lending Still Hot

The ABS released their overall lending data for May 2015. It shows the same old story. Significant growth in investment lending, especially driven by NSW. The total value of owner occupied housing commitments excluding alterations and additions rose 0.4% in trend terms. Investment lending was 1.0% up in the month, and refinance up 1.6%. The trend series for the value of total personal finance commitments rose 0.8%. Fixed lending commitments rose 1.7%, while revolving credit commitments fell 0.3%. The trend series for the value of total commercial finance commitments rose 1.5%. Fixed lending commitments rose 1.9% and revolving credit commitments rose 0.3%. The trend series for the value of total lease finance commitments rose 1.1% in May 2015 and the seasonally adjusted series rose 0.7%, after a fall of 1.5% in April 2015.

Lending-Aggregates-May-2015The housing data shows that investment lending is still hot. Refinancing is also on the up.

Trend-Lending-Flows-May-2015The state data shows that NSW investment lending set a new record on both volume and value.

Lending-NSW-May-2015

Property Investors Undeterred

The latest data from the ABS covering housing finance to May 2015, shows that in trend terms (our preferred measure) lending for investment purposes rose by more than 1%, whilst owner occupied loans rose 0.4%. However, this is misleading, because the growth in owner occupied loans is all about refinancing of existing loans which was up by 1.6%, indicating that many are seeking to switch to lower rate deals which are still on offer. Exclude this element, and owner occupied lending actually fell slightly. Total lending overall was $31 billion in the month, a 0.7% rise, whilst in seasonally adjusted terms, the total value of dwelling finance commitments excluding alterations and additions fell 4.4%. Momentum is mainly in existing property rather than new construction.

Looking across the data, we start with the full set, which shows that 52% of all lending was for investment purposes – another record. The total value of lending to owner occupiers and investors for the new home construction eased back by 3.2%, though this is still some 11.5% higher than a year earlier. The decline is attributable to a 5.4% fall in the value of lending among owner occupiers, while lending to investors constructing new dwellings increased by 1.6%.

All-Resi-Lending-May-2015Refinancing of existing loans amounted to more than 20% of all loans written in the month, reaching a similar proportion to late 2011. We expect refinancing transactions to continue to bloom as investors come off the boil.

Resi-Refi-May-2015First time buyers are still active, in original terms the ABS data showed a rise in owner occupied first time buyer investors. The number of first home buyer commitments as a percentage of total owner occupied housing finance commitments rose to 15.9% in May 2015 from 15.8% in April 2015. However, we also continue to see a rise in investor first time buyers, as they continue to use the “back door” property entry method. Refer to our earlier analysis.

FTB-Tracker-May-2015Looking at the state data, we see increases in the ACT and NT, whilst relative changes in the larger states were smaller. WA and TAS are falling a little.

OO-Percentage-By-States-May-2015There are nearly as many commitments in VIC than in NSW in the month, whilst WA registered a small relative fall. The number of dwelling construction loans to owner occupiers (in original terms) in May 2015 compared with a year previously was lower in each of the six states: down by 5.9 per cent in New South Wales, down 5.4 per cent in Victoria, down 9.4 per cent in Queensland, down 11.8 per cent in South Australia, down 27.3 per cent in Western Australia and 3.0 per cent lower in Tasmania over the past year.

OO-Committments-By-State-May-2015Finally, of owner occupied loans, refinancing accounted for more than 35%. This is a recent record.

OO-Lending-May-2015

Unemployment Rate Unchanged This Month

Against expectations, in trend terms, the unemployment rate was unchanged at 6.0 per cent in June, as announced by the Australian Bureau of Statistics (ABS) today. The seasonally adjusted unemployment rate for June 2015 was 6.0 per cent, an increase of 0.1 percentage points from a revised 5.9 per cent for May 2015.

The seasonally adjusted labour force participation rate increased less than 0.1 percentage points to 64.8 per cent in June 2015.

The ABS reported the number of people employed increased by 7,300 to 11,768,600 in June 2015 (seasonally adjusted). The increase in employment was driven by increases in full-time employment for both females (up 17,500) and males (up 7,000). The increase in full-time employment was partially offset by decreases in part-time employment for both females (down 10,600) and males (down 6,600).

The ABS seasonally adjusted aggregate monthly hours worked series increased in June 2015, up 5.1 million hours (0.3%) to 1,636.9 million hours.

The seasonally adjusted number of people unemployed increased by 12,800 to 756,100 in June 2015. This was driven by unemployed people who looked for full-time work, which increased by 27,200 to 541,200.

In contrast the Roy Morgan Research unemployment number for June was 9.3% down 1.3% from a year ago. This alternative method of assessing unemployment rates is consistently higher than the ABS rate. This Roy Morgan survey on Australia’s unemployment and ‘under-employed’ is based on weekly face-to-face interviews of 437,819 Australians aged 14 and over between January 2007 – June 2015 and includes 4,233 face-to-face interviews in June 2015.

Both sets of measures indicate that currently employment opportunities are keeping pace with demand, keeping the rate at a high, but not rising figure.