Mortgage Securitisation On The Rise

The ABS today released the data for Australian Securitisers to December 2014. We see two interesting points, first the value of mortgages being securitised has risen (up 4.8%), and second, a greater share are being purchased by Australian investors (all but 7.2%). We discussed recently the rise on securitisation, and the implications. We know the securitised mortgage pools have been securitised by both the banking sector, and non-banking sector. Investors who buy mortgage back securitised paper are of course leveraged into housing at a second order level.

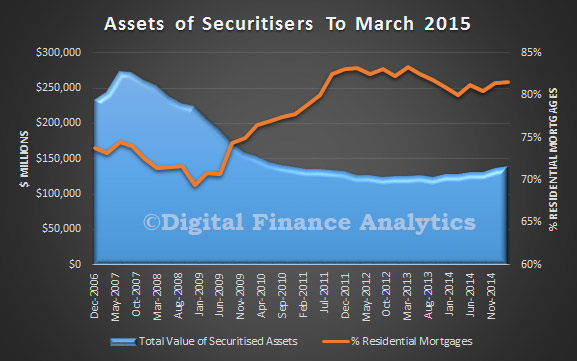
At 31 December 2014, total assets of Australian securitisers were $136.5b, up $4.8b (3.6%) on 30 September 2014.

SecuritisersAssetsDec2014During the December quarter 2014, the rise in total assets was due to an increase in residential mortgage assets (up $5.2b, 4.9%) and cash and deposits (up $0.3b, 7.1%). This was partially offset by decreases in other loans (down $0.6b, 3.9%).

Residential and non-residential mortgage assets, which accounted for 83.0% of total assets, were $113.3b at 31 December 2014, an increase of $5.2b (4.8%) during the quarter.

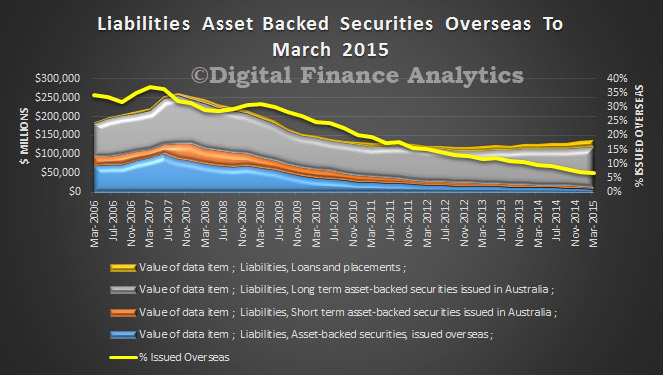
At 31 December 2014, total liabilities of Australian securitisers were $136.5b, up $4.8b (3.6%) on 30 September 2014. The rise in total liabilities was due to the increase in long term asset backed securities issued in Australia (up $4.3b, 4.3%) and loans and placements (up $3.0b, 18.4%). This was partially offset by a decrease in short term asset backed securities issued in Australia (down $1.5b, 33.0%) and asset backed securities issued overseas (down $1.1b, 10.4%).

SecuritiserLiabilitiesDec2014At 31 December 2014, asset backed securities issued overseas as a proportion of total liabilities decreased to 7.2%, down 1.1% on the September quarter 2014 percentage of 8.3%. Asset backed securities issued in Australia as a proportion of total liabilities decreased to 77.5%, down 0.7% on the September quarter 2014 percentage of 78.2%.

Note the ABS says revisions have been made to the original series as a result of improved reporting of survey data. These revisions have impacted the assets and liabilities reported as at 30 September 2014 and 30 June 2014.

Lending Growth In December Only Supported By Housing

The ABS published their lending finance data for December. Only Housing Lending increased. All other categories declined. We know that investment housing lending grew the fastest.

Comparing December, with November, the total value of owner occupied housing commitments excluding alterations and additions rose 0.9% in trend terms, and the seasonally adjusted series rose 3.8%.

LendingByCategoryDec2014The trend series for the value of total personal finance commitments fell 0.1%. Revolving credit commitments fell 0.4%, while fixed lending commitments rose 0.1%. The seasonally adjusted series for the value of total personal finance commitments fell 2.5%. Revolving credit commitments fell 5.2% and fixed lending commitments fell 0.4%.

The trend series for the value of total commercial finance commitments fell 2.9%. Revolving credit commitments fell 5.1% and fixed lending commitments fell 2.2%. The seasonally adjusted series for the value of total commercial finance commitments rose 0.4%. Revolving credit commitments rose 4.3%, while fixed lending commitments fell 0.9%.

The trend series for the value of total lease finance commitments fell 3.8% in December 2014 and the seasonally adjusted series fell 11.2%, following a fall of 6.7% in November 2014.

Unemployment Leaps To 6.4% – ABS

According to the ABS, Australia’s estimated seasonally adjusted unemployment rate for January 2015 was 6.4 per cent, compared with 6.1 per cent for December 2014. This is the highest jobless figure since August 2002, when it also hit 6.4 per cent. However, in trend terms, the unemployment rate was unchanged at 6.3 per cent. The seasonally adjusted labour force participation rate remained at 64.8 per cent in January 2015.

The ABS reported the number of people employed decreased by 12,200 to 11,668,700 in January 2015 (seasonally adjusted). The decrease in employment was driven by decreased full-time employment for both males (down 26,000) and females (down 2,100). The decrease in full-time employment was partly offset by an increase in male part-time employment, up 17,800.

The ABS seasonally adjusted aggregate monthly hours worked series increased in January 2015, up 8.2 million hours (0.5 per cent) to 1,607.6 million hours.

The seasonally adjusted number of people unemployed increased by 34,500 to 795,200 in January 2015, the ABS reported.

The question is, can we trust the seasonally adjusted series, given part performance, revisions, and continued volatility?

Housing Finance Leaps Higher

Data from the ABS today shows a further lift in home lending in December, driven hardest by the investment sector, but with owner occupation lending also in play. The trend estimate for the total value of dwelling finance commitments excluding alterations and additions rose 1.0%. Investment housing commitments rose 1.2% and owner occupied housing commitments rose 0.9%. Investment lending comprised more than 50.6% of new loans, excluding refinance, another record. Refinancing remains strong in the current low rate environment. In seasonally adjusted terms, the total value of dwelling finance commitments excluding alterations and additions rose 4.7%. However, DFA is now using the trend series in our modelling, as we think the SA series are suspect (according to the ABS, trend series reduces the impact of the irregular component of the seasonally adjusted series and is derived by applying a 13-term Henderson-weighted moving average to all but the last six months of the respective seasonally adjusted series, whilst the last six months are estimated by applying surrogates of the Henderson moving average to the seasonally adjusted series.)

HousingFinanceTrendDec2014In trend terms, the number of commitments for owner occupied housing finance rose 0.5% in December 2014. In trend terms, the number of commitments for the purchase of established dwellings rose 0.6%, while the number of commitments for the purchase of new dwellings fell 1.1% and the number of commitments for the construction of dwellings was flat.

Turning to First Time Buyers, on the revised new method of calculation and in original terms, the number of first home buyer commitments as a percentage of total owner occupied housing finance commitments fell to 14.5% in December 2014 from 14.6% in November 2014. The fall in First Time Buyer activity remains a feature in the current climate.

FirstTimeBuyersDec2014-DecThe state by state data reflects the revised First Time Buyer data, with NSW up by one third from 8% to 11% following the ABS revisions, compared with a national uplift of one quarter. We still see WA leading the way, though falling from the June 2014 peak. The other states are now more closely aligned. Given the size of the adjustment, we hypothise that at least one of the majors was not correctly recording first time buyer data.

FirstTimeBuyers-StatesDec2014

Building Approvals Up 1.3% in December

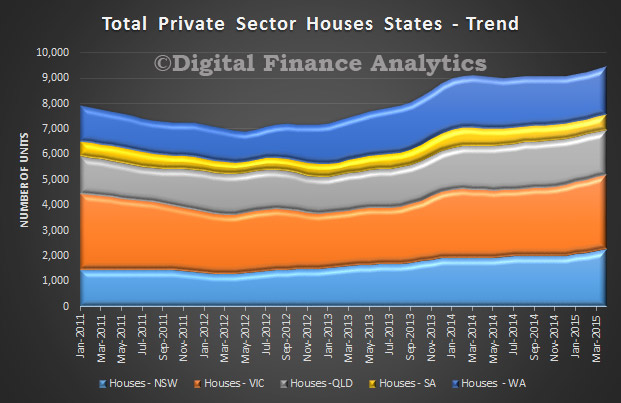
The ABS published Building Approvals to December 2014 today. The trend estimate for total dwellings approved rose 1.3% in December and has risen for seven months supported by strong unit growth. The trend estimate for private sector houses approved fell 0.2% in December and has fallen for nine months. The trend estimate for private sector dwellings excluding houses rose 2.9% in December and has risen for seven months.

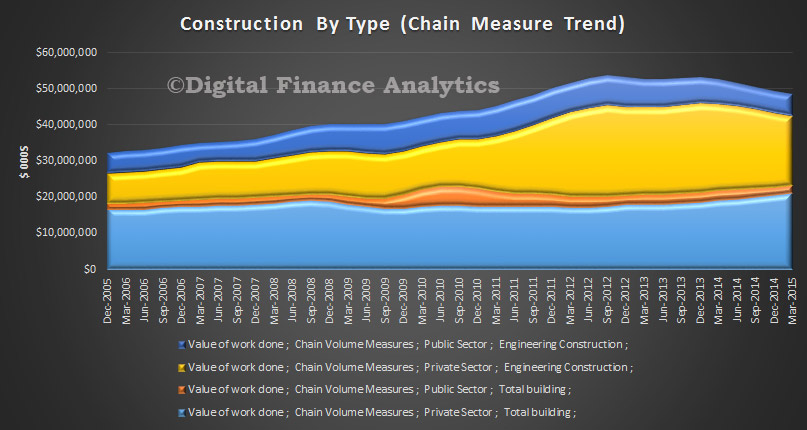
BuildingApprovalsDec2014-1The trend estimate of the value of total building approved rose 0.2% in December after falling for four months. The value of residential building rose 0.6% and has risen for two months. The value of non-residential building fell 0.7% and has fallen for four months.

Retail Turnover 0.2% Up In December – ABS

According to the ABS data released today, Australian retail turnover rose 0.2 per cent in December following a rise of 0.3 per cent in November and October 2014, in trend terms. Through the year, the trend estimate rose 3.3 per cent in December 2014 compared to December 2013. In trend terms the largest contributor to the rise was clothing, footwear and personal accessory retailing (0.6 per cent). Then followed Food retailing (0.4 per cent ) and department stores (0.4 per cent), household goods retailing (0.3 per cent) and restaurants and takeaway food services (0.1 per cent). Other retailing fell (-0.4 per cent).

RetailSalesTurnoverAllStatesDecember2014
In trend terms all states but Tasmania rose. South Australia (0.5 per cent), Australian Capital Territory (0.4 per cent), New South Wales (0.3 per cent), Western Australia (0.3 per cent), Northern Territory (0.3 per cent.), Queensland (0.2 per cent), Victoria (0.1 per cent) and Tasmania fell (-0.2 per cent) .

RetailTurnoverByStateDecember2014

On a per capita basis, retail turnover was up 0.6% in the December quarter, higher than the previous few quarters.

RetailTurnoverPerCapitaDec2014In volume terms, turnover rose (1.5 per cent) in the December quarter, seasonally adjusted, following a rise of (0.9 per cent) in the September quarter 2014. Online retail turnover contributed (2.8 per cent) to total retail turnover in original terms.

First Time Loans Now 25% Higher – ABS

The ABS published revised First Time Buyer data to try and iron out some data issues. As a result in November 2014 an extra 1,566 loans (25.8%) were found. This means First Time Buyer Loans were 14.6% of new loans in November, as opposed to 11.6% reported previously. Still a low number, compared with the peak of 30.6% in April 2009.

FTB-Nov-2014-RevisedThis does not count First Time Buyers going direct to the investment sector, which we have highlighted before. The ABS explanation follows.

The First Home Owner Grant (FHOG), introduced on 1 July 2000, is a national scheme funded and administered by the states and territories http://www.firsthome.gov.au. Under the scheme, a one-off grant is payable to eligible first home owners. Until October 2012, all first home buyers were eligible for the grant regardless of whether they bought a new or an established home.

Gradually, States and Territories restricted grants to new homes only so that first home buyers who were buying established homes were no longer eligible for the grant. APRA reporting instructions state that a First Home Buyer is a borrower entering the home ownership market for the first time as an owner-occupier. The instructions do not make any distinction between first home buyers who are eligible for a First Home Owner Grant and those who are not. Nonetheless, some lenders’ reporting systems only record first home buyers if they are eligible for a grant which may cause under-reporting of first home buyers.

This under-reporting has progressively impacted on first home buyer statistics from October 2012 as individual States and Territories have changed the eligibility of their First Home Owner Grants, generally to cover only the purchase of newly constructed homes.

States and Territories restricted grants to new homes from different dates – New South Wales and Queensland from October 2012; Victoria from July 2013; the Australian Capital Territory from September 2013; South Australia and Tasmania from July 2014. Loans to first home buyers were therefore underestimated in these States from the dates specified due to some lenders under-reporting. Other lenders have reported correctly throughout. Originally, the drop in loans to first home buyers from October 2012 had been attributed to the change in grant eligibility reducing the affordability for first home buyers and economic conditions, such as rising house prices and the increase in investment loans for housing. However, subsequent analysis and follow-up with lenders has confirmed that the drop was due, at least in part, to under-reporting by some lenders.

CHANGES TO THE ESTIMATION METHOD

The ABS estimates that the number of loans to first home buyers which are currently being reported are approximately 80% of the total number of loans to first home buyers. Total reported monthly home loan commitments are not affected by this under-reporting.

For lenders who are under-reporting loans to first home buyers, the ABS has developed a model to adjust the proportion of first home buyers to total loans for each period of incorrect reporting. The model uses the following components:

      a) proportion of first home buyers to total loans for those lenders reporting correctly this period;
      b) the proportion of first home buyers to total loans for those lenders reporting incorrectly in the previous period;
      c) the proportion of first home buyers to total loans for those lenders reporting correctly in the previous period; and
    d) coefficients which determine the relative contribution of the above components to the incorrectly reported proportion.

The coefficients (d) of this model were estimated using data from January 2002 to the month prior to the First Home Owner Grant policy being changed (for example, in NSW the data were from January 2002 to September 2012). All the affected states were analysed separately. When more lenders are able to report correctly, the coefficients and estimates will be updated accordingly.

Application of the adjusted proportion:

The following table is an excerpt from the Housing Finance form (ARF392.0) and will be used to demonstrate the application of the adjusted proportion.

Chart: New commitments for home loans

There are no known issues in reporting the total number and value of Fixed rate home loans (9t and 9vt), Secured revolving credit home loans (10t and 10vt) and Other home loans (11t and 11vt). The estimated proportion of first home buyers is applied to the totals for Question 9, Question 10 and Question 11 (9t, 9vt; 10t, 10vt; and 11t, 11vt) respectively to determine the number of first home buyers of the particular loan type. The values for non-first home buyers (i.e. All other loans) are then derived by subtracting the values for first home buyers from the respective totals.

Each lender reports the data by State and Territory, and the proportion for each period is applied to the relevant lenders at the state level. The adjustment is made at the lowest level collected, and is applied to the affected lenders and affected States only. The data are then aggregated to the published States and the national level.

Revisions have been made to the previously published data for the Number, Percentage (%) of all dwellings financed, and Average loan size of First Home Buyers and Non-first home buyers at the national level (columns B to G of Table 560909a). Relevant States’ previously published data have also been revised (Table 560909b) back to when the First Home Owner Grant was first restricted in that State or Territory.

ABS To Change Method Of Estimating First Home Buyer Loans

The ABS has announced some changes to address under reporting of First Time Buyers in their lending data. Whilst they will publish a more detailed report tomorrow, the current data understates the true position because some lenders report first time buyers based on whether they had a first time buyer grant. Many do not these days. However, they are quiet so far on the question of whether first time buyers going direct to investment properties, should be counted as we explained  recently. Remember all the ABS data is based on lending counts, not property transfer information.

An investigation by the ABS has identified that data on first home buyers is under-reported, as some lenders only report loans to first home buyers who have also received a first home owner grant. Some first home buyers not eligible for the grant were incorrectly excluded.

Since a preliminary investigation was completed in October 2014, users of first home buyer statistics were advised to exercise caution in using first home buyer data until further investigations were complete.

The total value of home lending is separately reported and is not affected.

The ABS and APRA are working with lenders to ensure all loans to first home buyers are recorded in the future, regardless of whether they receive a first home owner grant or not.

In the interim, the ABS will adjust first home buyer data for this under-reporting by modelling estimates based on data provided by lenders that have reported correctly. The estimates will be updated over time as more lenders report correctly.

CPI Down To 1.7%

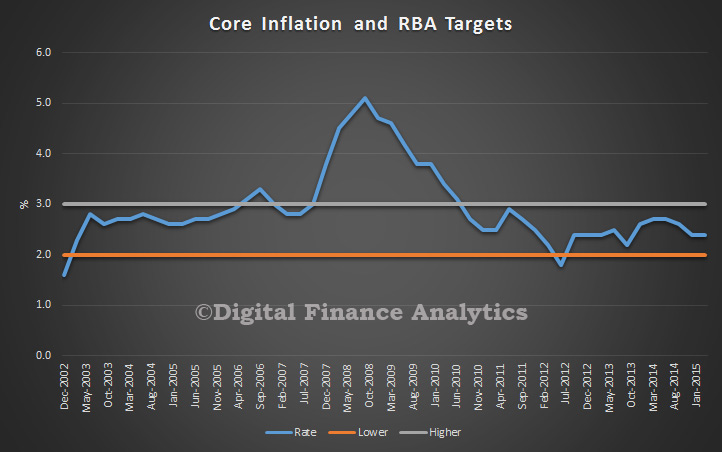
According to the ABS, the Consumer Price Index (CPI) rose 0.2% in the December quarter 2014, following a rise of 0.5% in the September quarter 2014. The CPI is trending down at the moment.

CPI-Dec-2014-ALL

The most significant price rises this quarter were for domestic holiday travel and accommodation (+5.8%), tobacco (+4.8%) and new dwelling purchase by owner-occupiers (+1.1%), These rises were partially offset by a fall in automotive fuel (–6.8%). Global oil markets continue to experience oversupply, which resulted in continued falls in oil prices. In Australia, average unleaded petrol prices reached a low of $1.17 per litre in December 2014, the lowest recorded average daily price since February 2009.

The CPI rose 1.7% through the year to the December quarter 2014, following a rise of 2.3% through the year to the September quarter 2014.

The fall in CPI may stimulate calls for the RBA to cut rates, but given that oil price falls already acts as a quasi rate cut, DFA believes a further cut in official rates is not required. The lower dollar and stable unemployment data also suggests there is no need for cuts, indeed, the next movement should be upwards.

Vehicle Sales Trend Down Again

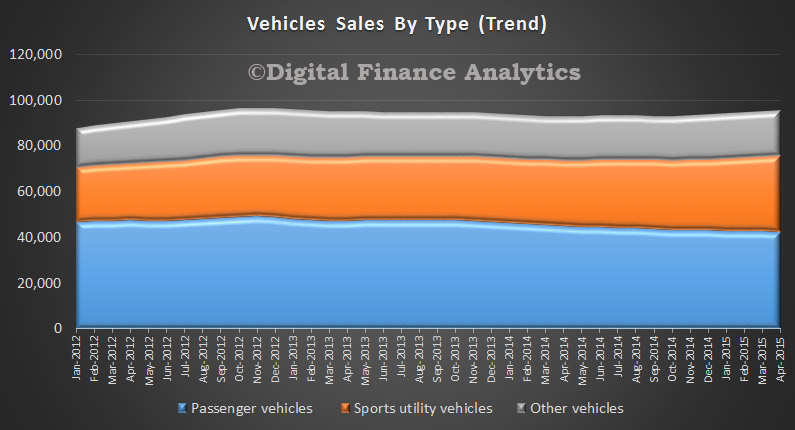
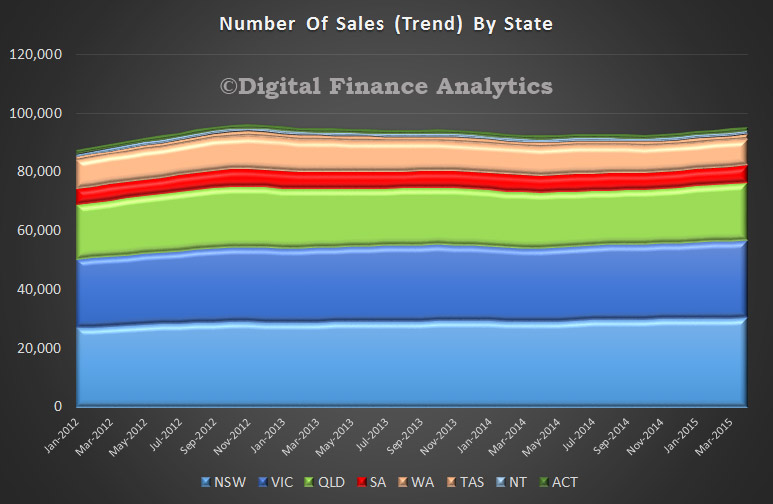
The ABS data for December, released today shows that the vehicle sales trend estimate of  92,618 decreased by 0.1% when compared with November 2014. The trend estimate has now decreased by 0.1% for five consecutive months, from a peak in 2012.

VehiclesFlowDec2014When comparing national trend estimates for December 2014 with November 2014, sales of Sports utility and Other vehicles both increased by 0.5% respectively. Over the same period, Passenger vehicles decreased by 0.8%. The rotation towards Sports utilities continues.

VehiclesTypeFlowDec2014Five of the eight states and territories experienced a decrease in new motor vehicle sales when comparing December 2014 with November 2014. Western Australia recorded the largest percentage decrease (1.3%), followed by the Australian Capital Territory (1.2%) and South Australia (1.1%). Over the same period, both Victoria and the Northern Territory recorded the largest increase in sales of 0.3%. Queensland and WA have been showing the most consistent falls in recent months.

VehicleFlowStateDec2014