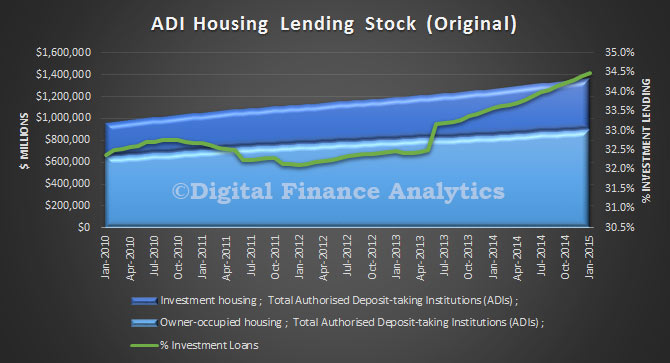
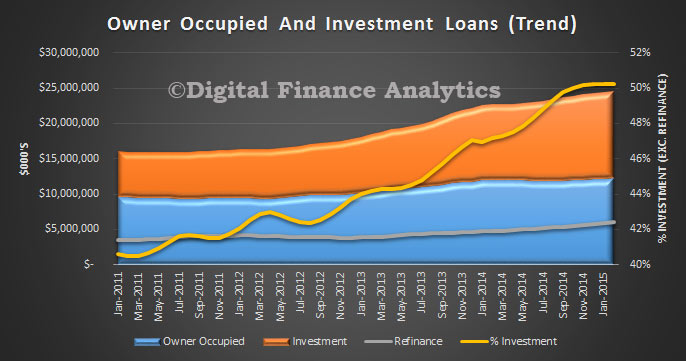
The ABS Housing Finance data for February 2015 was released today. The trend estimate for the total value of dwelling finance commitments excluding alterations and additions rose 0.8%. Owner occupied housing commitments rose 1.0% and investment housing commitments rose 0.4%. This is the first time growth in owner occupied loans has exceeded investment loans for many months. As a result the proportion of investment loans dropped below 50% for the first time this year. The cut in RBA rates also stimulated demand for the refinance of existing loans. We also see the bulk of investors purchased established dwellings, not newly constructed property.
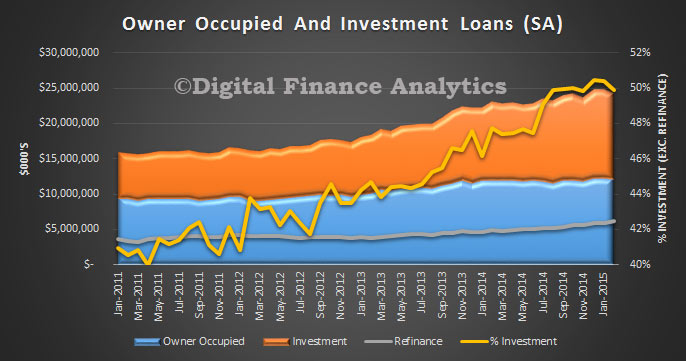 The trend data (which irons out monthly changes) held investment loans over 50%, but also registered a slight drop.
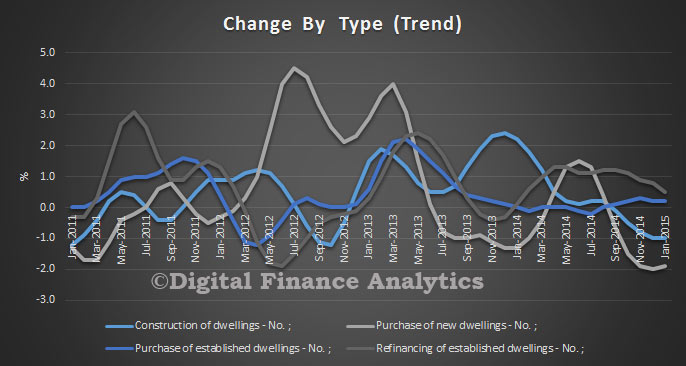
 In trend terms, the number of commitments for owner occupied housing finance rose 0.2% in February 2015. In trend terms, the number of commitments for the purchase of established dwellings rose 0.5%, while the number of commitments for the purchase of new dwellings fell 1.4% and the number of commitments for the construction of dwellings fell 1.1%. The number of loans to owner occupiers buying established homes, excluding refinancing, fell by 0.9 per cent.
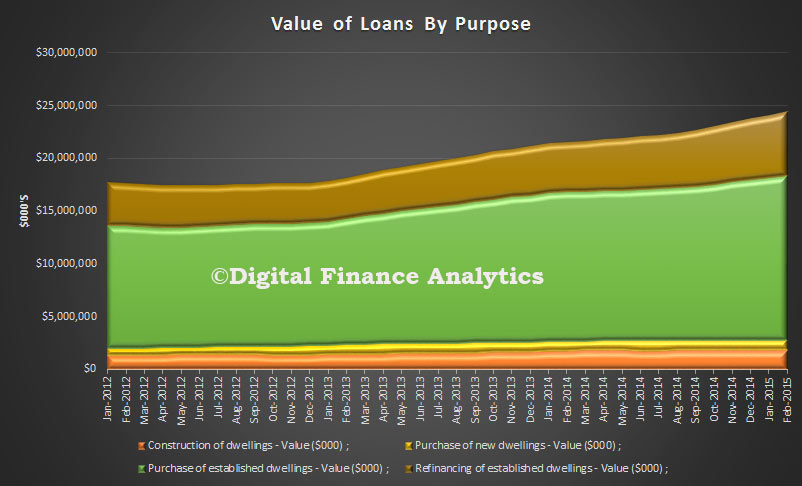
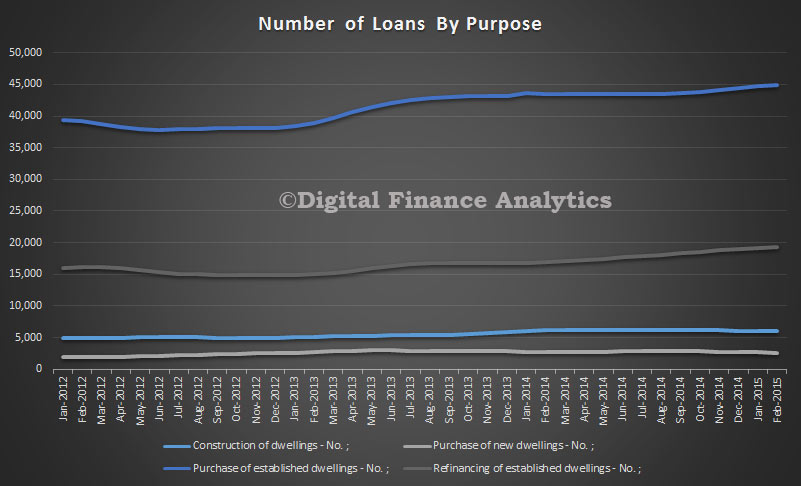 The overall value of loans made in the month was a record $18 billion, excluding refinancing of existing loans. New construction was up about 2%.
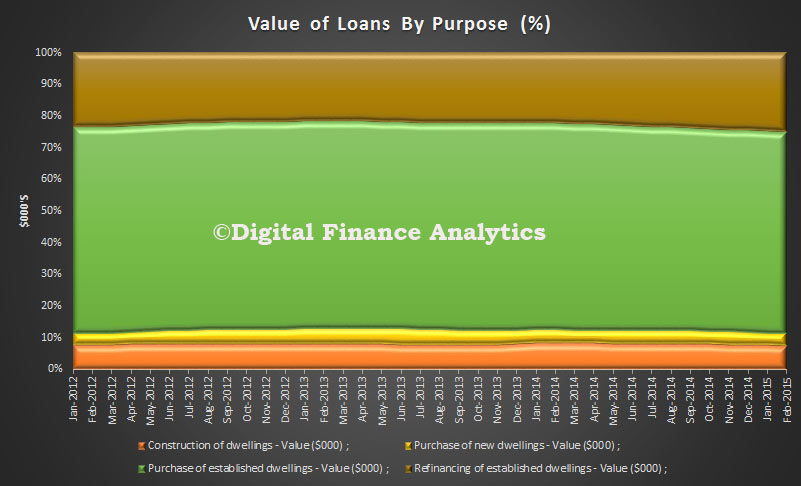
 In percentage terms, refinance of loans increased slightly, relative to new loans.
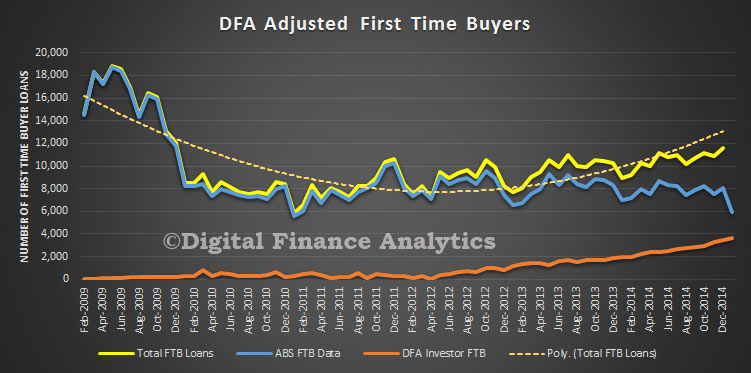
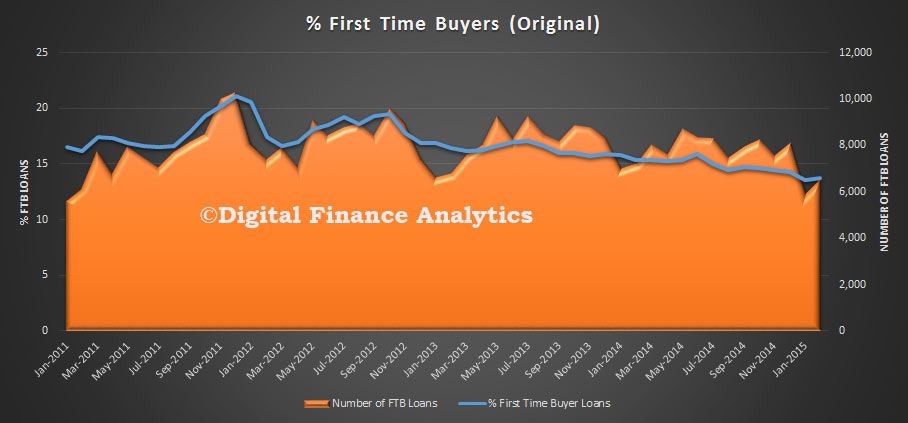
 In original terms, the number of first home buyer commitments as a percentage of total owner occupied housing finance commitments rose to 13.7% in February 2015 from 13.6% in January 2015.
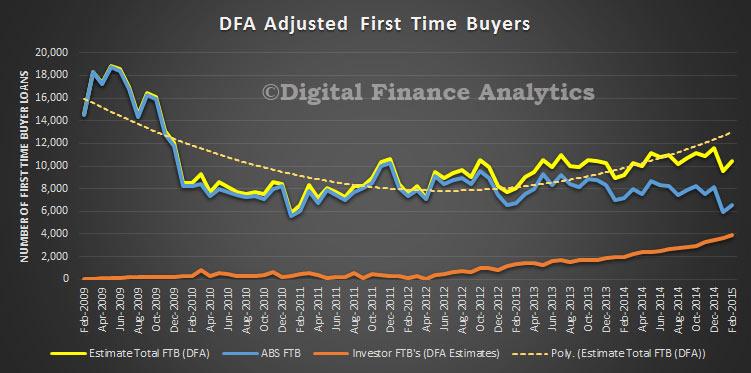
 If we overlay the DFA modelling of first time investor loans, overall first time buyer activity was up. Remember, also the data refers to loans, not property transfers, and we know form our surveys that additional purchases were made without the need for a mortgage by overseas investors, and local purchases cashed up thanks to the Bank of Mum and Dad.
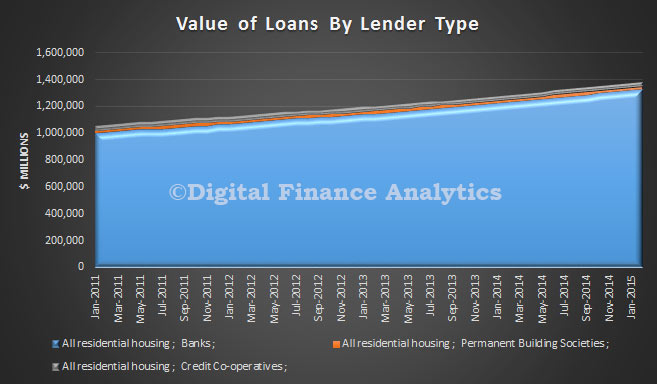
 Finally, the bulk of lending is being done by the banks, relative to credit unions and building societies. The total loans on book was $1.375 trillion.
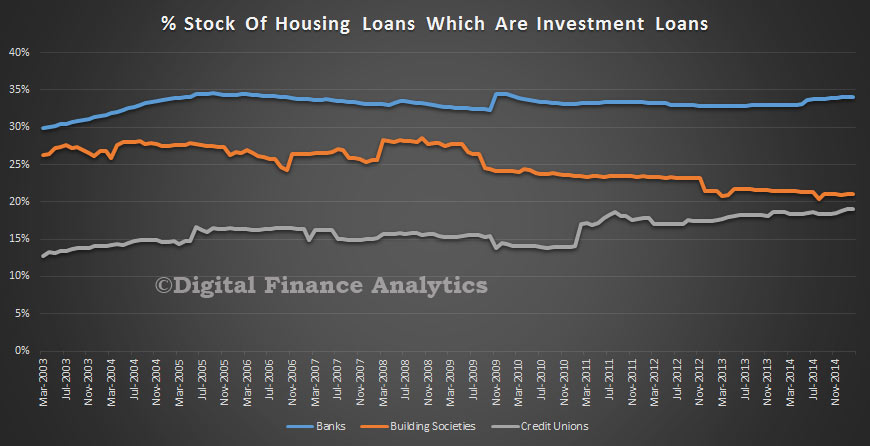
It is also worth noting that building societies are lending a smaller proportion of investment loans, and the falling trend here, compared with the rising trend in the credit union sector, though both are well below the 34% of banks loan portfolio.
.
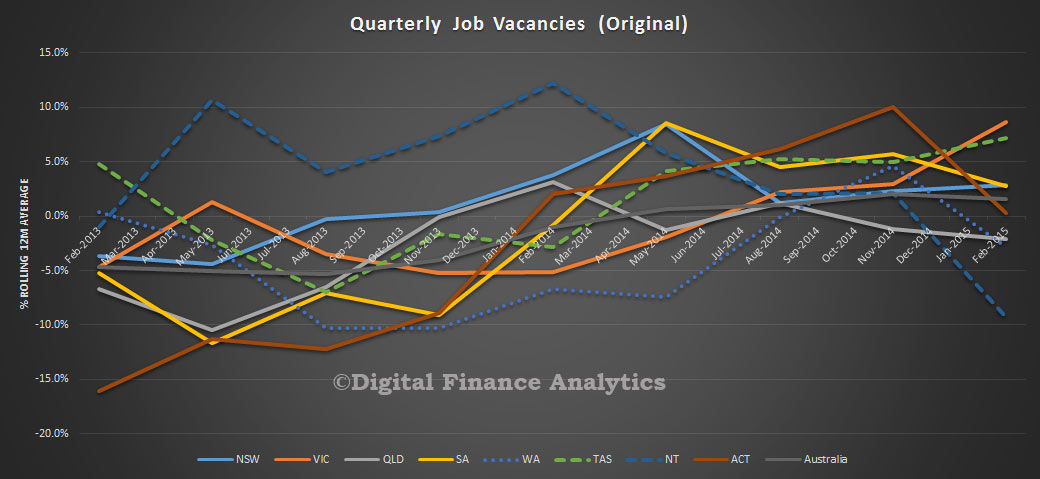
 Five of the eight states and territories experienced an increase in new motor vehicle sales when comparing February 2015 with January 2015 in trend terms. Tasmania recorded the largest percentage increase (1.7%), followed by Queensland (0.6%) and both Victoria and South Australia (0.3%). Over the same period, Western Australia, the Northern Territory and the Australian Capital Territory all recorded decreases in sales of 0.3%.