APRA, Start Disclosing Better Data

Each quarter APRA publishes Property Exposure for ADI’s and at first blush it looks like useful data. However, it does not provide the right lens on the the data, so some critical dimensions are missing completely.

First, we get nothing at all about Loan to Income ratios, either at a portfolio or new written loan level, when this is regarded as an essential tool is assessing true risks.

Second, we need a split between the key characteristics of investment loans versus owner occupied loans. What share are interest only loans, and how does the LVR splits stand between the owner occupied and investment sector? How do loan sizes compare between the two types?

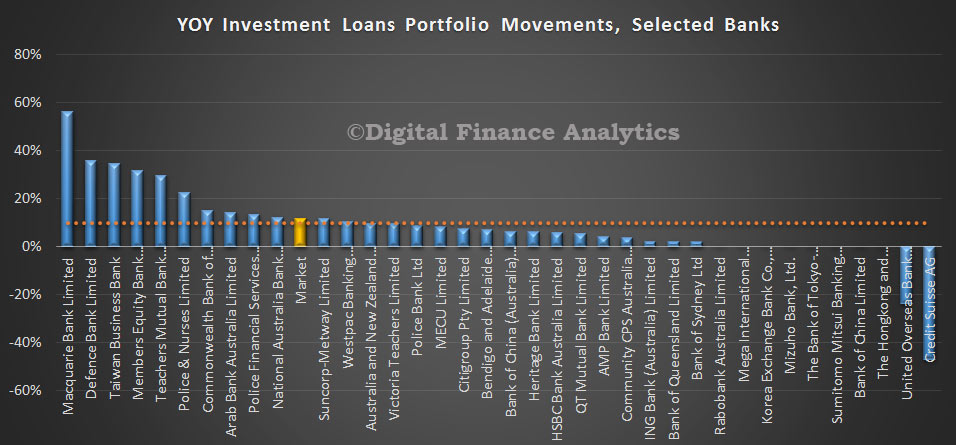
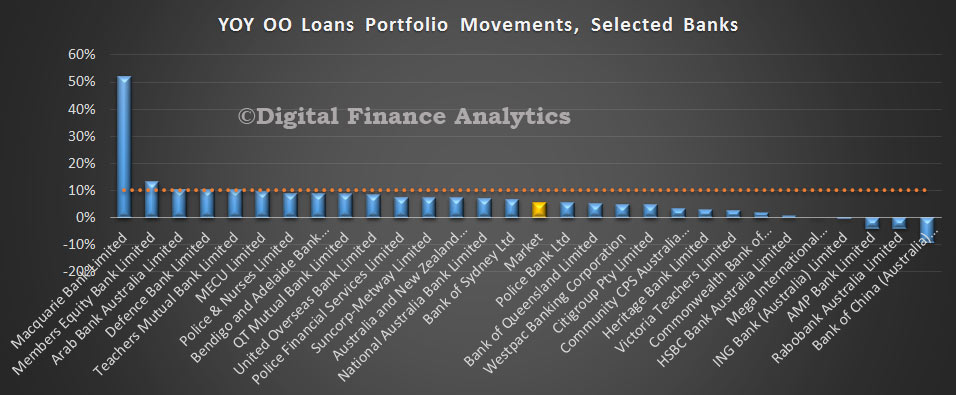
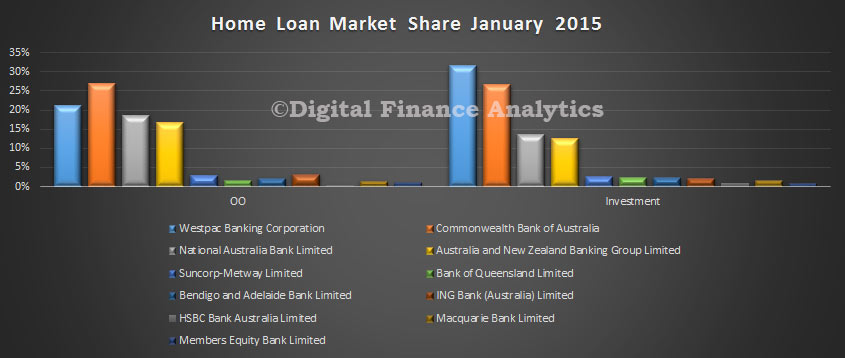
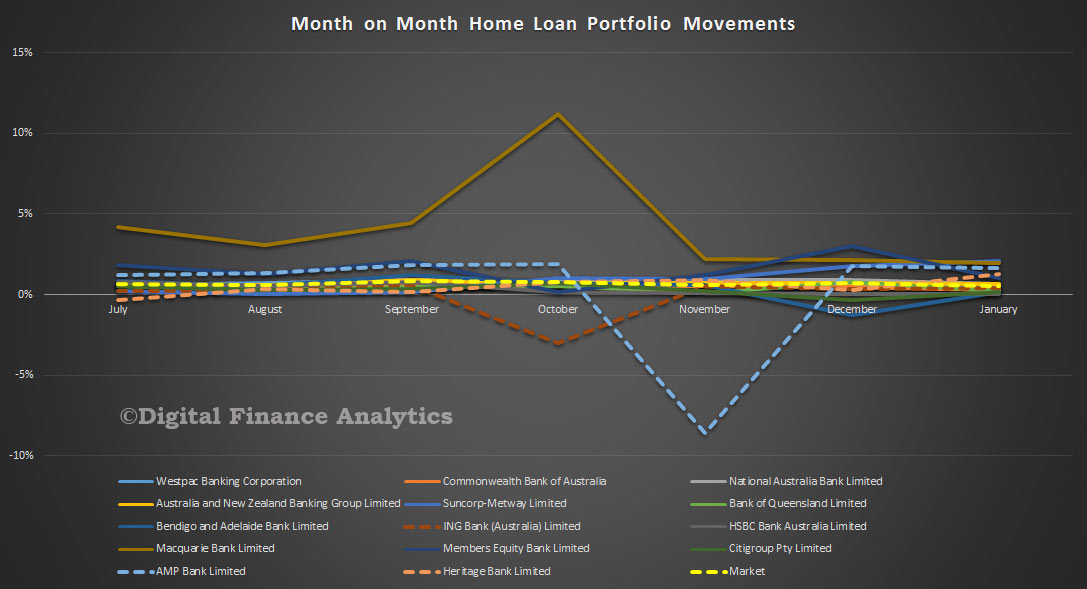
Third, DFA believes, in the interests of good disclosure, and also as part of macroprudential management, the data should be provided at the individual lender level. They already do this for the monthly banking statistics. We know that some banks are more exposed to investment lending (and potentially exceeding 10% growth), yet the whole situation is opaque.

It is really time for proper disclosure, rather than myopic slices of data (even if contained in multiple layered spreadsheets) which mask as much as they hide. Come on APRA, lets get to the true picture.


$40.1 Billion (43.0 per cent) Interest-only Loans Written In 4Q 2014

APRA released their quarterly Property Exposure data to December 2014 today. We see continued strong growth in interest only loans. From DFA research we know these are mostly investment loans, despite the fact that APRA does not split out loan characteristics by investment and owner occupation. We think they should.

At a portfolio level, as at 31 December 2014, the total of residential term loans to households held by all ADIs was $1.28 trillion. This is an increase of $28.3 billion (2.3 per cent) on 30 September 2014 and an increase of $105.4 billion (9.0 per cent) on 31 December 2013. Owner-occupied loans accounted for 65.7 per cent of residential term loans to households. Owner-occupied loans were $840 billion, an increase of $14.8 billion (1.8 per cent) on 30 September 2014 and $57.6 billion (7.4 per cent) on 31 December 2013. Investment loans accounted for 34.3 per cent of residential term loans. Investment loans were $438.9 billion, an increase of $13.6 billion (3.2 per cent) on 30 September 2014 and $47.8 billion (12.2 per cent) on 31 December 2013.

Looking across the various types of ADI:

  • major banks held $1,037.3 billion of residential term loans, an increase of $23.0 billion (2.3 per cent) on 30 September 2014 and $83.7 billion (8.8 per cent) on 31 December 2013;
  • other domestic banks held $142.6 billion, an increase of $7.2 billion (5.3 per cent) on 30 September 2014 and $20.5 billion (16.8 per cent) on 31 December 2013;
  • foreign subsidiary banks held $54.3 billion, a decrease of $0.6 billion (1.1 per cent) on 30 September 2014 and an increase of $1.3 billion (2.5 per cent) on 31 December 2013;
  • building societies held $16.6 billion, an increase of $0.0 billion (0.1 per cent) on 30 September 2014 and a decrease of $0.1 billion (0.6 per cent) on 31 December 2013; and
  • credit unions held $27.9 billion, a decrease of $1.3 billion (4.5 per cent) on 30 September 2014 and an increase of $0.0 billion (0.1 per cent) on 31 December 2013.

Note that the higher growth of other domestic banks and lower growth of building societies and credit unions is in part due to the conversion of eight credit unions and one building society to banks.

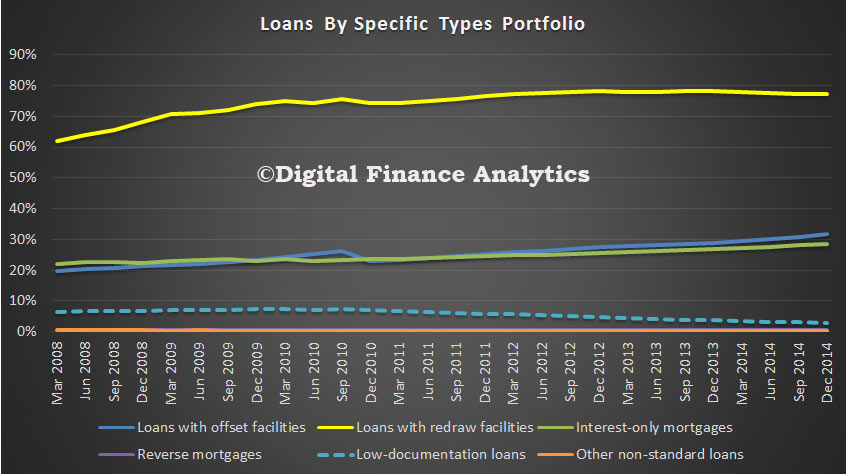
ADIs with greater than $1 billion of residential term loans held 98.4 per cent of all residential term loans as at 31 December 2014. These ADIs reported 5.2 million loans totalling $1.26 trillion. The average loan size was approximately $241,000, compared to $234,000 as at 31 December 2013; $463.8 billion (36.9 per cent) were interest-only loans; and $31.5 billion (2.5 per cent) were low-documentation loans.

APRA-ADILoanPortfolioDec2014ADIs with greater than $1 billion of residential term loans approved $93.2 billion of new loans in the quarter ending 31 December 2014. This is an increase of $7.8 billion (9.2 per cent) on the quarter ending 30 September 2014 and $9.1 billion (10.8 per cent) on the quarter ending 31 December 2013. $58.4 billion (62.7 per cent) were for owner-occupied loans, an increase of $4.9 billion (9.2 per cent) from the quarter ending 30 September 2014; $34.8 billion (37.3 per cent) were for investment loans, an increase of $2.9 billion (9.1 per cent) from the quarter ending 30 September 2014;

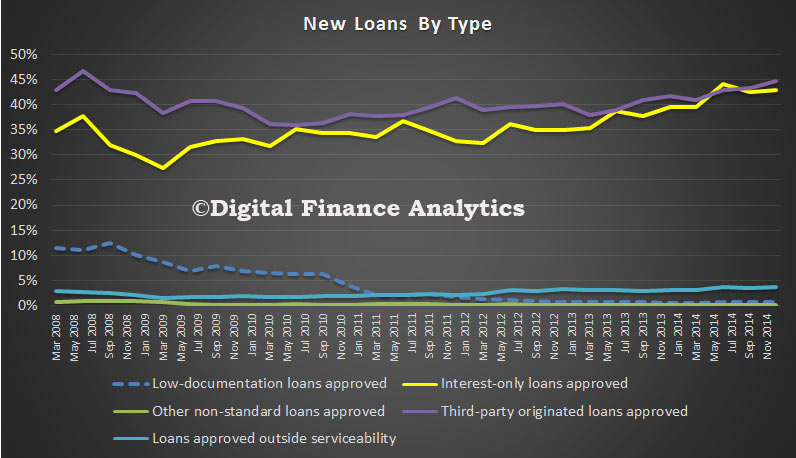
Brokers accounted for 44.7% of loans by value, a record, since 2008. They reached an all time high of 46.7% prior to the GFC. However, if you take loan size into account, brokers continue to have a field day at the moment, thanks to high volumes and high commissions.

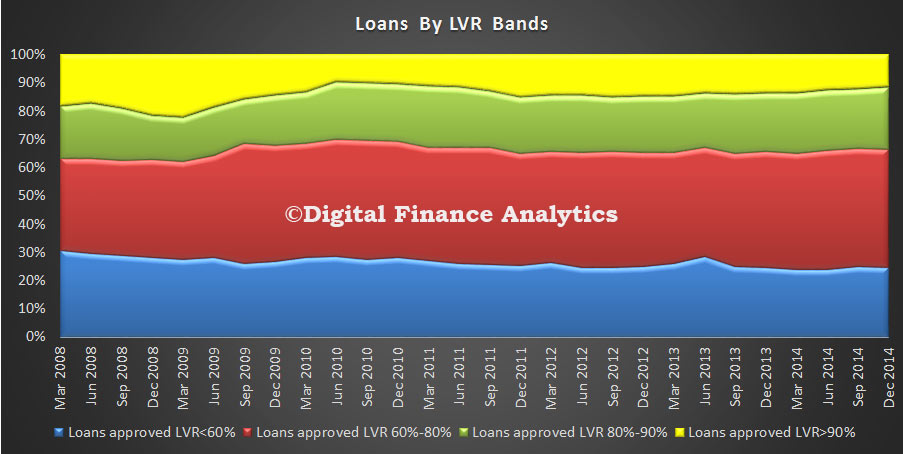
APRA-ADILoanNewDec2014$10.6 billion (11.4 per cent) had a loan-to-valuation ratio greater than or equal to 90 per cent; and $0.6 billion (0.7 per cent) were low-documentation loans.

APRA-ADILoanNewLVRDec2014


Super Now Worth $1.93 Trillion

The Australian Prudential Regulation Authority (APRA) today released its December 2014 Quarterly Superannuation Performance publication and December 2014 Quarterly MySuper Statistics report. At 31 December 2014, total assets, which include the assets of self-managed superannuation funds and the balance of life office statutory funds, rose to $1.93 trillion, an increase of 9.3 per cent from the December 2013 quarter.

Contributions to funds with more than four members over the December 2014 quarter were $26.1 billion, up 15.3 per cent from the December 2013 quarter ($22.7 billion).  Total contributions for the year ending December 2014 were $100.6 billion.

There were $15.2 billion in total benefit payments in the December 2014 quarter, an increase of 9.4 per cent from the December 2013 quarter ($13.9 billion).  Total benefit payments for the year ending December 2014 were $56.4 billion.

Net contribution flows (contributions plus net rollovers less benefit payments) totalled $10 billion in the December 2014 quarter, an increase of 14.9 per cent from the December 2013 quarter ($8.7 billion).  Net contribution flows for the year ending December 2014 were $39.4 billion.

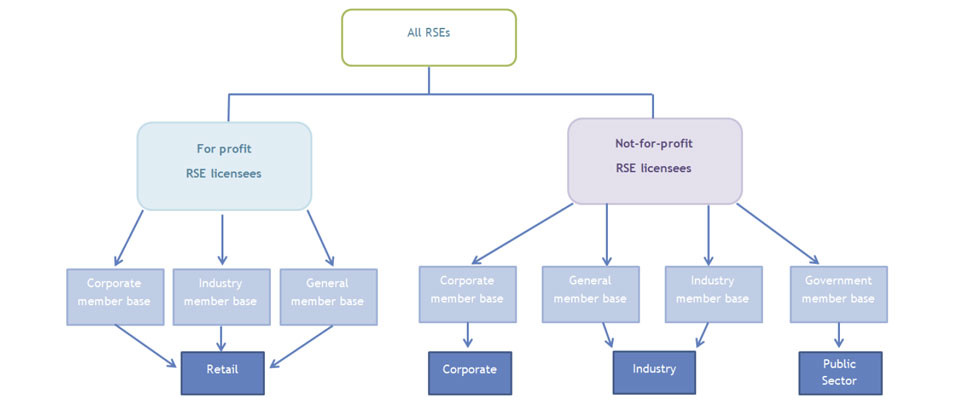
APRA has revised the method of segmentation it uses for these reports.  The segments that APRA most commonly uses for superannuation are fund types. These fund types comprise corporate funds, industry funds, public sector funds, retail funds and small superannuation funds. These segments, based on RSE licensee profit status and the membership base of the funds. These segments, based on RSE licensee profit status and the membership base of the funds, are shown below.

APRA-SuperFund-Segmentation-Dec-2014Corporate funds are RSEs with more than four members under the trusteeship of a ‘not for profit’ RSE licensee and with a corporate membership basis.
Industry funds are RSEs with more than four members under the trusteeship of a ‘not for profit’ RSE licensee and with either an industry or general membership base.
Public sector funds are RSEs with more than four members under the trusteeship of a ‘not for profit’ RSE licensee and with a government base membership base. Public sector funds also include superannuation schemes established by a Commonwealth, State or Territory law (known as exempt public sector superannuation schemes).
Retail funds are RSEs with more than four members under the trusteeship of a ‘for profit’ RSE licensee with a corporate, industry or general membership basis.
Small funds are superannuation entities with fewer than five members and include small APRA funds (SAFs), single-member approved deposit funds and self-managed superannuation funds (SMSFs). SMSFs are regulated by the ATO and have different legislative requirements than APRA regulated funds.

Of the 258 entities in existence at 31 December 2014, there are 45 cases where the fund type is different under the new segmentation methodology. In these cases, APRA analysed the information reported to APRA, the structure of the fund and composition of the RSE licensee as well as other prudential information. APRA also drew on publicly available information and consulted RSE licensees in the cases where the information reported on SRF 001.0 was inconsistent. Following this further analysis, of the 45 entities:

  • 38 entities were re-classified from corporate to retail;
  • four entities were re-classified from industry to retail;
  • one entity was re-classified from retail to industry;
  • one entity was re-classified from corporate to public sector; and
  • one entity was re-classified from industry to public sector.

After the review of fund types, retail funds’ assets increased from $502 billion to $516 billion and account for 39 per cent of total superannuation assets as at 31 December 2014. Industry funds’ assets decreased by $15 billion from $418 billion to $403 billion and account for 31 per cent of total superannuation assets as at 31 December 2014. Public sector funds’ assets increased by $15 billion to $335 billion (to 26 per cent of total superannuation assets), while corporate funds’ assets decreased from $63 billion to $58 billion (to four per cent of total superannuation assets).


Another Bumper Month For Home Loans

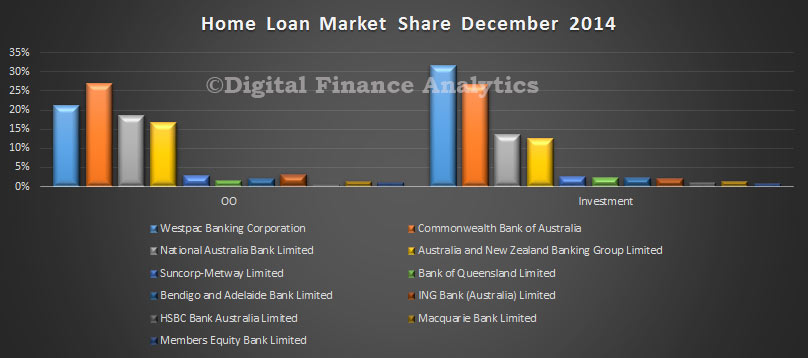
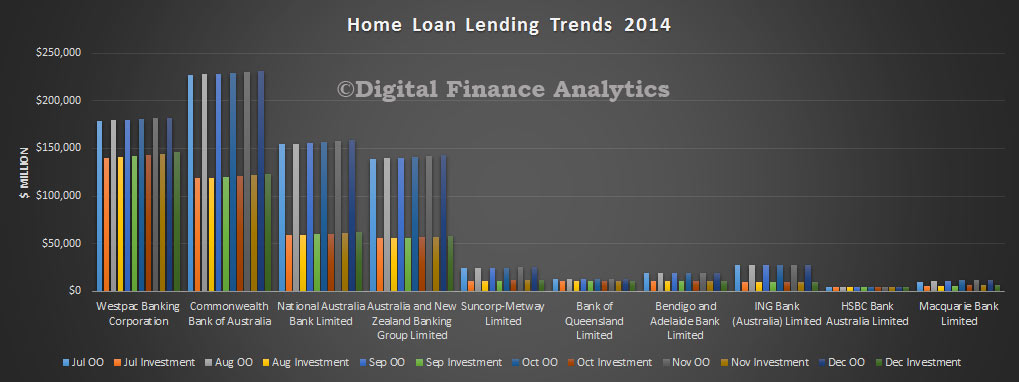
APRA just released their monthly banking statistics, which provides a view of lending and deposit portfolios from the banks (ADI’s). Overall home lending by the banks rose $9.12 billion to $1.315 trillion. Owner Occupied loans grew by 0.59% and Investment Loans by 0.9%, with Owner Occupied Lending now accounting for 65.1% of the loan book (down from 65.2% last month). Looking in more detail at the individual bank data, we see that CBA maintains its leading position in the Owner Occupied sector, whilst WBC leads the Investment Property Lending.

HomeLendingSharesDec2014Looking at the trend data, we see stronger investment lending growth at WBC, and to a lesser extent at the other majors.

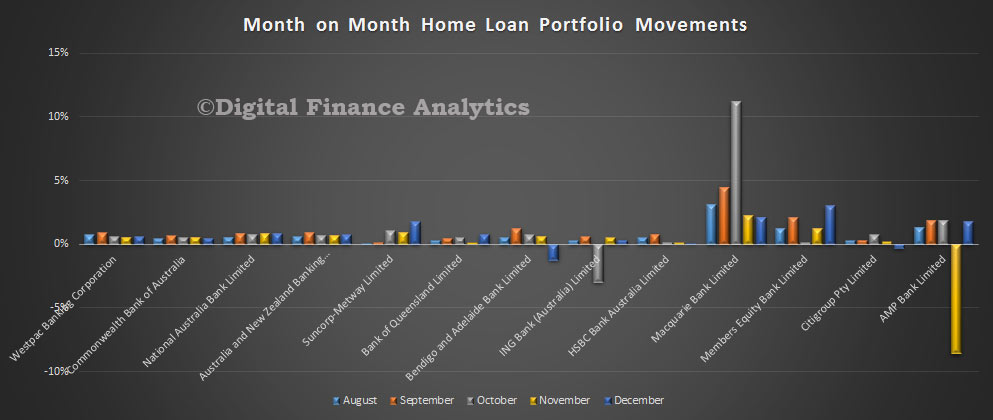
HomeLendingTrendsDec2014In portfolio percentage terms, Members Equity registered 3% growth, with Macquarrie at 2% and Suncorp and AMP at 1.8%, all above system growth.

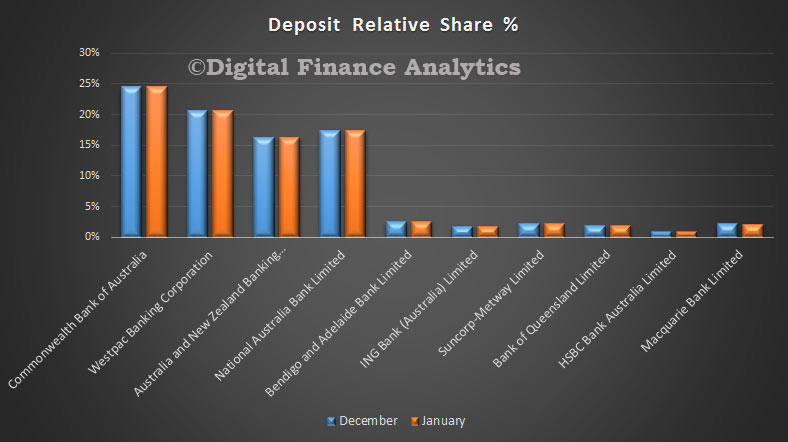
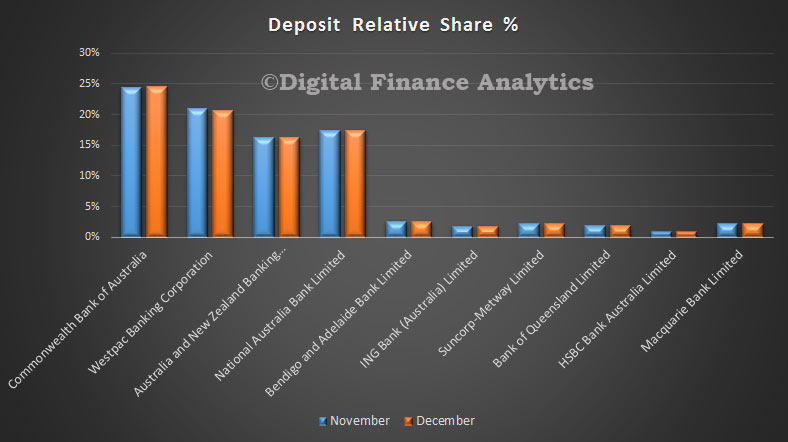
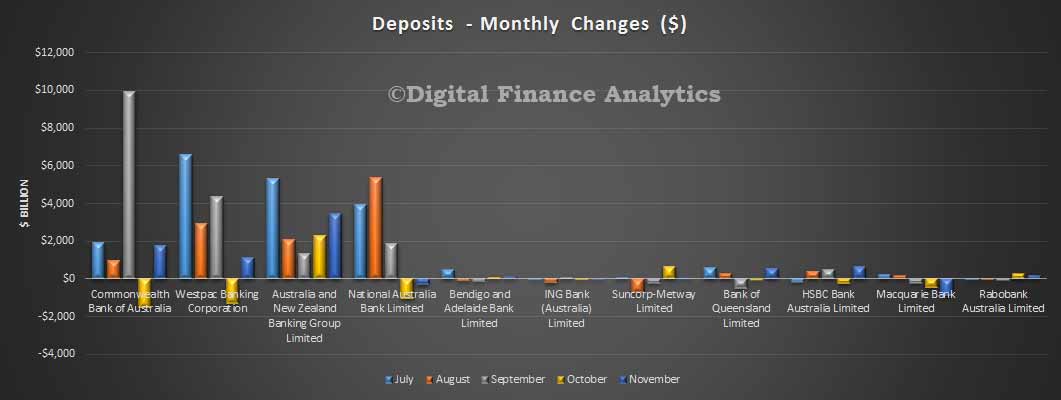
HomeLendingMOMPCDec2014Turning to deposits, we saw growth of 1.37% in the month, to $1.8 trillion. CBA holds the largest share of deposits, with WBC and NAB following.

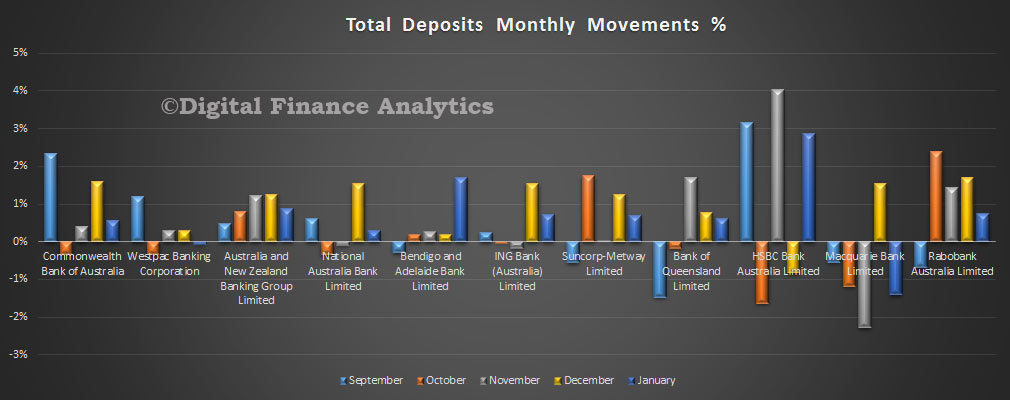
DepositsShareDec2014Looking at the monthly portfolio movements, we see CBA recorded portfolio growth of 1.6%, whilst WBC was 0.29%. Rabbobank grew their portfolio by 1.69%, whilst Macquarie and ING both grew their portfolios by 1.55%. We suspect some players are actively managing their deposits preferring to use wholesale funding alternatives, as we have discussed before.

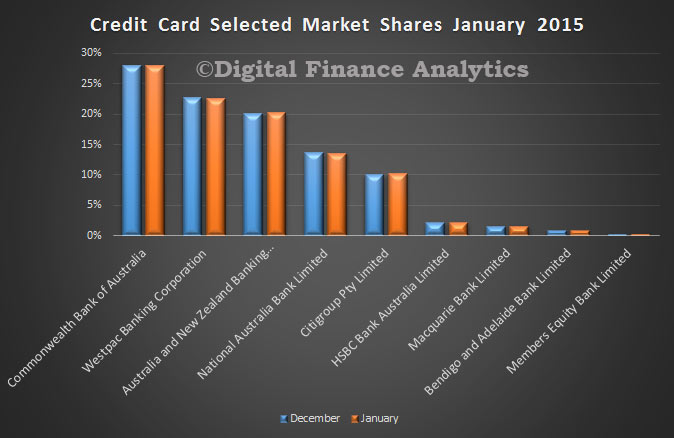
DepositsMonthyMovementsDec2014Looking at credit cards, balances rose 1.9% to $41.8 billion. There was little overall change in portfolio mix amongst the main players, and Citigroup maintained in position at number 5.

CardsShareDec2014

APRA To Regulate Private Health Insurers

The Treasury has today released an Exposure Draft that will establish APRA as the prudential regulator of the private health insurance industry. This is part of the Smaller Government – additional reductions in the number of Australian Government bodies initiative announced as part of the 2014-15 Budget. The Private Health Insurance Administration Council (PHIAC) will cease as a separate body and its prudential supervisory functions will be transferred to the Australian Prudential Regulation Authority (APRA). The transfer of PHIAC’s prudential supervisory functions will be given effect by the Exposure Draft Private Health Insurance (Prudential Supervision) Bill 2015 (Exposure Draft Bill) which will represent a new Act for the regulation of private health insurers, administered by APRA. The main changes are:

  • the registration of private health insurers and the prevention of entities not registered from carrying on a health related business
  • requirement for private health insurers to have health benefits funds and obligations relating to the operation of such funds
  • restructure, merger, acquisition and termination of health benefits funds
  • appointment of an external manager of a health benefit fund and the powers and duties of external managers and terminating managers
  • duties and liabilities of directors
  • establishment of prudential standards and directions by APRA and the requirements for health benefits funds to comply with such standards and directions
  • obligations of private health insurers such as the appointment of actuaries and reporting and notification requirements
  • APRA’s ability to supervise compliance by private health insurers with their obligations and APRA’s enforcement powers
  • enforceable undertakings
  • APRA’s ability to seek remedies for a contravention for an enforceable obligation
  • review of APRA’s decisions by the Administrative Appeals Tribunal (AAT)
  • ability of APRA to give approvals and make determinations and rules

Treasury is seeking feedback by 30th January.

Latest Banking Statistics

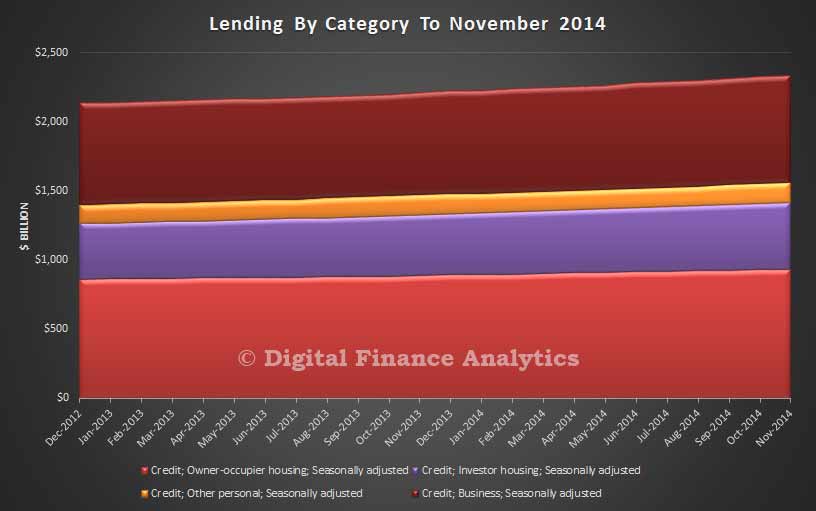
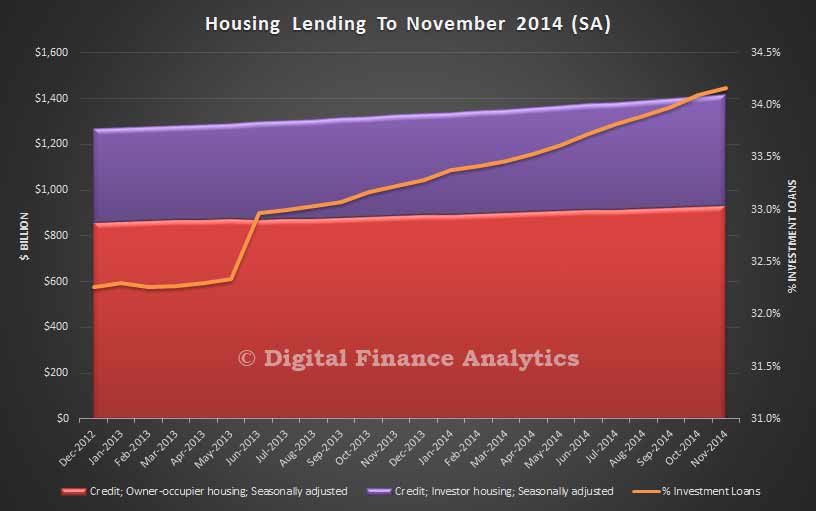
Last week saw the release of the November data from both the RBA and APRA. Looking at the overall summary data first, total credit grew by 5.9% in the year to November 2014. Housing lending grew at 7.1%, business lending at 4.6%, and personal credit by 1.1%.

LendingNoiv2014Looking at home lending, in seasonally adjusted terms, total loans on book rose to $1.42 trillion, with owner occupied loans at $932 billion, and investment loans at $483 billion, which equals 34.2%, a record.

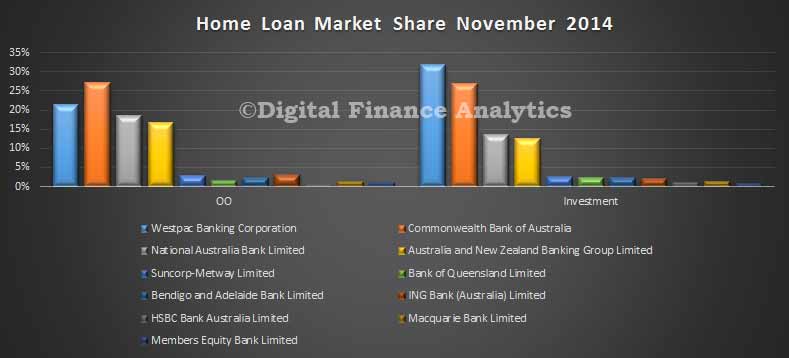
HomeLendingNov2014From the APRA data, loans by ADI’s were $1.31 trillion, with 34.82% investment loans, which grew at 0.84% in the month. Looking at relative shares, CBA continues to hold the largest owner occupied portfolio, whilst WBC holds the largest investment portfolio.

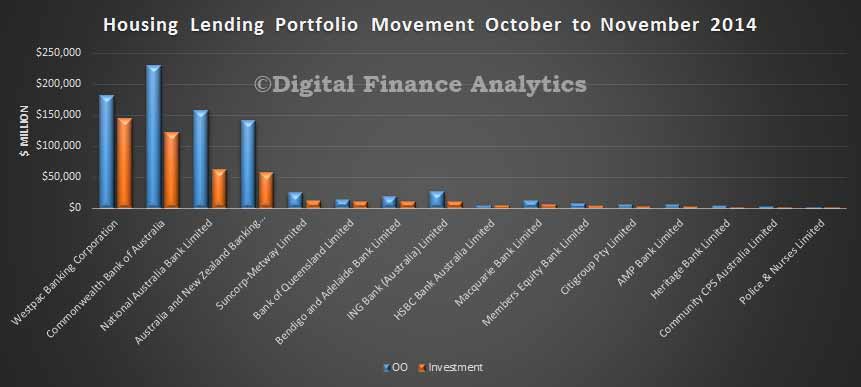
HomeLendingSharesNov2014Looking at relative movement, WBC increased their investment portfolio the most in dollar terms. CBA lifted their owner occupied portfolio the most.

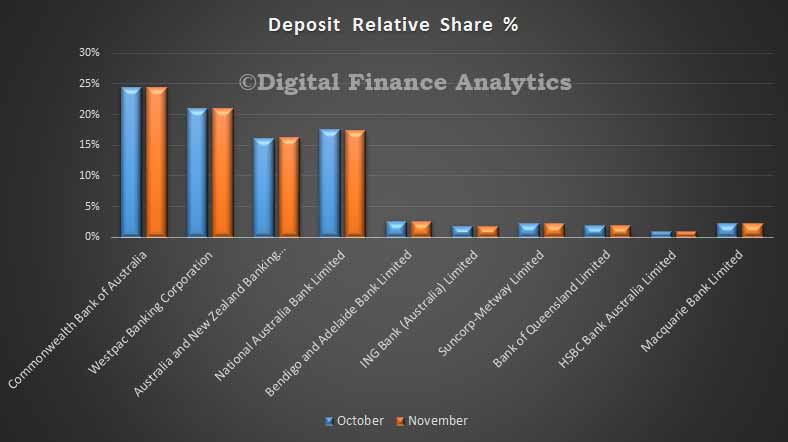
HomeLendingPortfolioMovementsNov2014Turning to deposits, they rose 0.39% in the month, to 1.78 trillion.

DepositSharesNov2014There was little change in relative market share, though we noted a small drop at nab, which relates to their cutting deposit rates from their previous market leading position.

DepositChangesPortfolioNov2014Finally, looking at the cards portfolios, the value of the market portfolio rose by $627 billion, to $41,052 billion. There were only minor portfolio movements between the main players.

CardsShareNov2014

Housing Finance Regulation – Tweaked, Not Reformed

Fresh on the heels of the FSI report, the core thesis of which is that the Australian Banks are too big to fail, so capital buffers must be increased to protect Australia from potential risks in a down turn (a “mild” crash could lead to the loss of 900,000 jobs and a $1-2 trillion or more cost to the economy), it was interesting to see the publication yesterday by APRA of the guidelines for mortgage lending, and ASIC’s targetting interest only loans. This action is coordinated via the Council of Financial Regulators (CFR). This body is the conductor of the regulatory orchestra, and has only had an independant website since 2013.  It is the coordinating body for Australia’s main financial regulatory agencies. It is a non-statutory body whose role is to contribute to the efficiency and effectiveness of financial regulation and to promote stability of the Australian financial system. The Reserve Bank of Australia (RBA) chairs the Council and members include the Australian Prudential Regulation Authority (APRA), the Australian Securities and Investments Commission (ASIC), and The Treasury. The CFR meets in person quarterly or more often if circumstances require it. The meetings are chaired by the RBA Governor, with secretariat support provided by the RBA. In the CFR, members share information, discuss regulatory issues and, if the need arises, coordinate responses to potential threats to financial stability. The CFR also advises Government on the adequacy of Australia’s financial regulatory arrangements.

Whilst FSI recommended beefing up ASIC, and introducing a formal regulatory review body, it did not fundamentally disrupt the current arrangements. Interestingly, CFR is a direct interface between the “independent” RBA and Government.

So, lets consider the announcements yesterday. None of the measures are pure macroprudential, but APRA is reinforcing lending standards by introducing potential supervisory triggers (which if breached may lead to more capital requirements, or other steps) using an affordability floor of 7% or more (meaning if product interest rates fell further, banks could not assume a fall in serviceability requirements) and at least an assumed rise in rates of 2% from current loan product rates. In addition, any lender growing their investment lending book by more than 10% p.a. will be subject to additional focus (though APRA makes the point this is not a hard limit). These guidelines relate to new business, and does not directly impact loans already on book (though refinancing is an interesting question, will existing borrowers who refinance be subject to new lending assessment criteria?) ASIC is focussing on interest-only loans, which are growing fast, and are often related to investment lending.

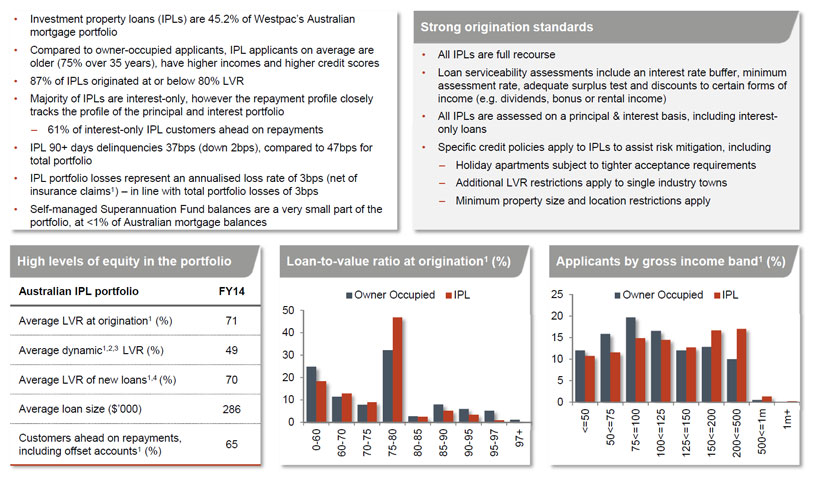
The banks currently have different policies with regards to serviceability buffers. Analysts are looking at Westpac in the light of these announcements, because it grew its investment housing lending book fast, uses 180 basis points serviceability buffer and an interest rate floor of 6.8%. Investment property loans make up ~45% of WBC’s housing loan portfolio (compared with the majors average of ~36%), and has grown at ~12% year on year this financial year (compared with the average across the majors of ~10%). WBC made some interesting comments in their recent investor presentation relating to investment loans, highlighting that investors tended to have higher incomes than owner occupied loans.

WBCInvestorDec2014Other banks have different underwriting formulations with buffers of between 1.5% and 2.25% buffers. ASIC has of course also stressed that lenders must consider borrowers ability to repay and take account other expenditure. There is evidence of the “quiet word from the regulator” working as recently we have noted some slowing investment lending at WBC (currently they would be below the 10% threshold) and amongst some other lenders too. However, some of the smaller lenders may be impacted by APRA guidance, given stronger recent growth.

What does this all mean. First, we see now what APRA meant in their earlier remarks “collecting additional information, counselling the more aggressive lenders, and seeking assurances from Boards of our lenders that they are actively monitoring lending standards. We’re about to finalise guidance on what we see as sound mortgage lending practice”. Second, we do not think this will materially slow down housing investment lending, and this is probably what the RBA wants, given its belief consumer spending should replace mining investment as a source of growth.  The regulators are trying to manage potential risks in the system, by targetting higher risk lending whilst letting housing lending continue to run. Third, it leaves open the door to macroprudential later if needed. Lastly, existing borrowers may be loathe to churn if they are now required to meet additional buffers. This may slow refinancing, and increase longevity of loans in portfolio (and loans held longer are more profitable for the banks).


APRA Reinforces Sound Residential Mortgage Lending Practices

The Australian Prudential Regulation Authority (APRA) has today written to authorised deposit-taking institutions (ADIs) outlining further steps it plans to take to reinforce sound residential mortgage lending practices. These steps have been developed following discussions with other members of the Council of Financial Regulators.

In the context of historically low interest rates, high levels of household debt, strong competition in the housing market and accelerating credit growth, APRA has indicated it will be further increasing the level of supervisory oversight on mortgage lending in the period ahead.

At this point in time, APRA does not propose to introduce across-the-board increases in capital requirements, or caps on particular types of loans, to address current risks in the housing sector. However, APRA has flagged to ADIs that it will be paying particular attention to specific areas of prudential concern. These include:

  • higher risk mortgage lending — for example, high loan-to-income loans, high loan-to-valuation (LVR) loans, interest-only loans to owner occupiers, and loans with very long terms;
  • strong growth in lending to property investors — portfolio growth materially above a threshold of 10 per cent will be an important risk indicator for APRA supervisors in considering the need for further action;
  • loan affordability tests for new borrowers — in APRA’s view, these should incorporate an interest rate buffer of at least 2 per cent above the loan product rate, and a floor lending rate of at least 7 per cent, when assessing borrowers’ ability to service their loans. Good practice would be to maintain a buffer and floor rate comfortably above these levels.

In the first quarter of 2015, APRA supervisors will be reviewing ADIs’ lending practices and, where an ADI is not maintaining a prudent approach, may institute further supervisory action. This could include increases in the level of capital that those individual ADIs are required to hold.

APRA Chairman Wayne Byres noted that while in many cases ADIs already operate in line with these expectations, the steps announced today will help guard against a relaxation of lending standards and, where relevant, prompt some ADIs to adopt a more prudent approach in the current environment.

‘This is a measured and targeted response to emerging pressures in the housing market. These steps represent a dialling up in the intensity of APRA’s supervision, proportionate to the current level of risk and targeted at specific higher risk lending practices in individual ADIs’ he said.

‘There are other steps open to APRA, should risks intensify or lending standards weaken and, in conjunction with other members of the Council of Financial Regulators, we will continue to keep these under active review.’

The steps announced today build on the enhanced monitoring and supervisory oversight of residential mortgage lending risks that APRA has put in place over the past year, which has included a major stress test of the banking industry, targeted reviews of ADIs’ residential mortgage lending and the release of detailed guidance to ADIs on sound residential mortgage lending practices.

APRA’s heightened supervisory focus on lending standards will be conducted in conjunction with the review of interest-only lending announced today by the Australian Securities and Investments Commission (ASIC). APRA and other members of the Council of Financial Regulators will continue to work closely together to monitor, assess and respond to risks in the housing market as they develop.

Today’s letter to ADIs can be found on the APRA website here: www.apra.gov.au/adi/Publications/Pages/other-information-for-adis.aspx
BACKGROUND

Q: What impact does APRA expect this announcement to have?
A: The aim of this announcement is to further reinforce sound residential mortgage lending practices in the context of historically low interest rates, high levels of household debt, strong competition in the housing market and accelerating housing credit growth. We expect this announcement will help guard against any relaxation of lending standards, and also prompt some ADIs to reinforce their lending practices where there is scope for a more prudent approach in the current risk environment.

Q: What ‘higher risk lending’ practices will APRA be focussing on?
A: APRA will be focussing on the extent to which ADIs are lending at high multiples of borrower’s income, lending at high loan-to-valuation ratios, lending on an interest-only basis to owner-occupiers for lengthy periods and lending for very long terms.

Q: How was the 10 per cent threshold for investor lending determined?
A: The 10 per cent benchmark is not a hard limit, but is a key risk indicator for supervisors in the current environment. The benchmark has been established after advice from members of the Council of Financial Regulators, taking into account a range of factors including income growth and recent market trends.

Q: How was the 2 per cent buffer and 7 per cent floor lending rate determined?
A: The guidance on serviceability assessments was based on a number of considerations, including past increases in lending rates in Australia and other jurisdictions, market forecasts for interest rates, international benchmarks for serviceability buffers, and long-run average lending rates.

Q: Is the 10 per cent growth in investor lending, or the 2 per cent buffer, a hard limit?
A: No. These figures are intended to be trigger points for more intense supervisory action.  Where banks are achieving materially faster growth, utilising a lower buffer, and/or otherwise materially growing the other higher risk parts of their portfolio, it will be a trigger for supervisors to consider whether more intensive supervisory action, including higher capital requirements, may be warranted.

Q: What sort of supervisory action might be considered if banks exceed these thresholds?
A: There are a range of actions that APRA can take, depending on the circumstances. These could include some or all of increased reporting obligations, additional on-site reviews, mandated reviews by external parties, and higher capital requirements.

Q: How may this affect borrowers from obtaining home loans from ADIs?
A: APRA does not expect this to have any effect on the availability of credit for people borrowing within their means to purchase a home. ADIs already conduct affordability tests to ensure that new borrowers are not overstretching themselves to purchase property, or relying on expectations of future increases in house prices to afford to do so. This guidance will primarily guard against any further relaxation in standards.

Q. Why has APRA not introduced high LVR or serviceability limits, as in other countries?
A: In short, we do not see those sorts of limits as necessary or appropriate at this stage.  APRA’s response has been targeted on the specific areas of prudential concern in the current environment: these include risks around serviceability when interest rates are at historically low levels, strong investor loan growth and broader considerations of each ADI’s risk profile. The impact of any APRA actions will therefore be felt by those banks pursing higher risk lending strategies and/or using lower loan underwriting standards.

There is, of course, a range of further actions that could be taken in relation to residential mortgage lending practices if the risk outlook intensifies, and APRA  will continue to keep these under review as market conditions and lending standards evolve.

Q: What role did the Council of Financial Regulators play in the decision-making?
A: Given that these supervisory tools sit within APRA’s supervisory and regulatory framework, APRA is ultimately responsible for determining the appropriate supervisory response. However, we have taken advice from other members of the Council of Financial Regulators in developing our approach, and will continue to do so. ASIC has also today announced a review that it will be carrying out a review of interest-only lending, which will support APRA’s efforts to reinforce sound lending practices.

Q: Why is there a threshold for growth in investor lending, not total housing credit?
A: There is currently very strong growth in lending to property investors, as highlighted by the Reserve Bank in its most recent Financial Stability Review (FSR). This is leading to imbalances in the housing market; the RBA noted in the FSR that “the direct risks to financial institutions would increase if these high rates of lending growth persist, or increase further.” APRA’s approach has therefore sought to target the higher areas of risk.

Q: Does this relate to the recommendation on risk weights in the Financial System Inquiry report?
A: No. The recommendation on risk weights in the FSI report is focused on competitive issues with risk modelling, whereas the announcement today is in relation to further supervisory steps to address specific risks in residential mortgage lending.

The Australian Prudential Regulation Authority (APRA) is the prudential regulator of the Australian financial services industry. It oversees Australia’s banks, credit unions, building societies, life and general insurance companies and reinsurance companies, friendly societies and most of the superannuation industry. APRA is funded largely by the industries that it supervises. It was established on 1 July 1998. APRA currently supervises institutions holding $4.9 trillion in assets for Australian depositors, policyholders and superannuation fund members.

Investment Lending Burns Bright

APRA released their monthly banking statistics for October 2014 today. The total value of housing lending rose to $1.298 trillion, from $1.288 in September, up 0.81%. Of this however, Investment lending rose 1.03% by $4.59 billion and Owner Occupied Lending rose 0.69% by $5.79 billion. This data relates the the banks (ADI’s) excluding the non-bank sector. This is normally about $110 billion.

Looking in detail at the bank by banks analysis, we see a familiar set of trends.

HomeLendingOctober2014ByADIWestpac leads the pack on investment mortgage lending, with a 31.8% share, whilst CBA leads with owner occupied lending with 27.1% share.

HomeLendingSharesOctober2014ByADILooking at the movements, only ING Bank recorded a fall in value in their portfolio. Macquarie grew the strongest. This relates to the $1.5 billion portfolio of non-branded mortgages they purchased from ING in September.

HomeLendingMovementsOctober2014ByADILooking in percentage terms, we see that Macquarie and AMP grew well above system, and ING below in October.

HomeLendingPCMovementsOctober2014ByADITurning to deposits, they fell by 0.06% in the month, to a value of $1.76 trillion. There was little movement between players, though given the growth in loans above, it is clear that wholesale funding is being accessed now, and this explains the continued fall in deposit interest rates.

DepositTotalsOctoberCBA maintains its position as the largest deposit holder, with 24.5% of the market.

DepositSharesOct2014

Looking at movements, we see Rabobank growing their deposits in percentage terms the strongest in the month, a reversal from previous recent months. Other than ANZ, the majors all lost a little share. Suncorp grew its book also.

DepositMovementsOctoberIn cards, balances rose by about $50 million, to $40.4 billion.

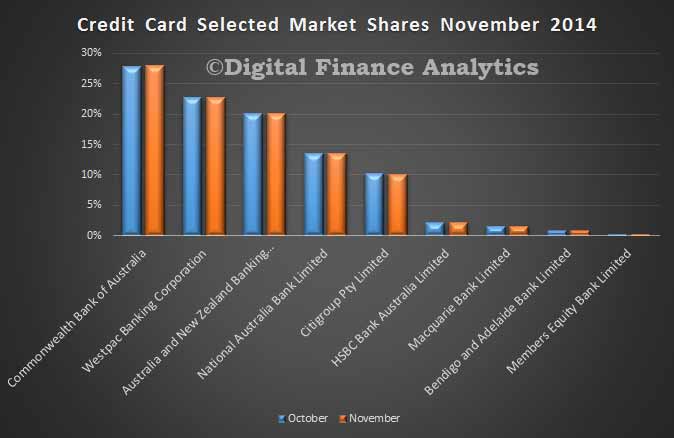
CardBalancesOct2014CBA continues to hold the largest cards share with 27.8% of the market.

CardSharesOct2014

Banks And Their Capital

APRA today published the quarterly ADI performance statistics to September 2014.

Over the year ending 30 September 2014, ADIs recorded net profit after tax of $33.5 billion. This is an increase of $3.6 billion (12.0 per cent) on the year ending 30 September 2013.

As at 30 September 2014, the total assets of ADIs were $4.2 trillion, an increase of $345.0 billion (9.1 per cent) over the year. The total capital base of ADIs was $210.4 billion at 30 September 2014 and risk-weighted assets were $1.7 trillion at that date. The capital adequacy ratio for all ADIs was 12.4 per cent.

Impaired assets and past due items were $29.1 billion, a decrease of $7.4 billion (20.3 per cent) over the year. Total provisions were $16.6 billion, a decrease of $6.1 billion (26.9 per cent) over the year.

We have been looking at the relative capital positions of the banks, highly relevant in the current climate where we expect the FSI inquiry report to be commenting on this, as well as the current regulatory reviews, globally and locally.

So we have taken the All Bank data and compared the Tier 1 capital ratio (the yellow line) with a plot of the ratio of lending to capital held. Because the mix of loans has changed, with a greater proportion relating to lending for housing, and the fact that these loans have lower capital weighting, the reported Tier 1 capital is significantly better than the true, unweighted position. In fact, banks are holding relatively less capital against their loan books now compared with before the GFC. This is one reason why capital ratios are under review.

Capital-AnalysisALL-Sept-2014Now, if we look only at the APRA data for the big four banks, we see an even wider divergence, enabled by the advanced capital calculations which enable these banks to hold even less capital against certain housing loan categories. This places the major banks at a competitive pricing advantage.

Capital-Analysis-Sept-2014Almost certainly, the majors will be required, in due course to hold more capital, and this may tilt the playing field towards some of the smaller players. It may also mean lower returns of deposit accounts, and and reduced loan discounting. Overall profitability for some players will also be tested, though we believe there is plenty of slack in the system currently.