Australia’s Home Price Growth Nothing Special

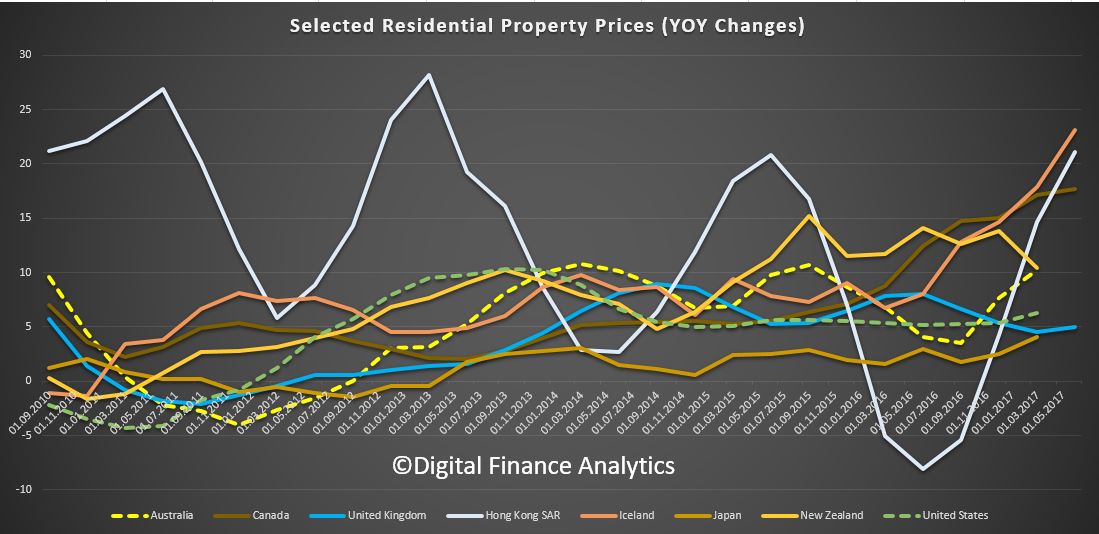
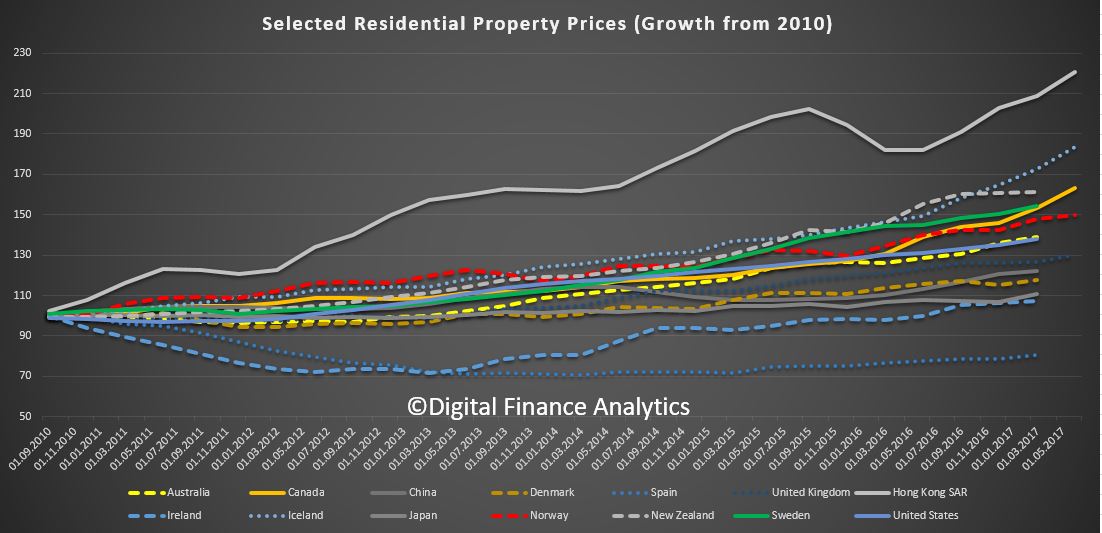
The latest data from the BIS, which tracks residential property price growth has been released. It shows that home price inflation is widespread across many countries, and in that context, Australia (average 8 capital cities) is nothing special, we are in the middle of the pack.

Base-lined in 2010, this data series is the most comprehensive available, though with all the issues of matching data from multiple sources and translating it to a common basis. In most cases, this series covers all types of dwellings in markets for both new and existing dwellings in the country as a whole.

Hong Kong has the strongest growth, and New Zealand and Canada are both well ahead of Australia.  We track quite closely with the USA. Spain sits at the bottom of the selected series.

We can also look at the change YOY, which shows that Australian residential prices are accelerating, whilst the macroprudential measures deployed in New Zealand is slowing growth there. Iceland, Canada and Hong Kong are all accelerating.

Two observations. First home price growth is not just a local issue – as we discussed recently there are a range of complex factors driving asset prices higher.

Second, whilst we are in middle of the pack in terms of home price growth, our total debt burden is much higher, we are near the top of the pack on this measure. Once again driven by a complex range of interrelated factors.

The interplay of accounting and regulation and its impact on bank behaviour

According to a new working paper – from BIS, accounting and regulatory standards are pulling in different directions, and as a result bank risks may be misinterpreted.

Accounting rules and disclosure standards are important determinants for banks’ incentives and behaviour, and the recent financial crisis, where criticism was voiced (eg regarding the role of fair value accounting of financial assets and incurred loss provisioning of loans), is just another example of the importance and relevance of banks’ financial reporting in a regulatory and supervisory context.

In March 2013, the Basel Committee’s Research Task Force initiated a work stream that deals with aspects of the interplay of accounting and regulation and its impact on bank behaviour from a research perspective. Specifically, the work stream was tasked to “identify ways in which the interaction between accounting and regulatory rules provides incentives that affect the risk taking of financial institutions”, and it commenced research on specific aspects of loan loss provisioning, disclosure rules, fair value accounting, and prudential filters.

In summary, the results described in this report as well as the conclusions from other studies reported in Basel Committee working paper 28 suggest that both in the context of loan loss provisioning and the valuation of banks’ assets, there is a tension between backward-looking and forward-looking measurement. This observation is also consistent with the mixed picture that is given by the analytical results regarding several research questions. One conclusion is that corner solutions in one or the other direction do not seem optimal, and that an adequate mix of the two concepts may be superior. The other conclusion is that further evidence on the research questions posed is clearly needed. For example, all projects of the work stream focus on quantities, but not on prices of financial instruments (eg loan rates or yields of securities). Therefore, researchers are encouraged to further address the interplay of accounting and regulation and its impact on bank behaviour from an academic perspective.

Note: The Working Papers of the Basel Committee on Banking Supervision contain analysis carried out by experts of the Basel Committee or its working groups. They may also reflect work carried out by one or more member institutions or by its Secretariat. The subjects of the Working Papers are of topical interest to supervisors and are technical in character. The views expressed in the Working Papers are those of their authors and do not represent the official views of the Basel Committee, its member institutions or the BIS.

How Do Our Banks Compare?

In the just released Bank for International Settlements report, there is some interesting comparative country data on banks around the world, relative to the big four in Australia.

Such comparisons are always fraught with difficulty, as definitions may vary, but they also show trends over recent years, so we can look across the years too.

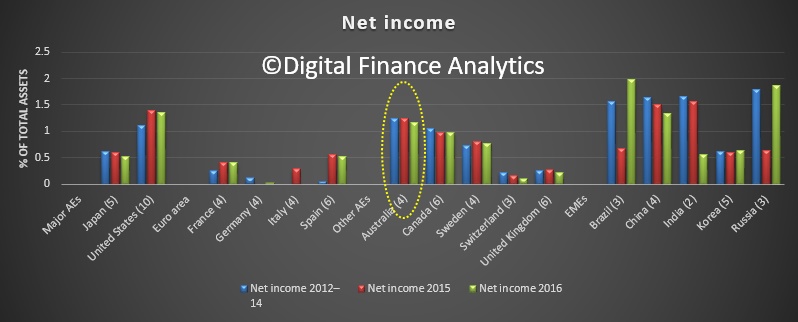
These charts make relative comparisons against total assets held. Australian banks are generating high returns on assets, compared with many advanced economies, though US banks are roaring back as conditions there improve.

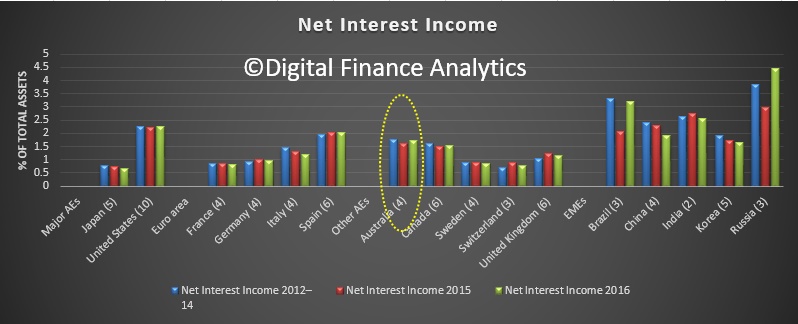
Within income, net interest income is relatively higher compared with the UK, and many other European centres, though lower than USA.

Fees and commissions are relatively lower because Australian banks have lower investment banking income.

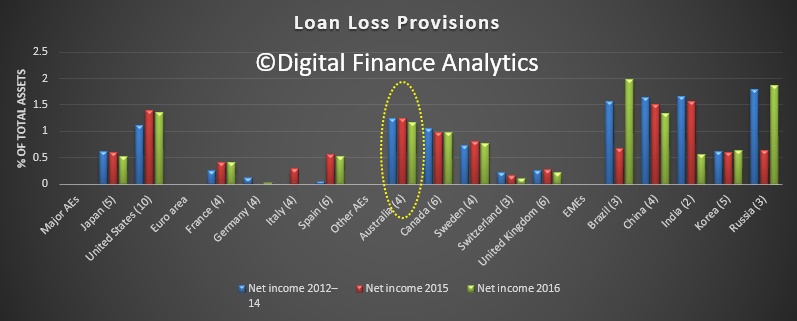
Provisions are higher.

In recent years, bank profitability has been hamstrung by tepid economic growth, low interest rates and relatively muted client activity. Yet, with the global recovery maturing and monetary policy in key jurisdictions poised for a gradual tightening, the outlook for banks’ bottom line is now improving. This underlines the need for banks to use the “growth dividend” of dissipating headwinds to complete the adjustment of their business models to the post-crisis reality.

Conjunctural factors continued to be a drag on profitability, even though the impact varied across regions. Net income, for example, remained well below pre-Great Financial Crisis (GFC) levels. Relative to total assets, it hovered around zero across much of Europe and was only slightly higher in many other jurisdictions, including key emerging market economies (EMEs). Past years of low and declining interest rates had eroded yields on earning assets. Even though interest expenses also declined, assets typically repriced more quickly, weighing on net interest income. Revenue from fees and commissions and other capital market activities also remained subdued. That said, corporate bond issuance and merger and acquisition (M&A) activity supported bank revenues in jurisdictions such as the United States.

There are now signs that conjunctural headwinds are receding. To the extent that economic activity continues to strengthen, higher interest rates and rising term spreads should support intermediation margins. Stronger demand for banking services and higher capitalisation levels, in turn, should underpin business volume and balance sheet expansion. And both revenue growth and capital buffers would help cushion any interest rate-driven valuation losses on securities portfolios. Post80 BIS 87th Annual Report crisis declines in interest rates have increased the duration of outstanding securities, making unhedged fixed income positions vulnerable to mark-to-market losses. Such pressures could be particularly pronounced in a context of tightening US dollar funding conditions (see below).

Individual banks’ ability to benefit from the improved macroeconomic backdrop and rising interest rates depends on a number of factors. One is asset composition: revenue growth is driven by the rollover of maturing fixed rate assets and loans and, hence, depends on the share of fixed rate versus floating rate assets.

On the liabilities side, core deposits are known to be relatively price-insensitive. Since they are a key funding source for many banks, increases in funding costs generally lag those in short-term rates. In addition, moderately stronger economic growth and higher rates tend to boost client activity across several business lines.

Indeed, starting in mid-2016 capital market revenues benefited from higher market volatility after the Brexit referendum and in anticipation of US policy rate action

Another factor is asset quality. This should generally improve as GDP growth picks up, unemployment declines and rising demand supports the corporate sector.

In most advanced economies, expectations are that this will help non-performing loans (NPLs) to level off and ultimately decline. That said, banking systems in some jurisdictions still look vulnerable to a further deterioration in credit quality. In a number of euro area countries, for example, the share of NPLs remains stubbornly high. Structural factors, such as ineffective legal frameworks and defective secondary markets for NPLs, have been hindering the resolution of problem loans.

The outlook for asset quality becomes more differentiated once countries’ position in the financial cycle is considered. Standard metrics, such as credit-to-GDP gaps, signal financial stability risks in a number of EMEs, including China and other parts of emerging Asia. Gaps are also elevated in some advanced economies, such as Canada, where problems at a large mortgage lender and the credit rating downgrade of six of the country’s major banks highlighted risks related to rising consumer debt and high property valuations.2 While banks’ NPL ratios in all these countries mostly remained low, a majority of EMEs have continued to see financial booms, flattering credit quality indicators. Thus, loan performance should be expected to deteriorate once the financial cycle turns. In addition, pressures could also emerge as a result of spillovers from tighter US monetary policy. In some Asian economies, for example, non-financial corporates took advantage of easy global financing conditions to leverage up in US dollars. Many of these corporates may thus find themselves unhedged and exposed to currency mismatches if their domestic currencies depreciate. Any balance sheet strains, therefore, could ultimately feed into banks’ credit risk exposures.


The Problem With High Household Debt

The Bank for International Settlements has published their 87th Annual Report, to March 2017.  They say there are encouraging signs of economic recovery, but point to risks from high household debt and over-reliance on monetary policy.  They call for a rebalancing of policy towards structural reform.

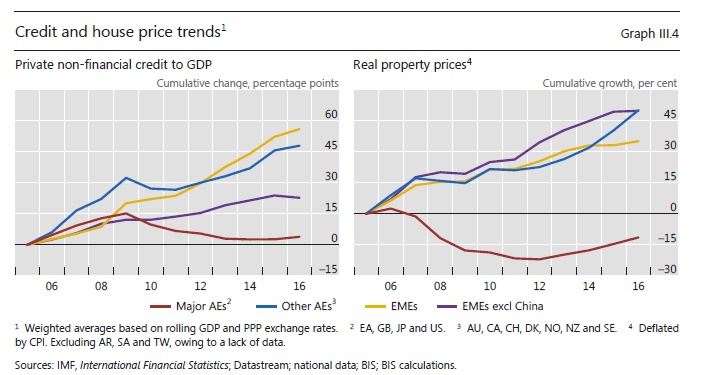
They underscore the risks which result from over investment in housing, and excessive credit and make the point that in Australia, Canada, Sweden and Switzerland, household debt rose by 2–3 percentage points in 2016, to 86–128% of GDP. True growth comes from productive economic investment, not ever more housing debt, which becomes a real problem should interest rates rise.

They say that high levels of debt servicing will have a dampening impact on future economic growth.

It is well recognised that household borrowing is an important aspect of financial inclusion and can play useful economic roles, including smoothing consumption over time. At the same time, rapid household credit growth has featured prominently in financial cycle booms and busts. For one, household debt – or debt more generally – outpacing GDP growth over prolonged periods is a robust early warning indicator of financial stress.

The adverse effects of excessive credit growth can also be magnified by the economy’s supply side response. For example, banks’ stronger willingness to extend mortgages may feed an unsustainable housing boom and overinvestment in the construction sector, which may crowd out investment opportunities in higher-productivity sectors. Credit booms tend to go hand in hand with a misallocation of resources – most notably towards the construction sector – and a slowdown in productivity growth, with long-lasting adverse effects on the real economy.

Additional risks to consumption arise from elevated levels of household debt, in particular given the prospect of higher interest rates. Recent evidence from a sample of advanced economies suggests that increasing household debt in relation to GDP has boosted consumption in the short term, but this has tended to be followed by sub-par medium-term macroeconomic performance.

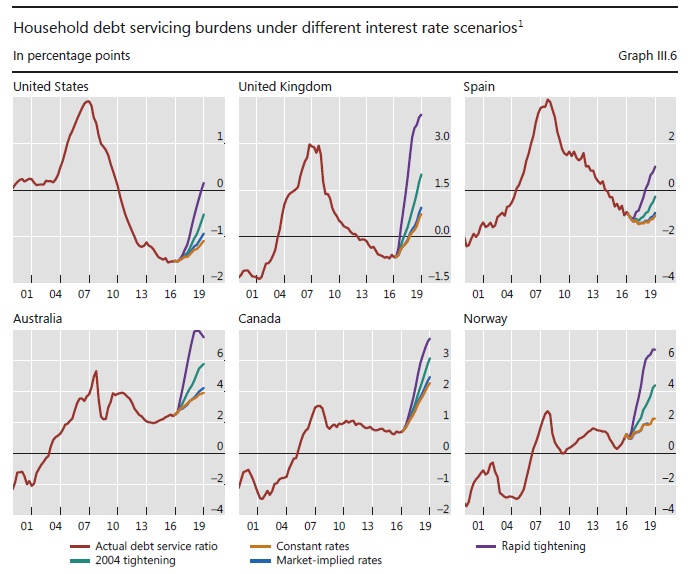
It is possible to assess the effect of higher interest rates on debt service burdens through illustrative simulations. These capture the dynamic relationships between the two components of the DSR (the credit-to-income ratio and the nominal interest rate on debt), real residential property prices, real GDP and the three month money market interest rate. Crisis-hit countries, where households have deleveraged post-crisis, appear relatively resilient to rising interest rates. In most cases  considered, debt service burdens remain close to long-run averages even in a scenario in which short-term interest rates increase rapidly to end-2007 levels. By contrast, in countries that experienced rapid rises in household debt over recent years, DSRs are already above their historical average and would be pushed up further by higher interest rates.

Why Talk of Bank Capital ‘Floors’ Is Raising the Roof

From The IMFBlog.

Calculating how much capital banks should hold is often a bone of contention between regulators and banks. While there has been considerable progress on reaching consensus on an international standard, one key issue remains unresolved. This is a proposal to establish a “floor,” or minimum, for the level of capital the largest banks must maintain.

Some financial institutions and national authorities question the need for a “floor,’’ arguing either that differences in business models or other elements of the global regulatory framework—notably limits on the amount of leverage banks may take on—make them redundant. We disagree. The floor reduces the chances that banks can game the system to reduce their capital buffers to levels that aren’t aligned with their risks. It is an essential element of global efforts to create a level playing field for banks operating across countries by strengthening common standards for regulation, supervision and risk management.

Why is the issue of calculating capital levels so important? Bank capital serves as a buffer available to absorb losses. When capital is depleted, deposits and other borrowed funds are put at risk, and this can lead to bank runs, bank failures and wider systemic distress. Banks should hold capital commensurate with the business risks they take and the risks they pose to the wider system.

Key element

The Basel Committee on Banking Supervision, which brings together regulators from 28 countries, establishes rules governing the appropriate level of capital. The current version of these rules, known as Basel III, is a key element of the international regulatory reform agenda put in motion following the global financial crisis of 2008.

Adopted in late 2010 for implementation over a seven-year period, Basel III has led to a significantly safer financial system. Not only are banks capitalized with more and higher-quality capital than before, they also meet new standards for liquidity risk (ensuring banks hold enough liquid assets to meet maturing liabilities in times of stress) and limits on leverage (how much banks can borrow relative to their capital.)

The largest global banks have been gradually allowed to use their own internal models to calculate capital needed for different types of risk. The Basel Accord of 1988, known as Basel I, used only standard risk weights provided by supervisors. In 1996, some banks were allowed to develop their own, internal models for evaluating market risk.

Safety net

Basel II, adopted in 2004, introduced both a standardized approach (similar to Basel I but using risk weights based on external credit ratings) and an internal ratings-based approach (based on banks’ own internal models). But it added a wrinkle: banks had to apply both approaches for a period of two to three years before being fully reliant on their internal models. And, in addition, capital levels had to be at least as conservative as a “floor” equivalent to 80 percent of the level calculated from standard risk weights.

The floor serves as a safety net to internal risk-based approaches. It gives banks and their supervisors time to intervene should changes be needed before signing off on the use of full-fledged internal models. Basel III kept the internal models from Basel II, but it did not keep the floor. The Basel committee now seeks to reintroduce the floor.

Why is the issue contentious? In testing whether the new method was being applied consistently across institutions in different countries, the Basel Committee found that banks with similar portfolios came up with very different capital requirements when they used internal models. This raised the possibility that some banks were underestimating the risks or gaming the models to deliver outcomes that required less capital. Hence addressing risk weight variability became a top priority.

To solve this problem, the Basel Committee considered several proposals:

  • Revising the standardized approach to better capture the riskiness of bank assets, making it a better complement to the internal risk-based approach;
  • limiting the use of the internal risk-based approach; and
  • implementing a floor to mitigate internal model risk and to make it easier to compare outcomes across banks.

The floor—though not new—would become a more permanent feature of the enhanced Basel III capital framework, based on the revised standardized approach. This approach offers the best of both worlds: the flexibility of the internal models combined with the minimum standard represented by the floor.

The discussion raging now is whether there is a need for a floor, given that the leverage ratio established under Basel III serves already as backstop. And if there is a floor, should it be set at 80 percent, as specified in Basel II, or some other level?

Banks’ concerns

Some banks using internal models worry that their capital requirements could go up if these floors were applied, which would reduce their profitability. The governing body of the Basel Committee, however, has emphasized that the enhancements to Basel III should not lead to a significant, overall increase in capital requirements across banks.

It is our view that the risk-weighted capital adequacy ratio, leverage ratio and output floors are all essential elements of a robust capital framework:

  • The capital adequacy ratio relates risk to capital, but it is complex and makes it difficult to compare capital outcomes among banks.
  • The leverage ratio constrains the overall ability of the bank to grow its balance sheet out of proportion to capital. It is not risk sensitive but is simple to calculate and provides a backstop to the risk-weighted capital ratio.

 The floor addresses the risk that a model may not perform as expected when banks use it to calculate capital. It allows banks to continue using more risk-sensitive approaches but constraints any unwarranted capital relief, while also making it easier to compare institutions through disclosure of the standardized approach outputs.

While we welcome the additional risk sensitivity that internal models bring, we remain cautious about their unconstrained use. Supervisory capacity to ensure effective prudential oversight of internal models remains a work in progress. At the same time, banks will always have incentives to game the models and reduce the amount of capital they hold. Indeed, a recent study by Federal Reserve economists finds manipulation of risk weights to be widespread.

Well-capitalized banks are more likely to lend to the real economy and less likely to indulge in excessive risk-taking that could threaten the stability of the financial system. This only strengthens the case for a robust capital framework.

Properly calibrated and carefully phased, the Basel III enhancements of a floor on risk models can help prevent excessive variability in capital outcomes and allow for meaningful comparison across institutions and countries, while still permitting for risk sensitive approaches to take hold. The capital floor is a linchpin of this system.
The Impact of Macroprudential Tools

The BIS just published an interesting working paper – “The impact of macroprudential housing finance tools in Canada“.

Do policies which seek to regulate serviceability, such as debt to income, or debt servicing ratios, work better than loan to value controls? A highly relevant question given the fact that some central banks are going down the debt to income approach (e.g Bank of England has implement high DTI thresholds) and Reserve Bank NZ is exploring this at the moment).

It seems from their research that income related constraints work well for higher income households, but loan to value methods work better for households with more constrained incomes. So perhaps DTI measures should be targetted at more wealthy households seeking larger loans.

This was a paper produced as part of the BIS Consultative Council for the Americas (CCA) research project on “The impact of macroprudential policies: an empirical analysis using credit registry data” implemented by a Working Group of the CCA Consultative Group of Directors of Financial Stability (CGDFS).

The paper combines loan-level administrative data with household-level survey data to analyze the impact of recent macroprudential policy changes in Canada using a microsimulation model of mortgage demand of first-time homebuyers.

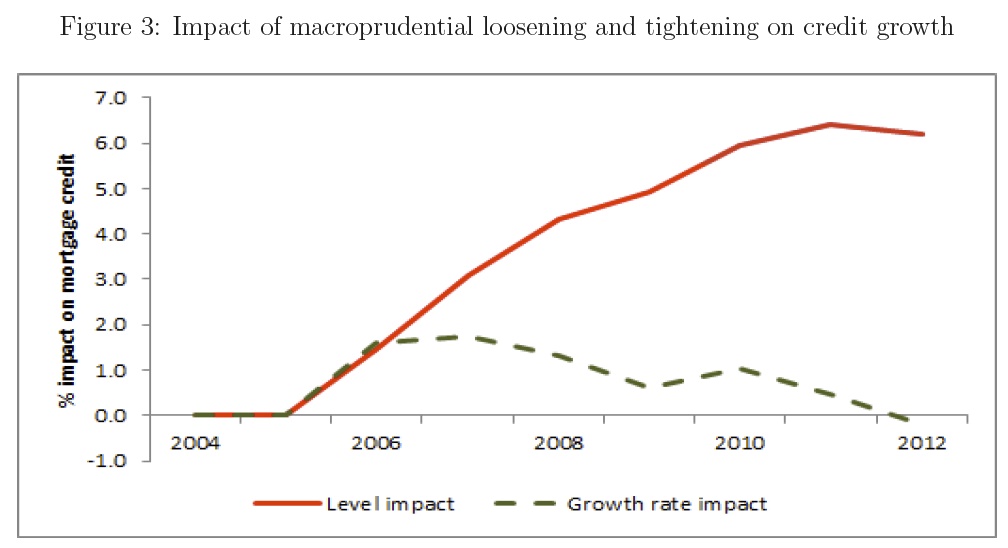
They found that policies targeting the loan-to-value ratio have a larger impact on demand than policies targeting the debt-service ratio, such as amortization. In addition, they show that loan-to-value policies have a larger role to play in reducing default than income-based policies.

The results of the experiments suggest that wealth constraints are more effective than income constraints at affecting mortgage demand, particularly on the extensive margin, for a given proportional change and the given starting points of policy parameters (95% maximum LTV and maximum 25-year amortization for insured mortgages).

Income constraints, however, are just as effective as wealth constraints for high-wealth homebuyers. The focus of the empirical analysis and the model, however, is on mortgage demand, and ignores some aspects of the general market for housing as well as potential supply effects.

From changes in consumer demand, we fnd that LTV constraints, which work through the wealth channel, are effective housing finance tools. Given that the average household is able to meet changes in cash flow, we conclude that, at least with the types of changes we observe to amortization, that changes directed at household repayment constraint are less effective. Households are attracted to these products, however, they are not binding.

An important contribution of this paper is the use of microsimulation modeling to capture the interactions of multiple policy tools and the non-linearities in consumer responses. This model imposes some structure on how we interpret the data while still being highly flexible in capturing nonlinear responses that more traditional, rational forward-looking dynamic stochastic general equilibrium models generally have difficulty capturing. The model allows us to map the impact of a policy change on the percentage of FTHBs who enter the market and their demand for credit. The results of our microsimulation model suggest that the wealth constraint has the largest impact on the number of FTHBs who enter the housing market and amount of debt that they hold. However, the impact of changes in amortization, which affect the income constraint, do affect high-wealth households. Finally, we show that LTV policies seem to reduce the impact of interest rate shocks on household vulnerabilities relative to income-based policies.

A caveat of our results is that we have taken as given that lenders are able to change the supply of credit exogenously in response to changes in macroprudential policy. This appears
reasonable, given that banks do not face default risk in the Canadian (insured) mortgage market. However, if there is a tightening, banks might react strategically to price mortgages
in a way that partially offsets changes in macroprudential policies. More importantly, we do not capture general equilibrium effects. A relaxation of mortgage insurance guidelines leads to entry of FTHBs, which can lead to house price appreciation, which leads to further entry and greater house price appreciation. This can affect both current and future mortgage demand in a way that is not captured in the model.

Note: BIS Working Papers are written by members of the Monetary and Economic Department of the Bank for International Settlements, and from time to time by other economists, and are published by the Bank. The papers are on subjects of topical interest and are technical in character. The views expressed in them are those of their authors and not necessarily the views of the BIS.

Is monetary policy less effective when interest rates are persistently low?

Interesting BIS working paper which says that at low interest rates,  monetary policy transmission becomes less effective.

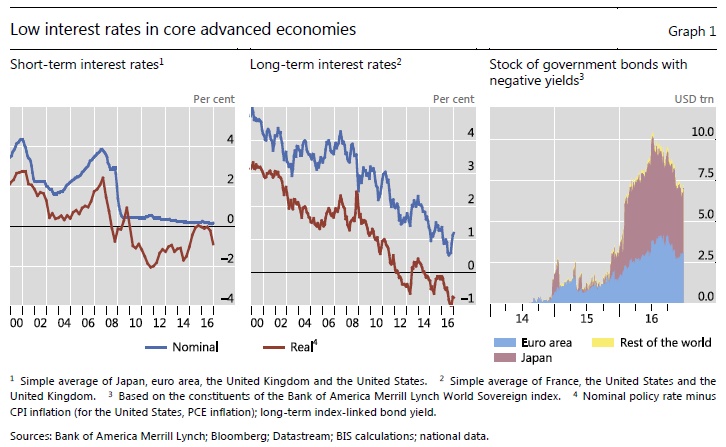
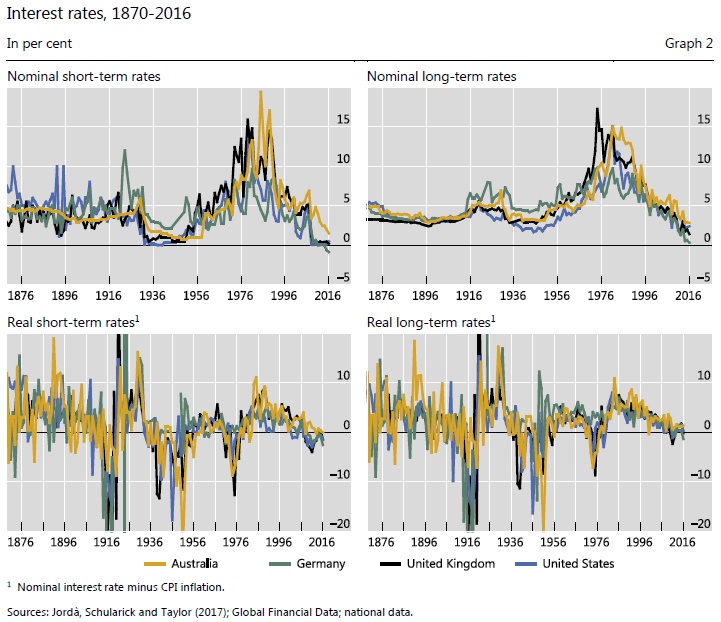
Interest rates in the core advanced economies have been persistently low for about eight years now. Short-term nominal rates have on average remained near zero since early 2009 and have been even negative in the euro area and Japan, respectively, since 2014 and 2016. The drop in short-term nominal rates has gone along with a fall in real (inflation-adjusted) rates to persistently negative levels. Long-term rates have also trended down, albeit more gradually, over this period: in nominal terms, they fell from between 3–4% in 2009 to below 1% in 2016.

From a historical perspective, this persistently low level of short- and long-term nominal rates is unprecedented. Since 1870, nominal interest rates in the core advanced economies have never been so low for so long, not even in the wake of the Great Depression of the 1930s (Graph 2, top panels). Elsewhere, too, including in Australia, short- and long-term interest rates have fallen to new troughs, reflecting in part global interest rate spillovers especially at the long end.

The persistently low rates of the recent past have reflected central banks’ unprecedented monetary easing to cushion the fallout of the Great Financial Crisis (GFC), spur economic recovery and push inflation back up towards objectives. However, despite such efforts, the recovery has been lacklustre. In the core economies, for instance, output has not returned to its pre-recession path, evolving along a lower, if anything flatter, trajectory, as growth has disappointed. At the same time, in many countries inflation has remained persistently below target over the past three years or so.

Against this background, there have been questions about the effectiveness of monetary policy in boosting the economy in a low interest rate environment. This paper assesses this issue by taking stock of the existing literature. Specifically, the focus is on whether the positive effect of lower interest rates on aggregate demand diminishes when policy rates are in the proximity of what used to be called the zero lower bound. Moreover, to keep the paper’s scope manageable, we take as given the first link in the transmission mechanism: from the central bank’s instruments, including the policy rate, to other rates.

The review suggests that both conceptually and empirically there is support for the notion that monetary transmission is less effective when interest rates are persistently low. Reduced effectiveness can arise for two main reasons: (i) headwinds that typically blow in the wake of balance sheet recessions, when interest rates are low (eg debt overhang, an impaired banking system, high uncertainty, resource misallocation); and (ii) inherent nonlinearities linked to the level of interest rates (eg impact of low rates on banks’ profits and credit supply, on consumption and saving behaviour – including through possible adverse confidence effects – and on resource misallocation). Our review of the existing empirical literature suggests that the headwinds experienced during the recovery from balance-sheet recessions can significantly reduce monetary policy effectiveness. There is also evidence that lower rates have a diminishing impact on consumption and the supply of credit. Importantly, these results point to an independent role for nominal rates, regardless of the level of real (inflation-adjusted) rates.

The review reveals that the relevant theoretical and empirical literature is much scanter than one would have hoped for, in particular given that periods of persistently low interest rates have become more frequent and longer-lasting. While there are appealing conceptual arguments suggesting that monetary transmission may be impaired when rates are low, many of these have not been formalised by means of rigorous theoretical modelling. And the extant empirical work is limited, both geographically and in scope. For instance, most studies assessing changes in monetary transmission in low rate environments focus on the United States. Similarly, there is hardly any work assessing specific mechanisms. The field is wide open and deserves further exploration, not least given the first-order policy implications.

Note: BIS Working Papers are written by members of the Monetary and Economic Department of the Bank for International Settlements, and from time to time by other economists, and are published by the Bank. The papers are on subjects of topical interest and are technical in character. The views expressed in them are those of their authors and not necessarily the views of the BIS.

Enhancements to the Basel Pillar 3 Disclosure Framework Released

The Basel Committee on Banking Supervision has issued Pillar 3 disclosure requirements – consolidated and enhanced framework. This standard represents the second phase of the Committee’s review of the Pillar 3 disclosure framework and builds on the revisions to the Pillar 3 disclosure published by the Committee in January 2015.

The Pillar 3 disclosure framework seeks to promote market discipline through regulatory disclosure requirements. The enhancements in the standard contain three main elements:

  • Consolidation of all existing BCBS disclosure requirements into the Pillar 3 framework – These disclosure requirements cover the composition of capital, the leverage ratio, the Liquidity Coverage Ratio (LCR), the Net Stable Funding Ratio (NSFR), the indicators for determining globally systemically important banks (G-SIBs), the countercyclical capital buffer, interest rate risk in the banking book and remuneration.
  • Two enhancements to the Pillar 3 framework – This standard introduces a “dashboard” of a bank’s key prudential metrics which will provide users of Pillar 3 data with an overview of a bank’s prudential position, and a new disclosure requirement for those banks which record prudent valuation adjustments (PVAs) to provide users with a granular breakdown of how a bank’s PVAs are calculated.
  • Revisions and additions to the Pillar 3 standard arising from ongoing reforms to the regulatory policy framework – This standard includes new disclosure requirements in respect of the total loss-absorbing capacity (TLAC) regime for G-SIBs issued in November 2015, and revised disclosure requirements for market risk arising from the revised market risk framework published by the Committee in January 2016.

Note that this standard does not include disclosure requirements arising from the Committee’s ongoing finalisation of the Basel III reforms. Disclosure requirements agreed by the Committee following the issuance of this standard will be included within the scope of the third phase of the review of the Pillar 3 framework.

The standard incorporates feedback from Pillar 3 preparers and users collected during the public consultation conducted in March 2016. Clarifications have been made relating to the disclosure requirements, in particular those pertaining to TLAC.

The implementation date for each of the disclosure requirements is set out in the standard. In general, the implementation date for existing disclosure requirements consolidated under the standard will be end-2017. For disclosure requirements which are new and/or depend on the implementation of another policy framework, the implementation date has been aligned with the implementation date of that framework

Debt Servicing Ratio Update Highlights Risks

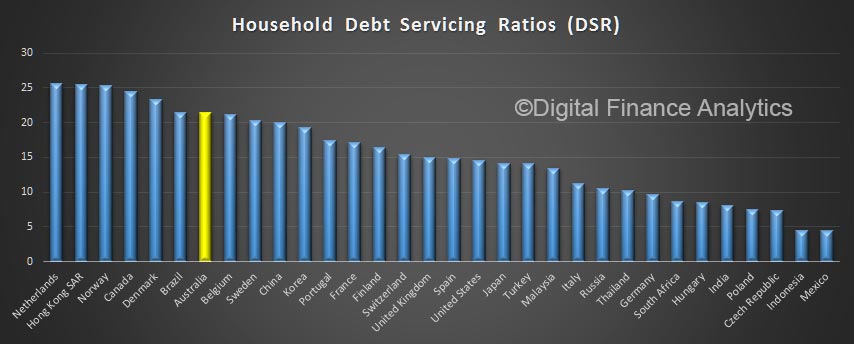
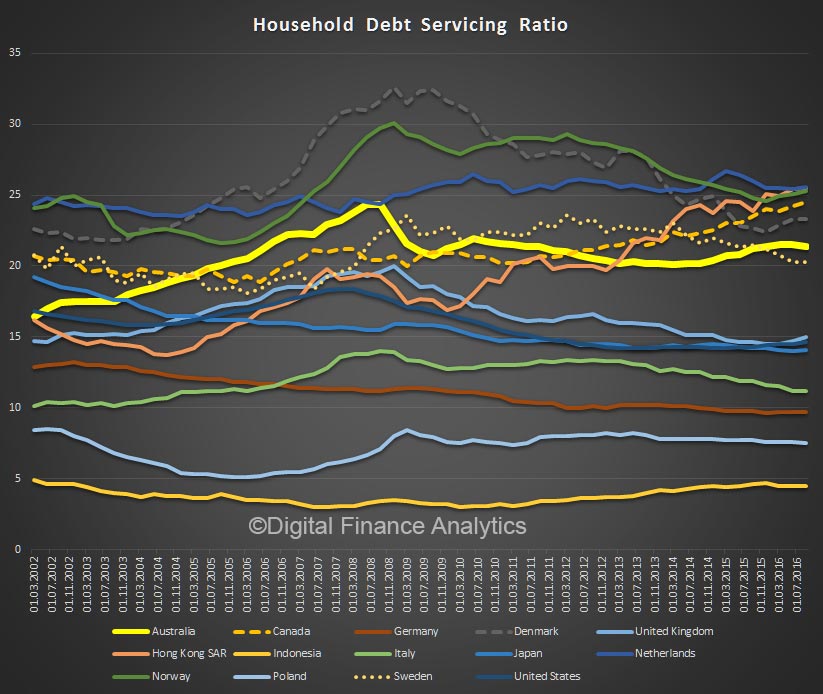
The BIS has released the latest DSR data for major economies. Australia sits firmly near the top, alongside Norway, Netherlands, Canada and Hong Kong. USA and UK are significantly lower.

The DSR reflects the share of income used to service debt and has been found to provide important information about financial-real interactions. For one, the DSR is a reliable early warning indicator for systemic banking crises. Furthermore, a high DSR has a strong negative impact on consumption and investment. The DSRs are constructed based primarily on data from the national accounts. You can read more about the index here.

Here are comparative charts to September 2016.

The trends over time are also interesting, as interest rates and debt levels change. I have removed a few countries to make the chart easier to read.

The BIS says:

Debt forms a central part of the narrative of financial crises and financial cycles more generally. Leverage, often proxied at the aggregate level by the ratio of the stock of liabilities (ie debt) to income, has received much attention as an indicator of financial excesses and vulnerabilities. Less discussed, but equally important, is the debt service ratio (DSR), which captures the share of income used for interest payments and amortisations. These debt-related flows are a direct result of previous borrowing decisions and often move slowly as they depend on the duration and other terms of credit contracts. They have a direct impact on borrowers’ budget constraints and thus affect spending.

Since the DSR captures the link between debt-related payments and spending, it is a crucial variable for understanding the interactions between debt and the real economy. For instance, during financial booms, increases in asset prices boost the value of collateral, making borrowing easier. But more debt means higher debt service ratios, especially if interest rates rise. This constrains spending, which offsets the boost from new lending, and the boom runs out of steam at some point. After a financial bust, it takes time for debt service ratios, and thus spending, to normalise even if interest rates fall, as principal still needs to be paid down. In fact, the evolution of debt service burdens can explain the dynamics of US spending in the aftermath of the Great Financial Crisis fairly well. In addition, DSRs are also highly reliable early warning indicators of systemic banking crises.

Latest Basel III monitoring results

The Basel Committee has published the results of its latest Basel III monitoring exercise based on data as of 30 June 2016 in a 65 page report. Virtually all participating banks meet Basel III minimum and target CET1 capital requirements as agreed up to end-2015. The report does not reflect any standards agreed since the beginning of 2016, such as the revisions to the market risk framework.

It also highlights that the capital build processes will continue as the higher targets come into force. Higher capital costs, and this will translate into higher loan rates as banks seek to preserve shareholder returns.

The report provides summary data for a total of 210 banks, comprising 100 large internationally active banks. These “Group 1 banks” are defined as internationally active banks that have Tier 1 capital of more than €3 billion, and include all 30 banks that have been designated as global systemically important banks (G-SIBs). The Basel Committee’s sample also includes 110 “Group 2 banks” (ie banks that have Tier 1 capital of less than €3 billion or are not internationally active). It includes Australia’s “big four” banks and one other using data from APRA.

On a fully phased-in basis, data as of 30 June 2016 show that virtually all participating banks meet both the Basel III risk-based capital minimum Common Equity Tier 1 (CET1) requirement of 4.5% and the target level CET1 requirement of 7.0% (plus the surcharges on G-SIBs, as applicable).

Between 31 December 2015 and 30 June 2016, Group 1 banks continued to reduce their capital shortfalls relative to the higher Tier 1 and total capital target levels; in particular, the Tier 2 capital shortfall has decreased from €5.5 billion to €3.4 billion. As a point of reference, the sum of after-tax profits prior to distributions across the same sample of Group 1 banks for the six-month period ending 30 June 2016 was €263 billion. In addition, applying the 2022 minimum requirements for Total Loss-Absorbing Capacity (TLAC), 18 of the G-SIBs in the sample have a combined incremental TLAC shortfall of €318 billion as at the end of June 2016, compared with €416 billion at the end of 2015.

The monitoring reports also collect bank data on Basel III’s liquidity requirements. Basel III’s Liquidity Coverage Ratio (LCR) was set at 60% in 2015, increased to 70% in 2016 and will continue to rise in equal annual steps to reach 100% in 2019. The weighted average LCR for the Group 1 bank sample was 126% on 30 June 2016, slightly up from 125% six months earlier. For Group 2 banks, the weighted average LCR was 155%, up from 148% six months earlier. Of the banks in the LCR sample, 88% of the Group 1 banks and 94% of the Group 2 banks reported an LCR that met or exceeded 100%, while all Group 1 and Group 2 banks reported an LCR at or above the 70% minimum requirement that was in place for 2016.
Basel III also includes a longer-term structural liquidity standard – the Net Stable Funding Ratio (NSFR). The weighted average NSFR for the Group 1 bank sample was 114%, while for Group 2 banks the average NSFR was 115%. As of June 2016, 84% of the Group 1 banks and 86% of the Group 2 banks in the NSFR sample reported a ratio that met or exceeded 100%, while 98% of the Group 1 banks and 96% of the Group 2 banks reported an NSFR at or above 90%.

The results of the monitoring exercise assume that the positions as of 30 June 2016 were subject to the fully phased-in Basel III standards as agreed up to end-2015. That is, they do not take account of the transitional arrangements set out in the Basel III framework, such as the gradual phase-in of deductions from regulatory capital. Furthermore, the report does not reflect any standards agreed since the beginning of 2016, such as the revisions to the market risk framework (analysed separately in a special feature). No assumptions were made about bank profitability or behavioural responses, such as changes in bank capital or balance sheet composition. For that reason, the results of the study may not be comparable with industry estimates.