BIS issues revised securitisation framework

The Basel Committee on Banking Supervision today published an updated standard for the regulatory capital treatment of securitisation exposures. By including the regulatory capital treatment for “simple, transparent and comparable” (STC) securitisations, this standard amends the Committee’s 2014 capital standards for securitisations. This securitisation framework, which will come into effect in January 2018, forms part of the Committee’s broader Basel III agenda to reform regulatory standards for banks in response to the global financial crisis and thus contributes to a more resilient banking sector.

The crisis highlighted several weaknesses in the Basel II securitisation framework, including concerns that it could generate insufficient capital for certain exposures. This led the Committee to decide that the securitisation framework needed to be reviewed. The Committee identified a number of shortcomings
relating to the calibration of risk weights and a lack of incentives for good risk management.

(i) Mechanistic reliance on external ratings;
(ii) Excessively low risk weights for highly-rated securitisation exposures;
(iii) Excessively high risk weights for low-rated senior securitisation exposures;
(iv) Cliff effects; and
(v) Insufficient risk sensitivity of the framework.

The above shortcomings translate into specific objectives that the revisions to the framework seek to achieve: reduce mechanistic reliance on external ratings; increase risk weights for highly-rated securitisation exposures; reduce risk weights for low-rated senior securitisation exposures; reduce cliff effects; and enhance the risk sensitivity of the framework.

In July 2016 the Basel Committee on Banking Supervision published an updated standard for the regulatory capital treatment of securitisation exposures that includes the regulatory capital treatment for “simple, transparent and comparable” (STC) securitisations. This standard amends the Committee’s 2014 capital standards for securitisations.

The capital treatment for STC securitisations builds on the 2015 STC criteria published by the Basel Committee and the International Organization of Securities Commissions. The standard published today sets out additional criteria for differentiating the capital treatment of STC securitisations from that of other securitisation transactions. The additional criteria, for example, exclude transactions in which the standardised risk weights for the underlying assets exceed certain levels. This ensures that securitisations with higher-risk underlying exposures do not qualify for the same capital treatment as STC-compliant transactions.

The Committee has revised the hierarchy as part of the Basel III securitisation framework, to reduce the reliance on external ratings as well as to simplify it and limit the number of approaches.Sec-Framework
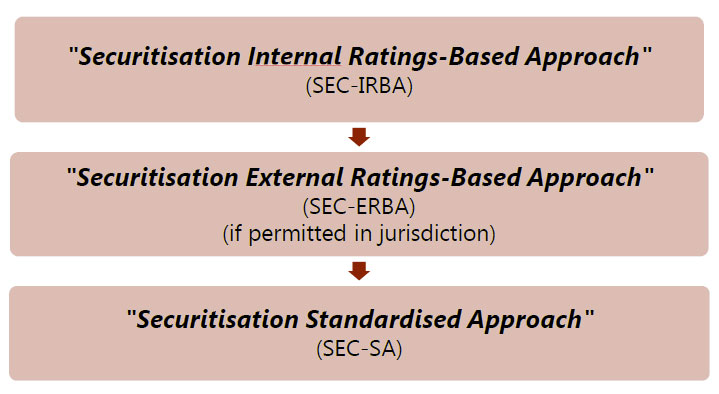
The SEC-IRBA is at the top of the revised hierarchy. The underlying model is the Simplified Supervisory Formula Approach (SSFA) and it uses KIRB information as a key input. KIRB is the capital charge for the underlying exposures using the IRB framework (either the advanced or foundation approaches). In order to use the SEC-IRBA, the bank should have the same information as under the Basel II SFA: (i) a supervisory-approved IRB model for the type of underlying exposures in the securitisation pool; and (ii) sufficient information to estimate KIRB.

A bank that cannot calculate KIRB for a given securitisation exposure would have to use the SECERBA, provided that this method is implemented by the national regulator. A bank that cannot use the SEC-IRBA or the SEC-ERBA (either because the tranche is unrated or because its jurisdiction does not permit the use of ratings for regulatory purposes) would use the SEC-SA, with a generally more conservative calibration and using KSA as input. KSA is the capital charge for the underlying exposures using the Standardised Approach for credit risk. A slightly modified (and more conservative) version of the SEC-SA would be the only approach available for resecuritisation exposures. In general, a bank that cannot use SEC-IRBA, SEC-ERBA, or SEC-SA for a given securitisation exposure would assign the exposure a risk weight of 1,250%.

The revised Basel III securitisation framework represents a significant improvement to the Basel II framework in terms of reducing complexity of the hierarchy and the number of approaches. Under the revisions there would be only three primary approaches, as opposed to the multiple approaches and exceptional treatments allowed in the Basel II framework.

Further, the application of the hierarchy no longer depends on the role that the bank plays in the securitisation – investor or originator; or on the credit risk approach that the bank applies to the type of underlying exposures. Rather, the revised hierarchy of approaches relies on the information that is available to the bank and on the type of analysis and estimations that it can perform on a specific transaction.

The mechanistic reliance on external ratings has been reduced; not only because the RBA is no longer at the top of the hierarchy, but also because other relevant risk drivers have been incorporated into the SEC-ERBA (ie maturity and tranche thickness for non-senior exposures).

In terms of risk sensitivity and prudence, the revised framework also represents a step forward relative to the Basel II framework. The capital requirements have been significantly increased, commensurate with the risk of securitisation exposures. Still, capital requirements of senior securitisation exposures backed by good quality pools will be subject to risk weights as low as 15%. Moreover, the presence of caps to risk weights of senior tranches and limitations on maximum capital requirements aim to promote consistency with the underlying IRB framework and not to disincentivise securitisations of low credit risk exposures.

Compliance with the expanded set of STC criteria should provide additional confidence in the performance of the transactions, and thereby warrants a modest reduction in minimum capital requirements for STC securitisations. The Committee consulted in November 2015 on a proposed treatment of STC securitisations. Compared to the consultative version, the final standard has scaled down the risk weights for STC securitisation exposures, and has reduced the risk weight floor for senior exposures from 15% to 10%.

The Committee is currently reviewing similar issues related to short-term STC securitisations. It expects to consult on criteria and the regulatory capital treatment of such exposures around year-end.

UK Lowers Banks’ Capital Buffer, a Credit Negative – Moody’s

Moody’s says that last Tuesday, the Bank of England’s (BoE) Financial Policy Committee (FPC) reduced the countercyclical capital buffer (CCyB) applied to banks’ UK risk-weighted assets to 0.0% from 0.5% as a result of expected softening in the UK economy following the UK referendum to exit the EU (Brexit). The reduced CCyB gives banks greater flexibility in providing credit to households and businesses, but reduces banks’ requirements to hold loss-absorbing capital, which is credit negative.

The 0.5% reduction of the regulatory capital buffers for UK banks in aggregate equates to £5.7 billion of capital. Given the BoE’s estimate of bank sector aggregate leverage of 4%, this allows for an increase in banks’ lending capacity of £150 billion. Such measures reduce the likelihood of a credit crunch and allow the UK’s financial system to absorb shock rather than amplify the negative effects on growth and investment from the uncertainty following the Brexit Referendum.

In 2015, net lending to the UK banking sector increased by around £60 billion, a small proportion of the additional lending capacity created by this reduction in capital requirements. Increasing the UK banks’ lending capacity will likely support their profitability, which we expect to be pressured by the low-rate environment, likely fall in demand for credit and an increase in credit impairments from the uncertainty around the UK’s vote to leave the EU.

Although the PRA and the FPC deem that the banks will still hold sufficient idiosyncratic and systemic risk capital to withstand a severe but plausible stress, these reductions in capital buffers will, if used to support lending, increase banks’ vulnerability to unexpected idiosyncratic and macroeconomic shocks. The effect will vary across UK banks, with leverage-constrained institutions less affected than those that are relatively more capital constrained. At 30 March 2016, the aggregate common equity Tier 1 ratio of the UK’s seven largest banks stood at 12.3%.

In March 2016, the FPC raised the CCyB to 0.5% effective March 2017 from 0.0%, with a 1% target for later in 2017, for the UK’s six largest banks1 in response to domestic credit risks, mainly related to an overheating housing market. Concurrently, to ensure there was no duplication in capital requirements, the FPC recommended reducing Prudential Regulation Authority (PRA) supervisory buffers (Pillar 2B) by 0.5%, offsetting the initial introduction of the CCyB. Despite this reversal in the decision to raise the CCyB, the BoE recommended to retain and bring forward the reduction in banks’ PRA buffer, to the extent the level of individual bank buffers is driven by macroeconomic versus idiosyncratic risk factors, thereby increasing available capital to support lending to businesses and households.

The CCyB is a macro prudential tool whereby the FPC adjusts bank capital requirements on a systemwide basis with the aim of dampening procyclicality of bank lending to the UK economy. This is intended to reduce the negative effects of boom and bust economic cycles, which are costly for banks and the wider
economy.

Although the CCyB may help avoid a credit crunch, amid a period of prolonged uncertainty around the UK’s future trade relationship with the EU, demand for credit is likely to be subdued, raising questions about the policy’s effectiveness on the real economy.

UK Regulators Worry About 17% Housing Investment Loans

The latest Financial Stability report released by the Bank of England provides insights into the UK mortgage market, and some of the concerns the regulators are addressing. Of note is the information on “Buy-to-Let” loans, or Investment Mortgage Loans. Most striking is the strong concerns expressed about the rise to 17% of all loans being for this purpose. In Australia, by comparison, 35% of housing loans are for investment purposes. We also look at household debt ratios and countercyclical buffers.

Buy-to-let mortgage lending has driven mortgage lending growth in recent years.  Seventeen per cent of the stock of total secured lending is now accounted for by buy-to-let mortgages, and the gross flow of buy-to-let lending in 2015 was close to its pre-crisis peak.

The PRA conducted a review of underwriting standards in the buy-to-let mortgage market between November 2015 and March 2016. It reviewed the lending plans of the top 31 lenders in the industry, who account for over 90% of total buy-to-let lending. A number of lenders planned to increase their gross buy-to-let lending significantly, with overall planned lending in the region of £50 billion.

UK-BuytoLetGiven competition in the sector, this strong growth profile raises the risk that firms could relax their underwriting standards in order to achieve their plans. The review further highlighted that some lenders were already applying underwriting standards that were somewhat weaker than those prevailing in the market as a whole.

The draft Supervisory Statement aims: to ensure that buy-to-let lenders adhere to a set of minimum expectations around underwriting standards; and, to prevent a marked loosening in underwriting standards. It also clarifies the regulatory capital treatment of certain buy-to-let exposures.

At its March meeting, the FPC welcomed and supported the draft Supervisory Statement. The Supervisory Statement reflects microprudential objectives, aiming to reduce the risk that buy-to-let lenders make losses that can threaten their safety and soundness. From a macroprudential perspective, policies that prevent a slippage in buy-to-let underwriting standards should also reduce the threat of buy-to-let lending amplifying wider housing market risks. The FPC discussed that, although the 200 basis points increase in buy-to-let mortgage rates was lower than the interest rate stress applied to owner-occupied lending under the FPC’s June 2014 Recommendation, lenders tended to assess affordability for buy-to-let mortgages using interest cover ratios of at least 125%. In addition, loan-to-value ratios at origination in excess of 75% were less common in buy-to-let mortgages than in owner-occupied mortgages. Buy-to-let loans therefore typically started with a larger equity cushion for lenders, which reduced the associated credit risk in the first few years of the loan given that these loans were typically non-amortising. The FPC considered that no action beyond this was warranted for macroprudential purposes at that time. It will continue to monitor developments and potential threats to financial stability from the buy-to-let mortgage market closely, and stands ready to take action.

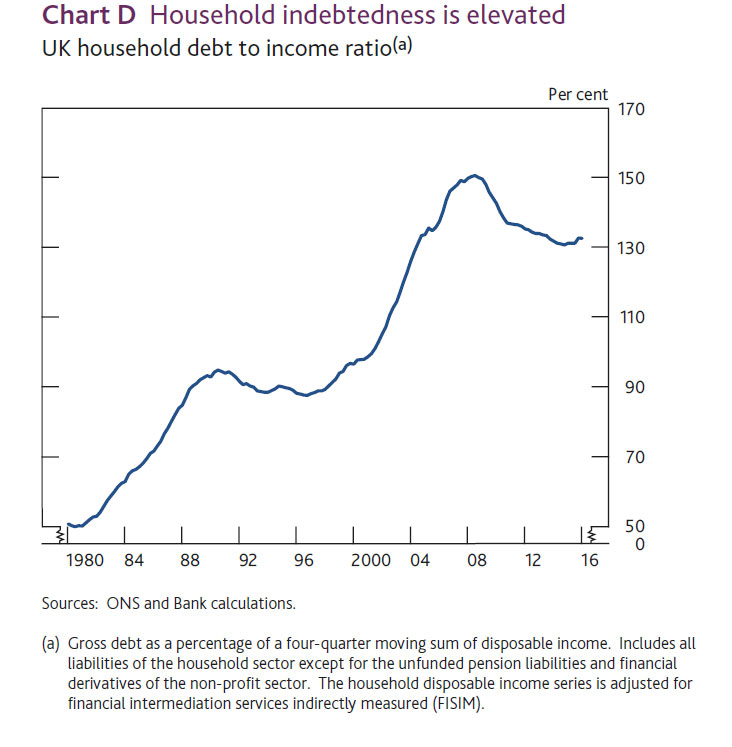
Another piece of data in the report is the household indebtedness. Worth comparing this with the RBA chart we highlighted yesterday, where the ratio in Australia is north of 175%.

UK-DebtMore broadly, The Stability Report highlighted the risks to the UK economy, especially around Brexit. The webcast is worth listening to.

Of note is that fact that the regulators reduced the UK countercyclical capital buffer rate from 0.5% to 0% of banks’ UK exposures
with immediate effect, reflecting heightened risk and the wish to encourage banks to lend.  Australia already has a zero percent buffer.

The FPC is reducing the UK countercyclical capital buffer rate from 0.5% to 0% of banks’ UK exposures with immediate effect. Absent any material change in the outlook, and given the need to give banks the clarity necessary to facilitate their capital planning, the FPC expects to maintain a 0% UK countercyclical capital buffer rate until at least June 2017. This action reinforces the FPC’s view that all elements of the substantial capital and liquidity buffers that have been built up by banks are able to be drawn on, as necessary, to allow them to cushion shocks and maintain the provision of financial services to the real economy, including the supply of credit and support for market functioning.

It will reduce regulatory capital buffers by £5.7 billion. For a banking sector that, in aggregate, targets a leverage ratio of 4%, this raises their capacity for lending to UK households and businesses by up to £150 billion.

In March, the FPC had begun to supplement regulatory capital buffers with the UK countercyclical capital buffer. This reflected its assessment that the risks the system could face were growing and additional capital was needed that could be released quickly in the event of an adverse shock.

At that time, the FPC judged that risks associated with domestic credit were no longer subdued, as they had been in the period following the financial crisis, and global risks were heightened. The Committee raised the UK countercyclical capital buffer rate to 0.5% and signalled its expectation that it would increase it further, to 1%, if the risk level remained unchanged. As set out in this Report, a number of economic and financial risks are materialising. The FPC strongly expects that banks will continue to support the real economy, by drawing on buffers as necessary.

Consistent with the FPC’s leverage ratio framework, the countercyclical leverage ratio buffer rate will also fall.

The Committee’s decision in March to raise the UK countercyclical capital buffer rate to 0.5% was due to take effect formally from 29 March 2017. However, as the Committee explained in March, there is an overlap between the risks captured by existing PRA supervisory capital buffers and a positive UK countercyclical capital buffer rate of 0.5%. The PRA Board concluded in March 2016 that, to ensure there is no duplication in capital required to cover the same risks, existing PRA supervisory buffers of PRA-regulated firms should be reduced, as far as possible, to reflect a UK countercyclical capital buffer rate of 0.5%, when such a rate came into effect.

The FPC has therefore accompanied its decision to reduce the UK countercyclical capital buffer rate with a Recommendation to the PRA that it bring forward this planned reduction in PRA supervisory capital buffers.

Recommendation: The FPC recommends to the PRA that, where existing PRA supervisory buffers of PRA-regulated firms reflect risks that would be captured by a UK countercyclical capital buffer rate, it reduce those buffers, as far as possible and as soon as practicable, by an amount of capital which is equivalent to the effect of a UK countercyclical capital buffer rate of 0.5%.

The PRA Board has agreed to implement this Recommendation. This means that three quarters of banks, accounting for 90% of the stock of UK economy lending, will, with immediate effect, have greater flexibility to maintain their supply of credit to the real economy. Other banks will no longer see their regulatory capital buffers increase over the next nine months, increasing their capacity to lend to UK households and businesses too.

Consistent with this, the FPC supports the expectation of the PRA Board that firms do not increase dividends and other distributions as a result of this action.

International capital comparison update – APRA

APRA has issued an update on Australian Bank capital ratios. They show that banks in Australia have lifted their capital base in the past year, (e.g. CET1 from 11.7% to 13.5% on an international comparison basis  at December 2015), but APRA also underscores the fact that even higher capital ratios will be required to meet tighter rules, and to ensure that local banks do not slip down the international ranking, so as to maintain their ratios as “unquestionably strong”. This is because regulators are driving ratios higher in many countries.

Higher capital costs of course, and in in the normal course of business, will lead to more expensive loans and lower returns to shareholders. We think dividends will be under pressure in the next couple of years.

It is also worth saying that APRA is disclosing aggregate data, so variations across individual banks will be masked. This makes an interesting comparison to data from the FED where the results of capital stress tests are reported at an institution level. We think APRA should report capital ratios by individual institution, but of course they won’t.

In July 2015, APRA published the Information Paper International capital comparison study (2015 study) as an important first step in addressing the Financial System Inquiry (FSI) recommendation to set capital standards such that Australian authorised deposit-taking institution (ADI) capital ratios are ‘unquestionably strong’.

In its final report, the FSI suggested that for banks to be regarded as unquestionably strong they should have capital ratios that position them in the top quartile of internationally-active banks. APRA’s 2015 study, which adjusted for differences in measurement methodology across jurisdictions and uses a number of different measures of capital strength, found that the Australian major banks were well-capitalised, but not in the top quartile of international peers.

In particular, APRA’s 2015 study found that, based on the major banks’ capital adequacy ratios at 30 June 2014, a 70 basis point (bp) increase in capital ratios would be required to position the major banks’ Common Equity Tier 1 (CET1) ratio at the international 75th percentile (i.e. the bottom of the top quartile) and that they would likely need to increase their capital adequacy ratios by a larger amount to be comfortably positioned in the top quartile over the medium to long term.

The Basel Committee on Banking Supervision (Basel Committee) recently published an updated quantitative impact study (QIS)1 including the capital ratios of internationally active banks as of 30 June 2015. Based on the same methodology used in APRA’s 2015 study and using the latest Basel QIS, APRA has recently reviewed the major banks’ relative position to their international peers. To incorporate the capital raisings undertaken by the major banks, particularly during the second half of 2015, this update is based on their capital ratios as at December 2015.

As detailed in APRA’s 2015 study, the major banks’ weighted average comparison CET1 ratio was estimated as 11.7 per cent as at June 2014. Chart 1 shows that by December 2015, this ratio had increased by 180 bps to 13.5 per cent. This increase was the result of a range of factors, but the largest single driver was the substantial capital raisings by the major banks in the latter part of 2015. The differential between the CET1 ratio under APRA’s requirements and the international comparison ratio also increased: in broad terms, the differential as at December 2015 was 350 basis points.

On a relative basis, the strengthening of the major banks’ CET1 ratios placed them, on average, at approximately 40 bps above the June 2015 Basel QIS 75th percentile of 13.1 per cent for Group 1 banks.2 The improvement in the relative position of the major banks in Chart 1 is likely to be somewhat overstated by the timing differences between the international (June 2015) and Australian (December 2015) data. On average, the 75th percentile CET1 ratio in the Basel QIS has tended to increase by approximately 25-35 basis points each half year, suggesting the 75th percentile would be somewhat higher had December 2015 QIS data been available to APRA. Nevertheless, notwithstanding this timing difference, the relative positioning of the Australian major banks’ CET1 ratios now seems broadly in line with the benchmark suggested by the FSI.

Chart 1: CET1 ratios of Basel QIS and major banks3

Bar graph showing CET1 ratios of major banks compared to the distribution of Basel QIS banks. The 2015 study bar shows the CET1 ratios of Australia (headline) at 8.6%, Australia (Basel QIS) at 9.6% and Australia (comparison ratio) at 11.7%. The 2016 update bar shows the CET1 ratios of Australia (headline) at 10.0%, Australia (Basel QIS) at 11.1% and Australia (comparison ratio) at 13.5%.Source: APRA data

Furthermore, since the 2015 study the relative position of the major banks’ other weighted average comparison capital ratios have improved compared to the distribution of Basel QIS Group 1 banks.4 As shown in Chart 2, the major banks’:

  • comparison Tier 1 ratio of 14.8 per cent is positioned in the top quartile as compared to the third quartile as at June 2014; and
  • comparison Total capital ratio of 16 per cent is positioned at the bottom of the top quartile as compared to the median of the distribution as at June 2014.

The relative position of the major banks’ Tier 1 Leverage ratio of 5.4 per cent has also increased to a level above the median (but still below the top quartile) of the distribution of Basel QIS Group 1 banks. This compares to the banks’ position below the median in the 2015 study.

Chart 2: Capital adequacy ratios of Basel QIS (June 2015) and major banks (Dec 2015)

Bar graph showing capital ratios of major banks compared to the distribution of Basel QIS banks. Total capital of Australia (headline) is 13.8%, Australia (Basel QIS) 13.1% and Australia (comparison ratio) 16.0%.Source: APRA data

As noted above the major banks have undertaken significant capital raisings since the 2015 study, which has significantly improved their capital adequacy positon relative to international peers. That said, the trend of international peer banks strengthening their capital ratios continues. Forthcoming international policy developments will also likely mean that Australian banks need to continue to improve their capital ratios in order to at least maintain, if not improve, their relative positioning. The final design and calibration of these reforms will not be decided until around the end of 2016, and it would be prudent for Australian ADIs to continue to plan for the likelihood of strengthened capital requirements in some areas.

As detailed in the 2015 study, APRA’s analysis on the relative positioning of major bank capital ratios is intended to inform, but not determine, its approach for setting capital adequacy requirements. Recent regulatory actions (such as that applying to mortgage risk weights announced in July 2015), and the resulting improvement in the major banks’ international capital comparison, provide the necessary time for APRA to consider the full range of factors that are relevant to satisfy the FSI’s unquestionably strong recommendation. Critically this includes assessing the impact of the Basel Committee reforms as they are finalised and considering how other measures of resilience, such as liquidity, funding, asset quality, and recovery and resolution planning can assist in achieving the FSI’s objective.

APRA intends to provide further insight to these broader considerations once the Basel Committee has completed its deliberations on the international framework around the end of 2016.

1 Basel Committee, Basel III monitoring report, March 2016.

2 Basel QIS Group 1 banks comprises approximately 100 internationally active banks with Tier 1 capital of more than 3 billion Euros.

3 In Charts 1 and 2 the Australia (headline) ratios are determined under APRA’s prudential framework. The Australia (Basel QIS) ratios are derived from the Basel QIS which requires banks to report their regulatory capital base in an internationally-consistent manner. The Australia (comparison ratio) ratios are calculated using the methodology set out in the 2015 study.

4 Consistent with the 2015 study the reported Basel QIS and comparison Tier 1 and comparison Total capital adequacy ratios have not been adjusted for the impact of transitional legacy capital as this issue affects banks in most jurisdictions. The major banks’ headline Total capital ratio is higher than their Basel QIS Total capital ratio as APRA’s framework allows for phasing out of legacy capital instruments

UK Regulators Finalise SRB Regulations; Shows Low Australian Bank Capital Ratios

The UK’s Financial Policy Committee (FPC) has released the final version of its Systemic Risk Buffer (SRB) framework for banks relating to Domestically  Significantly Important Banks) (D-SIB). It also shows Australian Banks relatively weaker capital position.

The framework highlights again that further risk capital will need to be held so that financial firms will be able to absorb losses while continuing to provide critical financial services. In the UK, depending on the size of the institutions, the buffer will be set between 0 and 3%. The SRB increases the capacity of UK systemic banks to absorb stress, thereby increasing their resilience relative to the system as a whole. The FPC judges that the appropriate Tier 1 capital requirement for the banking system is around 13.5% of Risk Weighted Assets.

Note, separately, an additional capital weight, per the Basel framework will apply for global systemically important banks (G‐SIBs).

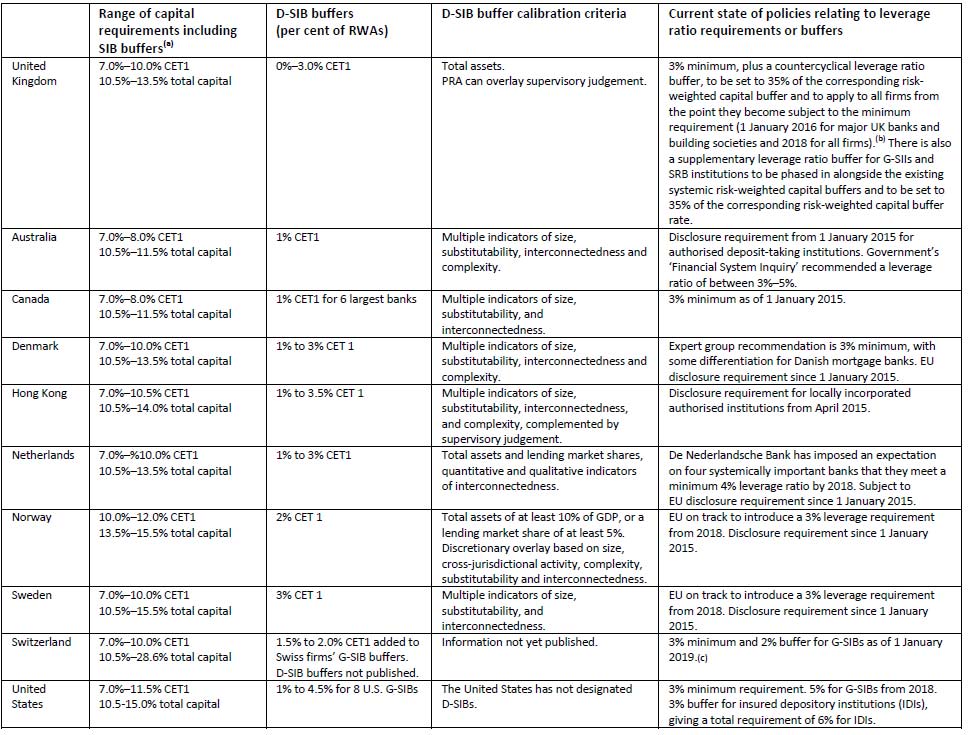
Of special interest to Australian Banks is this table which shows that on a comparable basis, local banks here currently are required to hold less capital than peers in many other countries. Is the D-SIB here at 1% correctly calibrated? – especially, given 63% of all bank lending is residential property related?

UK-DSIB

The UK document just released, sets out the framework for the SRB that will be applied by the PRA to ring‐fenced banks, and large building societies that hold more than £25 billion in deposits and shares (excluding deferred shares), jointly, ‘SRB institutions’. The aim of the SRB is to raise the capacity of ring‐fenced banks and large building societies to withstand stress, thereby increasing their resilience. This reflects the additional damage that these firms could cause to the economy if they were close to failure. The FPC intends that the size of a firm’s buffer should reflect the relative costs to the economy if the firm were to fall into distress. The PRA will apply the framework from 1 January 2019 and later this year will consult on elements relating to the implementation of the SRB.

Overall, based on an analysis of the economic costs and benefits of going concern bank equity, the FPC judged the appropriate non‐time‐varying Tier 1 capital requirement for the banking system, in aggregate, should be 11% of RWAs, assuming those RWAs are properly measured. As up to 1.5 percentage points of this can be met with additional Tier 1 contingent capital instruments, the appropriate level of common equity Tier 1 capital is around 9.5% of RWAs. This judgement was made on the expectation that some of the deficiencies in the measurement of risk weights would be corrected over time. Until remedies are put into place to address this, the appropriate level of capital is correspondingly higher. On current measures of risk weighting, the FPC judges that the appropriate Tier 1 capital requirement for the banking system is around 13.5% of RWAs. This assessment refers to the structural equity requirements applied to the aggregate system that do not vary through time. In addition to baseline capital requirements, the FPC intends to make active use of the countercyclical capital buffer that will apply to banks’ UK exposures.

Under the SRB Regulations, the FPC is required to produce a framework for the SRB at rates between 0 and 3% of risk‐weighted assets (RWAs) and to review that framework at least every two years. The legislation implements the recommendation made in 2011 that ring‐fenced banks and large building societies should hold additional capital due to their relative importance to the UK economy. The FPC has considered its equality duty, and has set out its assessment of the costs and benefits of the framework.

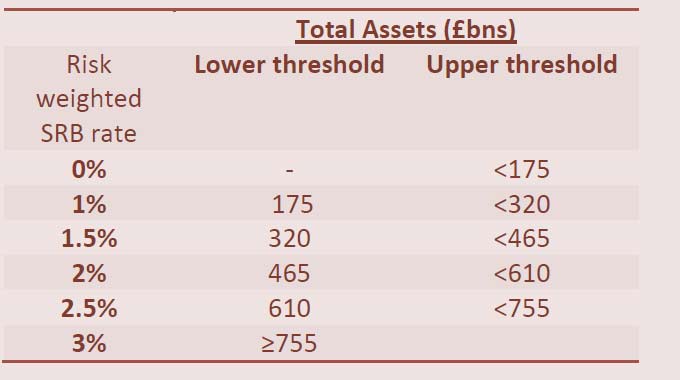
Systemic importance is measured and scored using the total assets of ring‐fenced bank sub‐groups and building societies in scope of the SRB, with higher SRB rates applicable as total assets increase through defined buckets.

SRB-UKThose with total assets of less than £175bn are subject to a 0% SRB. The FPC expects the largest SRB institutions, based on current plans, to have a 2.5% SRB initially. Thresholds for the amounts of total assets corresponding to different SRB rates could be adjusted in the future (for example, in line with nominal GDP or inflation) as part of the FPC’s mandated two‐year reviews of the framework.

In July 2015, the FPC issued a Direction and a Recommendation to the PRA to implement the leverage ratio framework for UK G‐SIBs and other major UK banks and building societies on a consolidated basis. The FPC anticipates that the leverage ratio framework will be applied to UK G‐SIBs and other major UK banks and building societies at the level of the ring‐fenced bank sub‐group from 2019 (where applicable), as well as on a consolidated basis.


Australian Major Bank Credit Metrics Under Pressure – Moody’s

From Business Insider.

Australia’s asset cycle has peaked, according to credit rating agency Moody’s Investor Services. And that means the risk weight capital our major banks hold will come under pressure.

The agency also says that the looming increase in risk weightings on the average mortgage risk weights as a result of the Australian banking regulator’s, APRA, edict that “risk weights for IRB banks will rise to at least 25%, from the current 15-18% level” will also put downward pressure on the majors CET1 (Common Equity Tier One) ratio’s.

The good news for the banks, their shareholders, and the Australian financial system is that Moody’s believes, based on its scenario and sensitivity analysis, that “the potential decline in the banks’ capital metrics as a result of changes to risk weights will be limited”.

Ilya Serov, Moody’s senior vice president, added in the report that:

Even in a highly stressed scenario, and before factoring in any potential for organic capital generation, the major banks’ CET1 ratios will remain above 8.0%, a level which is the combination of the regulatory minimum CET1 plus Capital Conservation and Domestic Systemically Important Bank (D-SIB) buffers.

That doesn’t guarantee the banks won’t have to raise more capital at some point. But it certainly suggests the work they have already done in raising capital in preparation for the changes in regulation will keep them above the 8% trigger level.

Under each of the scenarios Moody’s ran a comparison of the impact of the upper end of Australian banks 2009 experience when the corporate “impaired and past due exposure ratio” hit 2.5%. In the second scenario Moody’s took the average of the banks 2009 experience – as opposed to upper-end of experience as it’s base input. It then included the increase in mortgage weights into this scenario.

Moody’s says: “The key cyclical pressure on risk-weighted capital ratios will come from an upward revision in credit risk weights as asset quality weakens. This is a reversal of the situation which has existed since the GFC’s nadir in 2008/09 which with the ‘decline in the major banks’ CRWA, as asset quality improved after the global financial crisis, has been the primary organic driver of their improving risk-weighted capital ratios.”

While Moody’s stressed this was not a credit rating note in the end though the company still sounds pretty upbeat on the big banks capital positions.

“The moderate degree of deterioration in capital levels indicated by our sensitivity analysis is in line with our view that Australia’s major banks remain in a strong position to maintain their strong credit profiles against a likely weakening in their asset performance” Moody’s said.

How Does Bank Capital Affect the Supply of Mortgages?

The Bank for International Settlements just released a working paper – “How Does Bank Capital Affect the Supply of Mortgages? Evidence from a Randomized Experiment.” Given the intense focus on banks lifting capital ratios, this is an important question.  They conclude that higher bank capital is associated with a higher likelihood of application acceptance and lower offered interest rates, whilst banks with lower capital reject applications by riskier borrowers and offer lower rates to safer ones. In other words, changing capital ratios directly and indirectly impact lending policy, but not necessarily in a linear or expect way.

The recent financial crisis refocused the attention on how the health of banks affects financial stability and macroeconomic growth. In particular, the academic and policy debates currently center on the effects of bank capital on lending and risk-taking. Indeed, both macroprudential and the microprudential regulatory reforms propose to raise bank capital ratios and strengthen bank capital buffers, with the aim of preventing “excessive” lending growth and increasing the system’s resilience to adverse shocks.

Yet, there is only a limited degree of consensus on the effect of higher bank capital on lending. On the one hand, higher bank capital increases both the risk-bearing capacity of banks and incentives to screen and monitor borrowers, in this way boosting lending. On the other hand, as debt creates the right incentives for bankers to collect payments from borrowers, lower debt and higher capital may reduce banks’ lending and liquidity creation.

In this paper we study the effect of bank capital on banks’ propensity to grant mortgages and on their pricing. We also explore how bank capital affects the selection of borrowers and the characteristics of offered mortgages, deriving implications for risk-taking. Finally, to detect possible non-linearities, we provide nonparametric estimates.

We focus on mortgages, whose relevance for both macroeconomics and financial stability has been unquestionable following the 2007-2008 financial crisis. In the first half of the 2000s, a strong increase in mortgage originations fueled a housing boom in several countries (US, UK, Spain, Ireland). That boom in turn led to a high accumulation of risks, which subsequently materialized causing the failure of several banks and a large drop in house prices. Understanding how bank capital affects mortgage originations and the way banks select the risk profiles of borrowers is thus critical to evaluate developments in the mortgage market and the potential accumulation of both idiosyncratic and systemic risks.

We use a new and unique dataset of mortgage applications and contract offers obtained through a randomized experiment. In particular, we post randomized mortgage applications to the major online mortgage broker in Italy (MutuiOn-line) in two dates (October 16, 2014, and January 12, 2015). Upon submitting any application, the online broker requires prospective borrowers to list both their demographic characteristics (income, age, job type) and the main features of the contract requested (amount, duration, rate type). By varying those characteristics, we create profiles of several “typical” borrowers who are submitting distinct applications for first home mortgages. Crucially, through the online broker all participating banks (which include the 10 largest banks in the country accounting for over 70% of the market for mortgage originations) receive the same mortgage applications, defined by the same borrower and loan characteristics. Hence, our estimates are not biased by the endogenous selection of borrowers into contracts or banks and, furthermore, there are no missing data due to discouraged potential borrowers not submitting applications. We then merge those data with the banks’ characteristics from the supervisory reports and, in our empirical analysis, we include several bank-level controls to reduce concerns about omitted variable bias; we exploit the time dimension of our data and we include bank fixed effects to control for unobserved determinants of bank capital in the cross-section; finally, in some specifications, we include bank*time fixed effects, to fully account for all bank specific, time-varying characteristics.

On the one hand, we find that banks with higher capital ratios are more likely to accept mortgage applications and to offer lower APRs. On the other hand, banks with lower capital ratios accept less risky borrowers. However, we cannot rule out that less well-capitalized banks take more risk on other assets (business loans, securities).

We also provide a quantitative estimate of the effect of bank capital ratio on the supply of mortgages, using a nonparametric approach. We find that the capital ratio has a non-linear effect on the probability of acceptance, stronger at low values of the ratio, almost zero for higher values. This non-linearity is more pronounced when the borrower or the contract are riskier.

Note: BIS Working Papers are written by members of the Monetary and Economic Department of the Bank for International Settlements, and from time to time by other economists, and are published by the Bank. The papers are on subjects of topical interest and are technical in character. The views expressed in them are those of their authors and not necessarily the views of the BIS.

A Macroprudential Approach to Bank Capital

In a speech to the Institute of International Bankers Annual Washington Conference, Alex Brazier, Executive Director for Financial Stability Strategy and Risk, explores the framework of capital requirements for UK banks which was finalised by the Financial Policy Committee in December 2015.

Alex begins by observing that investors’ questions about returns have not translated, as they have done before, into questions about resilience. When UK bank price-to-book ratios were this low in 2009, senior unsecured debt spreads were over 350bps – compared to 73bps today. Underlying that is the transformation of bank capital. In the 2015 stress test, banks absorbed losses of £37bn – over twice the losses of the system in the crisis – even while continuing to grow credit to the real economy.

In December, the Bank of England gave a clear statement about the appropriate baseline level of capital for the systemic part of the UK banking system. Across major UK banks, no less than 3.75% of total assets should be funded with tier 1 capital. On current measures of risk, we expect these banks to fund no less than 13½% of risk weighted assets with tier 1 capital.

Alex says that “after a long march to build capital strength, UK banks are within a hair’s breadth of that [expectation] today. And the rewards of greater resilience are being reaped”.

It was obvious in the aftermath of the crisis where bank capital needed to go. Up. A lot. And with market confidence so low at the time, more capital not only boosted resilience, it also was needed for lending to resume. Alex emphasises that “capital was good for resilience and good for growth”.

However, after a point, another unit of capital buys a much smaller fall in the probability of bank failure. And the evidence that higher capital requirements can push up bank funding costs – costs which will be borne by real borrowers and real savers – cannot be ignored.

How to best protect the real economy without holding it back? The UK answer has three parts.

First, to protect the economy from the consequences of bank failure. And to do so at minimal economic cost. Effective bank resolution unlocks this, opening the door to preserving the functions of failed banks without recourse to the taxpayer. The G20 agreement on Total Loss Absorbing Capacity (TLAC) standards is “a game changer because it hardwires the recapitalisation of failing banks”. Rapid recapitalisation of failed banks speeds economic recovery. International estimates suggest that the removal of the ‘too big to fail’ subsidy cuts the risk of failure by a third. Alex says that “it is essential that efforts to ensure even the largest banks can be resolved remain on track”.
But even with an effective resolution backstop in place, the costs of systemic bank failure are far from insignificant.

So the second part is a baseline capital standard that makes the economic disruption caused by a weak banking system extremely rare. But not more so. In the UK, even the two biggest failures of the crisis suffered losses comfortably within the baseline described above. Going further could have a sharply diminishing further effect on the probability of banking failure and could run the risk of economic cost. The biggest banks will be subject to a baseline capital buffer of nearly 5% of risk weighted assets, sitting on top of an 8.5% hard floor for tier 1 capital. This “gives room for systemic banks to absorb losses without being forced to close their doors and cease their service to the economy. It achieves not just greater bank resilience, but greater resilience of service to the macro economy”.
But it would be a mistake to think that a 5% capital buffer is always and everywhere the right one.

So the third part is flexibility. Flexibility to raise capital buffers if the threat of future losses grows, and cut them again if those threats materialise of recede. This avoids what might otherwise be a need to capitalise the system for the very riskiest times, all the time. Alex explains that the Bank is “seeking to match the size of those [capital] buffers – the strength of defence – to the threat of future losses as they change over time”. With the stress scenario varying systematically with our assessment of the risks, the stress test will guide as to how – given banks’ exposures – the Bank’s judgement about the risks should be reflected in capital buffers. The Bank will have a bias to acting early and gradually. It expects to be adding around 1% to the countercyclical capital buffer on UK exposures of all banks, even before the overall threat of future losses looks high. These capital buffers will go as far as needed to ensure banks’ defences keep up with threats if they grow. And if threats materialise, or shrink, the Bank will reduce its expectation for capital buffers back towards the baseline level.

Flexibility extends beyond moving capital buffers up and down. We are learning about the effects of higher capital and leverage requirements. Developments such as the signs of reduced liquidity in sovereign repo markets are prompting us to assess whether targeted amendments to the design of regulations could benefit the real economy, without exposing it to more risk. Alex says that “the design of new requirements was macroprudential. So must be their implementation”.

Alex concludes that “with resolution regimes well advanced and game-changing bail-in principles established, the upward march to higher capital levels can soon reach the new baseline. A baseline that, on what we know today, protects the real economy without unnecessary risk of holding it back. And with the flexibility to adapt and continually align resilience with threats, we have a compelling answer to the question of how to marry prudence with macroeconomic sense. So that you can protect and serve the real economy in good times and bad”.

UK Banks Should Hold More Capital Still

After the financial crisis of 2007/2008 which shook the British economy to its foundations. In the face of what became know as the “credit crunch”, bank after bank found itself stretched. Some would have failed had they not fallen into the arms of the taxpayer – at staggering expense to the public.

New requirements for banks to hold enough capital to prevent them from going under in the event of another financial crisis have been questioned by Sir John Vickers.

Not happy: Sir John has accused the Bank of England of going soft on the banks
Not happy: Sir John has accused the Bank of England of going soft on the banks Credit: PA

In a stark warning Vickers, the author of 2011’s Independent Commission on Banking (ICB) report in the wake of the financial crisis and subsequent bailouts, has called the wisdom of the BoE’s requirements “questionable”. The Bank of England is now in charge of regulating Britain’s banks and, in a rather devastating intervention, Sir John Vickers has basically accused it of going soft on the sector.

The requirement is expected to impose a buffer that equates to 0.5 per cent of risk-weighted assets (RWA) across the banking sector, in addition to existing global ones under Basel II rules from European regulators, but that’s less than the three per cent recommended by the report.

“Some UK banks are so important internationally that they have extra equity requirements to protect global stability. The BoE proposal adds some, but relatively little, further equity to protect domestic stability. The ICB proposal, by contrast, went well beyond global requirements to boost the resilience of the UK banking system,” he said, writing in the Financial Times.

Ring-fencing provides no reason to go easy on capital requirements…the Bank of England should think again.

The systematic risk buffer (SRB) as it’s known, would apply to the UK’s biggest banks such as Lloyds, HSBC, Barclays and RBS, and their soon to be ring-fenced retail banking operations, but not smaller banks and challenger banks to promote competition in the market.

“Given the awfulness of systemic bank failures, ample insurance is need­ed, and equity is the best form of insurance. The recent volatility in bank stocks underlines the importance of strong capital buffers. The BoE should think again,” Vickers warned.

In September 2011, Sir John’s Independent Commission on Banking (ICB) reported back with a series of reforms designed to make the banking system safer and less dependent on state bailouts.

Back in 2011, two of the ICB’s key recommendations were that:

1) banks “ring-fence” their traditional retail deposits and conventional lending from their riskier operations.

2) that the biggest (and therefore the most risky) ring-fenced banks should be required to hold back an extra layer of capital – known as a “Systemic Risk Buffer” – to offset the risk of the loans they make and, if necessary, absorb losses.

The ICB set the additional Systemic Risk Buffer at 3% of a bank’s Risk Weighted Assets and intended it to apply to six of our biggest lenders. Last month the Bank ofThis is biting criticism. Sir John is basically accusing the Bank of England of failing to implement what the ICB recommended. There’s no suggestion of anything underhand – the Bank has publicly set out its justifications, it’s just that Sir John Vickers believes they are weak.

Three factors pushing Australian banks into a retreat home

From The Conversation.

History shows that successfully becoming a multinational bank operating in many countries is difficult.

While many banking skills are transferable across national borders, there are institutional and cultural impediments to overcome. And as ANZ’s strategy shift away from Asia announced last week might demonstrate, the regulatory barriers are significant, particularly for expansion into Asia.

First among these is the ASEAN Banking Integration Framework (ABIF) initiated at the end of 2014. This involves the designation of banks headquartered in the ASEAN region as Qualified ASEAN Banks (QABs).

Such a designation – not available to Australian banks – means that they will be able to operate in other ASEAN countries under exactly the same regulatory arrangements as domestic banks. While the specific competitive advantages this will provide over non-QABs are unclear (and may vary from country to country), this is in essence a barrier to entry for banks from outside the ASEAN region.

It remains to be seen whether the ABIF will succeed, given the vast differences in banking structure and development across the region, not to mention political factors. Nevertheless, the development is not conducive to an Asian expansion strategy for Australian banks.

A second factor is the regulatory arrangements driven by the Basel Committee, and implemented in Australia by banking regulator, APRA. Capital requirements associated with offshore subsidiaries or joint ventures can be higher than for purely domestic operations.

The Australian banks have complained about this in the past and given bankers’ aversion to higher capital, that also creates a disincentive to offshore operations. (Given generally poor experience with bank offshore expansion over the years, that may be a good result for bank shareholders arising from such regulation).

A related regulatory consideration is the imposition of higher capital requirements on banks which are regarded as systemically important. The major Australian banks are already subject to a higher capital charge for being Domestic Systemically Important Banks (D-SIBS), but offshore expansion could ultimately lead to a Global SIB categorisation and further capital imposts. In general, the thrust of post-crisis regulation is towards disincentives for banks becoming “too big”.

A final factor, virtually unique to Australia, arises from tax considerations. An increasing share of earnings generated offshore would reduce the ability of Australian banks to pay fully franked dividends. This is equivalent to banks facing a higher cost of capital for overseas activities than for domestic activities.

For shareholders (such as this writer) in ANZ or other Australian banks, this would mean that offshore expansion would need to be even more profitable than domestic activities to be value adding. Then, and it is an unlikely outcome, higher partially franked dividends could be paid to offset the reduction in franking.

So: the cost of capital is probably higher for overseas versus domestic activities of Australian banks (due to dividend imputation); capital requirements are a bigger problem; and the ASEAN region is putting some potential roadblocks in place which hinder ease of foreign bank entry and competitiveness.

And added to all that is the massive potential disruption to traditional banking being posed by innovation and Fintech, requiring a focused response to preserve competitive advantages in existing markets and products.

Retreat to Australia sounds like a sensible response for Australian banks.

Author: Kevin Davis, Research Director of Australian Centre for FInancial Studies and Professor of Finance at Melbourne and Monash Universities, Australian Centre for Financial Studies