CBA Profit Up 2% HY to Dec 2015

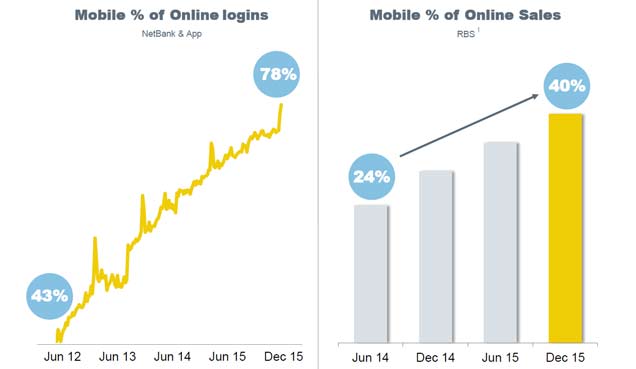
In CBA’s results, announced today, we see a well managed portfolio, with no surprises on either capital or dividends. They had the benefits of higher home loan pricing, and deposit rate management helping to offset some pressure in returns from the Institutional Banking arm. CBA’s early moves into digital banking continue to pay off, with 40% of retail banking sales now via mobile devices. Exposure to the resources sector is controlled, and the bank is well capitalised (on  a relative and absolute basis), with a lift in key ratios. Earning per share decreased a little.

Statutory net profit after tax (NPAT) for the half year ended 31 December 2015 was $4,618 million, a 2 per cent increase on the prior comparative period (‘pcp’). Cash net profit after tax increased 4 per cent to $4,804 million, 6 per cent higher on the prior half. Return on equity was 16.6% and earnings per share was 273.6 cents, a decrease of 1% on the prior comparative period.

The Board declared an interim dividend of $1.98 per share, unchanged from the 2015 interim dividend. The dividend payout ratio is 70.8 per cent of cash NPAT. The interim dividend, which will be fully franked, will be paid on 31 March 2016. The ex-dividend date is 16 February 2016. The Dividend Reinvestment Plan (DRP) will continue to operate, but no discount will be applied to shares issued under the plan for this dividend. The Group is also considering the issue of a Tier 1 capital instrument to replace PERLS III should markets be receptive.

In summary, operating income growth was solid across most businesses, relative to both the prior comparative period and prior half but operating expenses increased due to underlying inflationary pressures, the impact of foreign exchange, increased investment spend and higher amortisation, though partly offset by the incremental benefit generated from productivity initiatives. Also loan impairment expense increased mainly due to higher provisioning in Institutional Banking and Markets, Retail Banking Services, and IFS.

Group transaction balances grew 21 per cent and above-system growth was achieved in household deposits (up 10.6 per cent) and business lending (up 6.8 per cent, excluding Bankwest). A balanced approach to margin over volume in home lending produced growth of 6.5 per cent, slightly below system. ASB saw 12 per cent growth in business and rural balances.

Other banking income increased 4 per cent, due to higher profits from associates and solid growth in fees and commissions, partly offset by derivative valuation adjustments.

Growth in insurance and funds management income of 17 per cent and 6 per cent, respectively, led to a 10 per cent increase in underlying profit after tax for the Wealth Management division.

Operating expenses increased 6% to $5,216 million, including a 1% impact from the lower Australian dollar. This reflects higher staff costs from inflation-related salary increases, increased investment spend and higher amortisation. This was partly offset by the continued realisation of incremental benefits from productivity initiatives

Ongoing investment spend, inflation and unfavourable foreign exchange movements resulted in a 6.1 per cent increase in total operating expenses. On an underlying basis, expenses grew 3.8 per cent as a result of cost discipline in business units. Total investment spend increased 14 per cent, with the majority earmarked for productivity and growth initiatives.

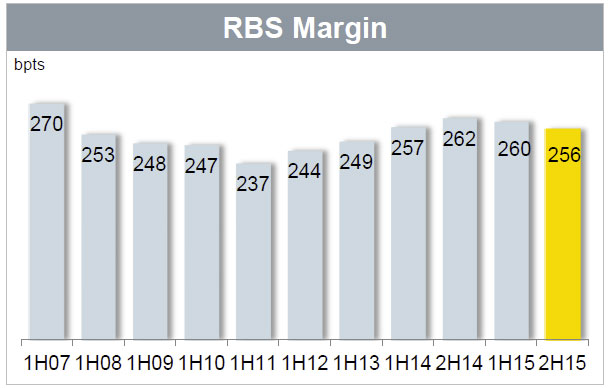
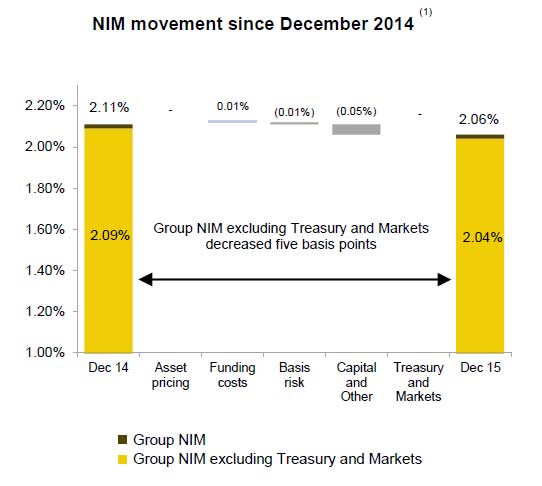
Net interest income increased 6 per cent to $8,364 million, reflecting 9 per cent growth in average interest earning assets driven by solid volume growth and revenue momentum across the business. This increase includes a 1% benefit from the lower Australian dollar. Net interest margin excluding Treasury and Markets decreased five basis points on the prior comparative period to 2.06%.

CBA-Feb-2106-1
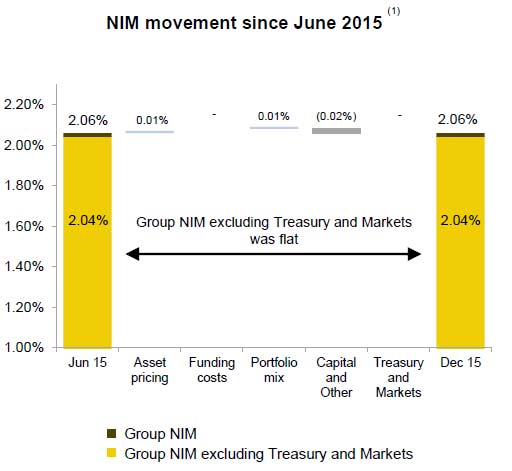
However, overall, 2.06% is the same as Jun 15 Half.  This was helped by higher home lending margins, due to investor and variable rate pricing; and stable deposit margins, driven by a benefit from a change in deposit mix, offset by the lower cash rate environment. In addition, better margins from lending to business, and lower business deposit rates contributed.  However, at BankWest, net interest margin decreased on the prior half, due to lower business lending margins and the lower cash rate impact on deposit margins, partly offset by increased home loan margins resulting from repricing.

CBA-2016-NIM
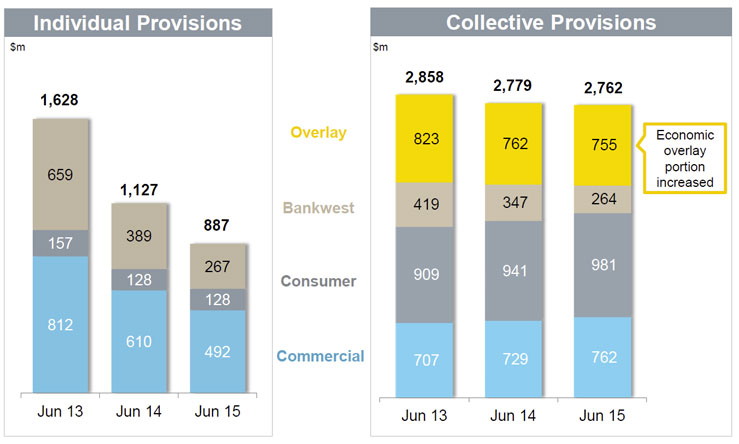
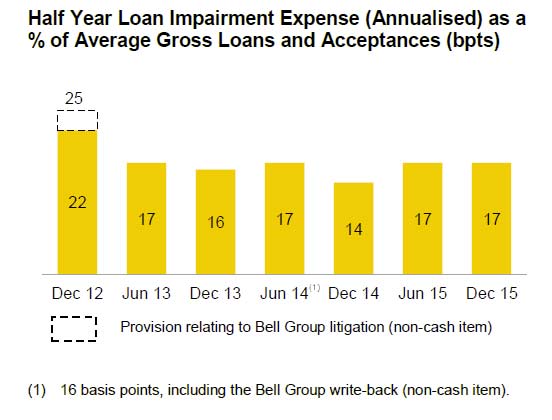
Loan impairment expense increased 3 per cent on the prior half to $564 million, and the loan loss ratio remained stable at 17bpts.

CBA-2016-3Various elements contributed to this  including higher collective provisions and a lower level of writebacks in Institutional Banking and Markets; an increase in IFS as a result of provisions in the
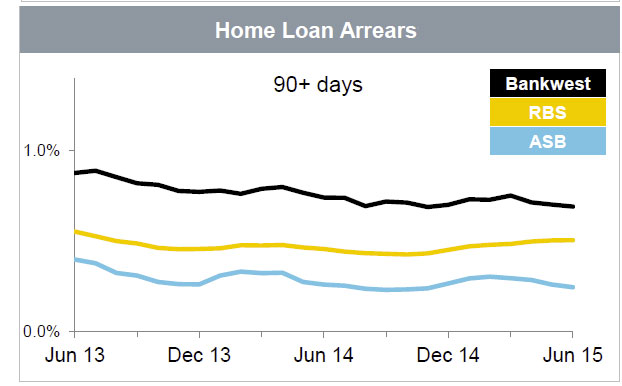
commercial lending portfolio; partly offset by reduced expense in Retail Banking Services driven by seasonally lower arrears across all portfolios; increased write-backs and lower collective provisions in Business and Private Banking; and decreased expense in New Zealand resulting from lower home loan impairment expense, and an increased level of write-backs in the business lending portfolio.

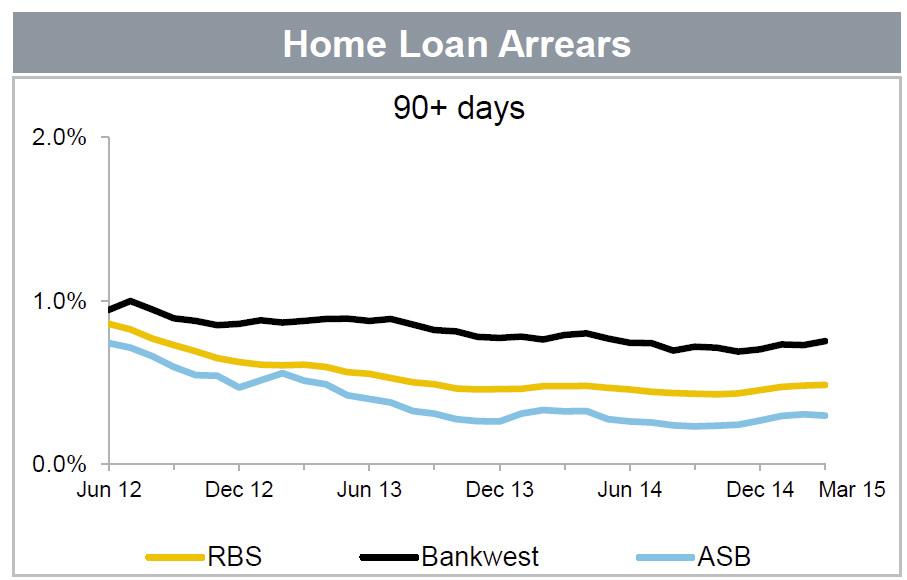
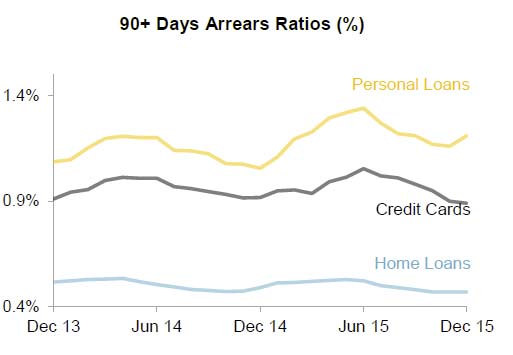
Consumer arrears were well controlled, though whilst the arrears for the home loan and credit card portfolios are relatively low, personal loan arrears remained elevated, driven primarily by Western Australia and Queensland.

CBA-2016-4Commercial troublesome assets increased 2% during the half to $3,123 million. Gross impaired assets were lower on the prior half at $2,788 million. Gross impaired assets as a proportion of GLAAs of 0.41% decreased 3 basis points on the prior half, reflecting the improving quality of the corporate portfolios.

There was no change to the economic overlay.

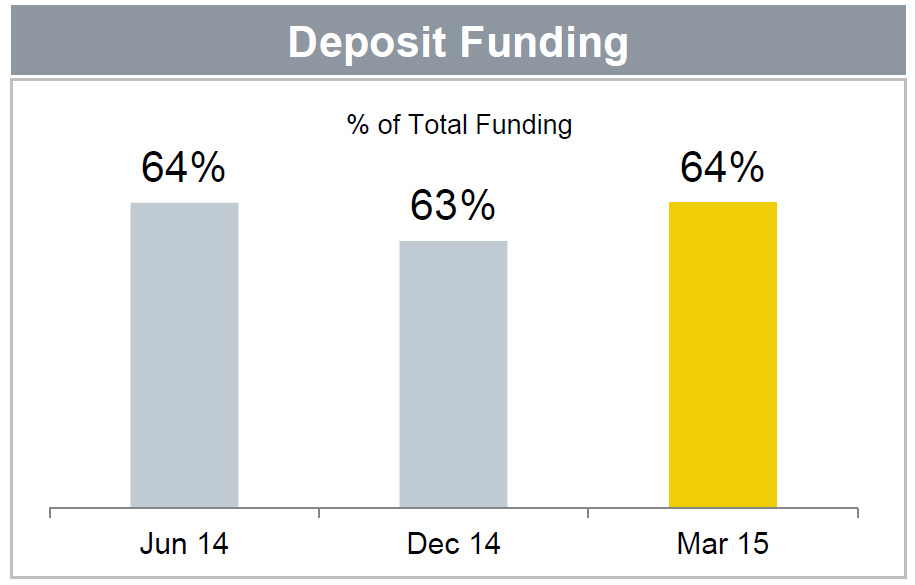
The Group’s balance sheet and conservative positions on capital, funding and liquidity have been strengthened in the first half. Growth in customer deposits of 9 per cent to $500 billion increased deposit funding to 64 per cent of total funding, up 1 per cent. The Group’s liquidity coverage ratio increased to 123 per cent as at 31 December 2015, up from 120 per cent at the end of the prior half, with the Group continuing to benefit from a strong position in more stable deposits.

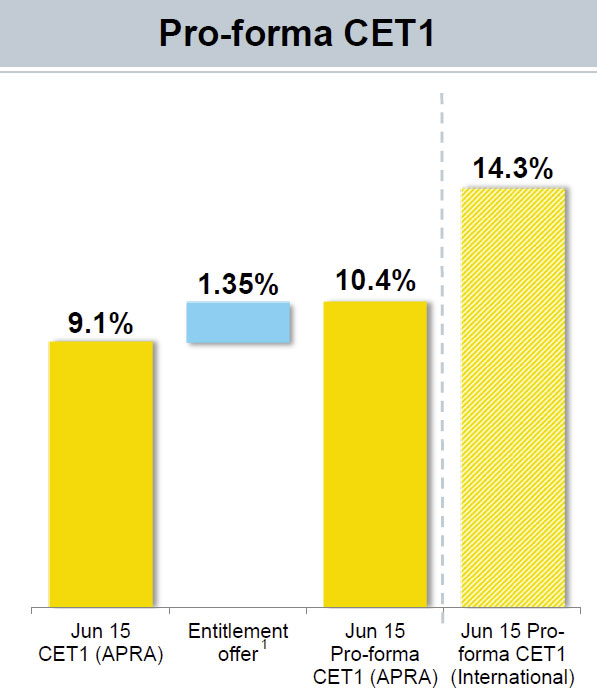
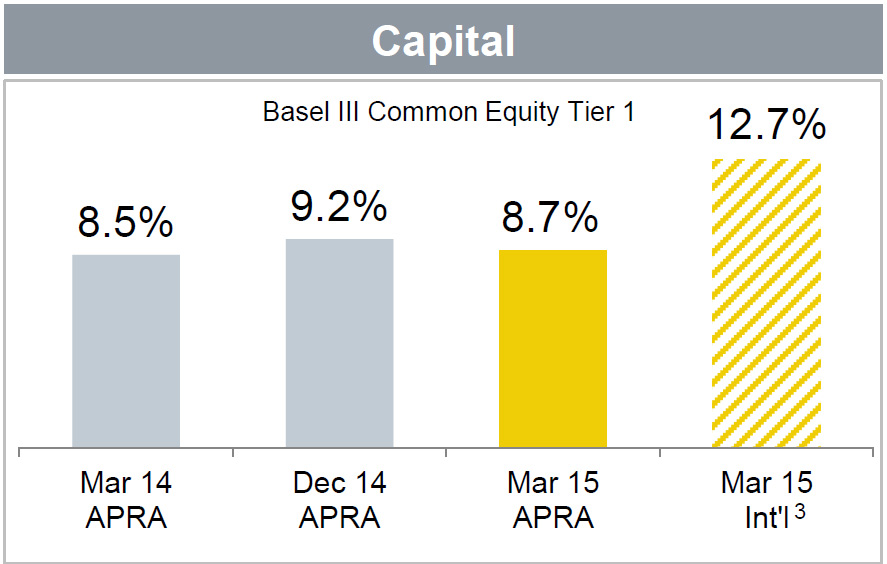
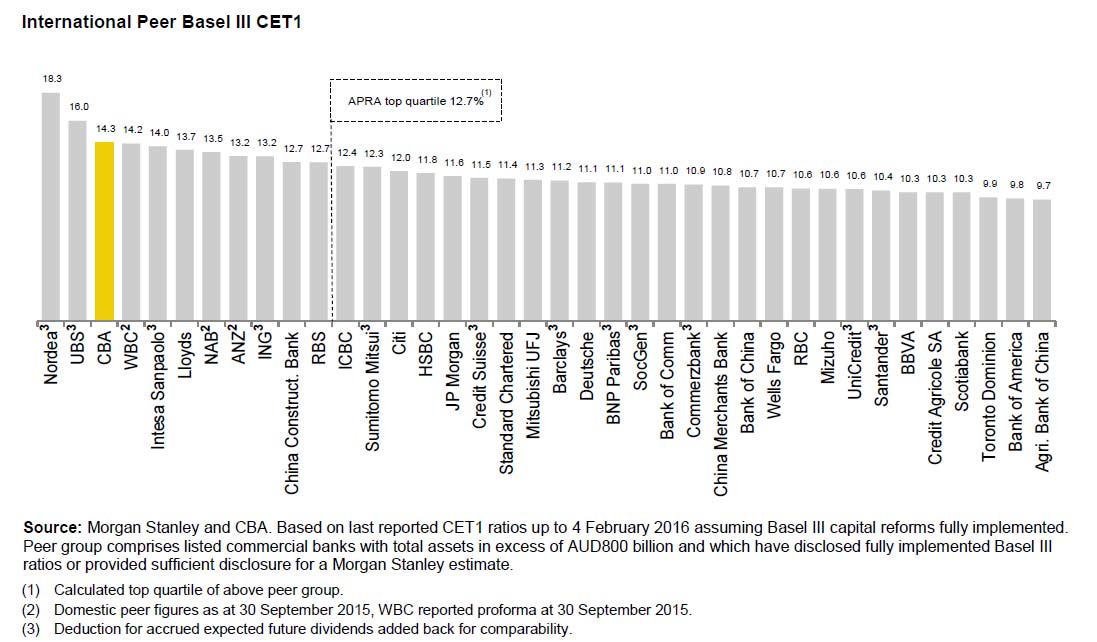
Basel III Common Equity Tier 1 (CET1) capital increased 100bpts to 10.2 per cent on an APRA basis (14.3 per cent on an internationally comparable basis), reflecting organic capital growth and the proceeds of the rights issue.

CBA-2016-5
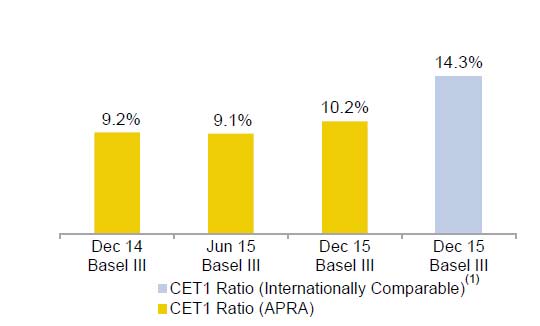
They say this puts the Group in the top quartile of banks globally for capital adequacy.

CBA-2016-6Customer satisfaction rankings continued to improve.

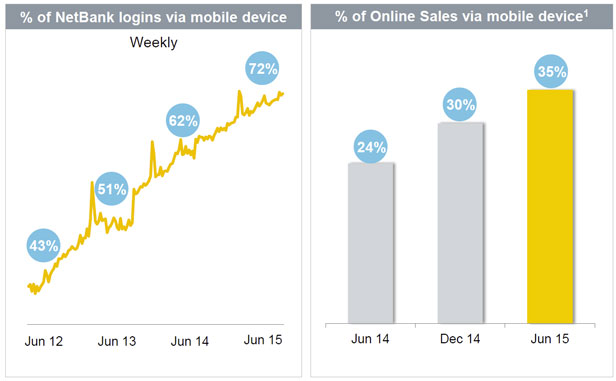
They reported a strong uptake of digital and mobile services in the half with  Tap & Pay card numbers  more than doubling on the prior half, Cardless Cash transactions grew 96 per cent, and the value of transactions via the CommBank app was up 27 per cent. The volume of transfers via mobile now exceeds BPAY volumes through Netbank. They are also seeing customers increasingly turn to mobile for product purchases with mobile now accounting for 40 per cent of Retail Banking Services sales.

CBA-2016-7In the half, CBA made additional future-focused investments in technology and skills. This included $10 million to help Australian researchers build the world’s first silicon-based quantum computer,  committed $1.6 million to develop a centre of expertise for cyber security education with the University of New South Wales. They also launched a series of blockchain workshops for industry and regulators, and are collaborating with other international banks on blockchain trials.

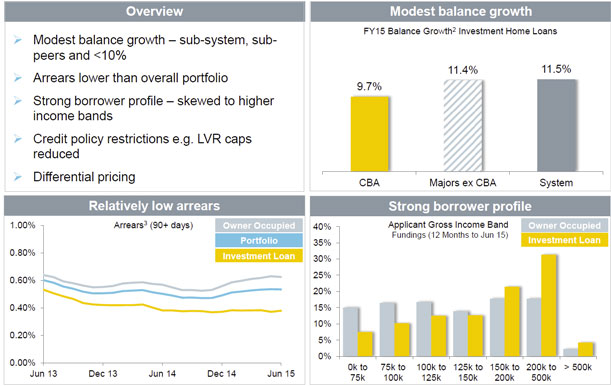
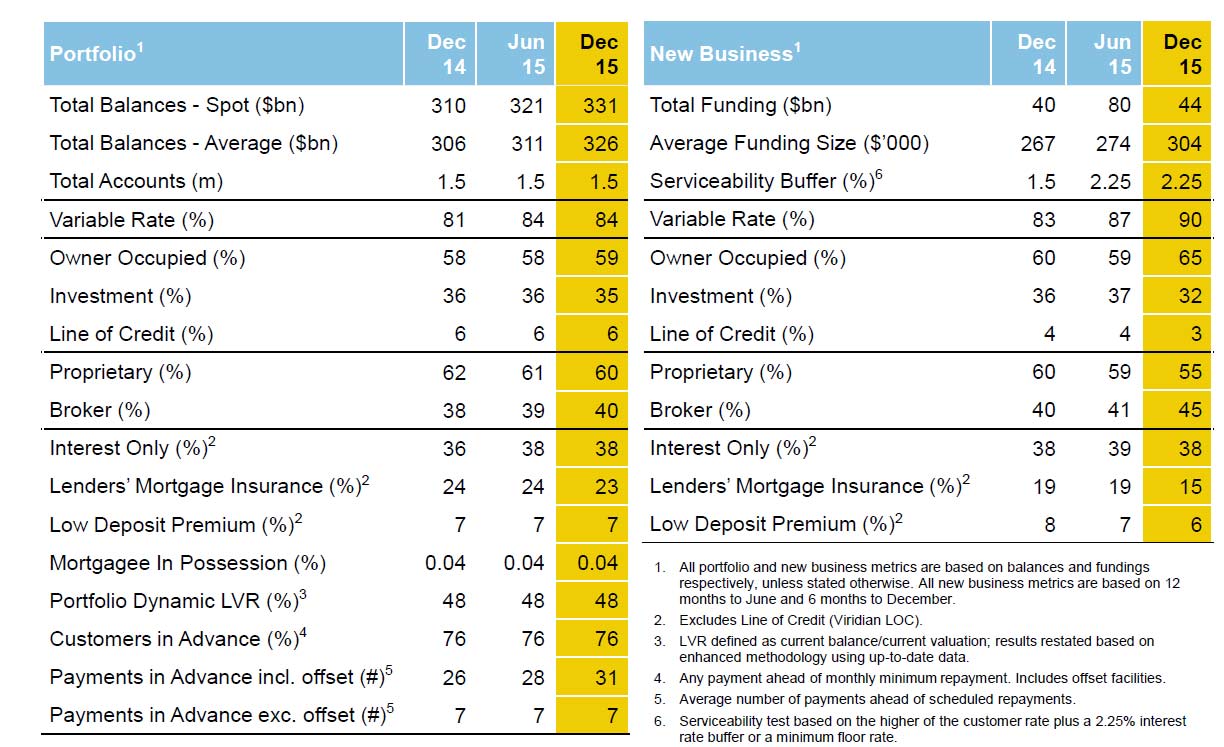
Looking in detail at home lending in Australia, CBA provided some interesting insights. For example,  looking at the core Australian Bank portfolio, 45% of new home loans are originated via brokers. 38% of new loans are interest only, and the current serviceability buffer has been lifted by 75 basis points in the past year. Those customers paying in advance, including offsets, was 76%.

CAB-2016-8
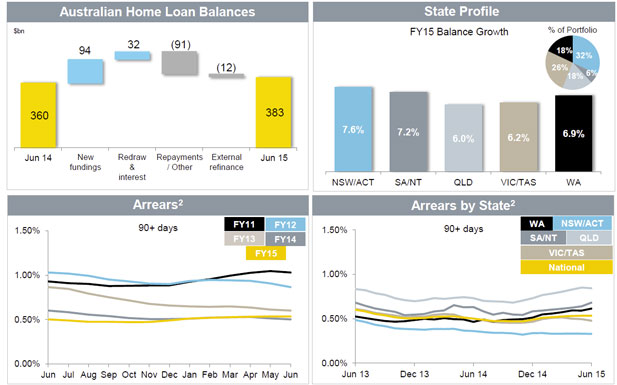
They also show that 90+ arrears are growing fastest in WA.

CBA-2016-9
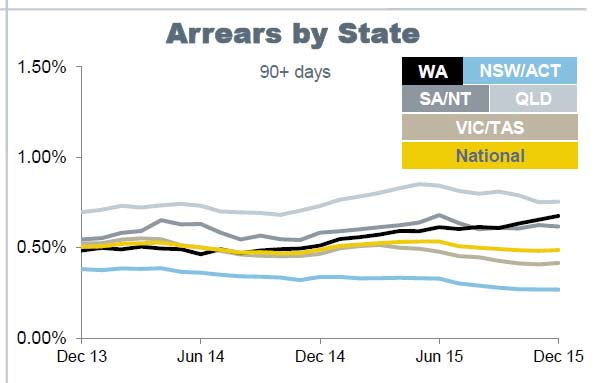
On the other hand, portfolio is much stronger in NSW and VIC.

Finally, they reported exposures to Mining, Oil and Gas at $18.9bn – or 1.8% of Group TCE. They argue much of the portfolio is investment grade. Within the portfolio, impaired assets have risen from 0.8% in Jun 15 to 1.9% in December 15.

NSW Leads The States – CommSec

Each quarter CommSec attempts to find out by analysing eight key indicators: economic growth; retail spending; equipment investment; unemployment; construction work done; population growth; housing finance and dwelling commencements. The latest data is just released, and NSW has retained top spot as the best performing economy, edging a little further ahead of Victoria. Both states are maintaining a healthy lead over the other states and territories.

The big change over the past quarter has been the lift of the ACT economy to equal third position alongside the Northern Territory. Western Australia has dropped from fourth to fifth. But there is little to separate the ACT and the Northern Territory in the second grouping of economies.

In the third grouping of state and territory economies, Queensland is sixth ranked, ahead of the South Australia (seventh) and Tasmania (eighth).

CommSecStates-Jan-16

Their measurement has a strong bias towards housing and finance, with 3 metrics directly linked, and others indirectly influenced.  The slowing resources sector is hitting QLD and WA in particular.

SMSFs Outstrip Retail Investors

CommSec analysis has found self managed super fund (SMSF) investors trade twice as often and hold more diverse portfolios than retail investors.

CommSec data has found that SMSFs place double the amount of equities trades on average compared to non-SMSF holders.

Marcus Evans, Head of SMSF Customers, Commonwealth Bank said: “SMSFs are very active in the equities space. Many people often view SMSF accounts as dormant with a lot of long-term investments, however CommSec data shows that this isn’t the case.”

In terms of portfolio make-up, SMSFs have a far more diversified portfolio, holding an average of 14 different securities in their portfolio, compared to just seven for the average equities investor.

“SMSF accounts tend to be far more diversified than those of retail investors, recognising that diversification is an important part of reducing risks and managing a robust portfolio over the long-term,” Mr Evans said.

An analysis of CommSec SMSF trading patterns for the week ending 28 August 2015, which included the biggest single day drop since the GFC, shows an increase in total trade volumes, with overall net buying among SMSFs.

“The increase in trading volumes favouring buying during recent volatility shows investors are constantly keeping an eye on the market and dispels the myth that SMSFs are conservative investors,” Mr Evans said.

In addition to portfolio diversification, SMSFs also hold equities across a broad range of industries, with more than 20 sectors represented. Bank holdings are the most popular equities, making up more than 30 per cent of SMSF holdings, followed by Materials (10 per cent), Telecommunications services (7.3 per cent), Diversified Financials (5.8 per cent) and Food & Staples (5.7 per cent).

“SMSFs are continuing to grow and diversify their portfolios, however equities comprise just one asset class. To have a truly diverse portfolio SMSFs need to look across asset classes for broad investment opportunities,” Mr Evans said.

Commonwealth Bank to refund $80 million after failing to apply benefits

ASIC says Commonwealth Bank of Australia (CBA) will refund approximately $80 million to around 216,000 Wealth Package customers as compensation for failing to apply fee waivers, interest concessions and other benefits since 2008. The refund payments include an additional amount of interest to recognise the time elapsed since the relevant benefit was not applied. CBA reported this matter to ASIC under its breach reporting obligations in the Corporations Act.

For an annual fee, the Wealth Package (for some customers described as ‘Mortgage Advantage Package’)  offered benefits such as interest rate discounts and fee waivers in relation to a range of products including home loans, credit cards, transaction accounts, personal loans, overdrafts and insurance.

CBA relied on staff to manually apply many of the discounts available under the Wealth Package. Investigations revealed that an exception reports, which was designed to detect when the discounts were not properly applied, was not working properly.

CBA discovered the breach following a customer complaint and reported it to ASIC in 2014. CBA committed to fully investigate  the cause of the breach and the impact on all eligible Wealth Package holders. CBA also engaged Ernst & Young, an independent firm, to review and provide recommendations to improve controls, ensure its remediation process would identify all those affected, and ensure an accurate calculation of refunds.

ASIC Deputy Chairman Peter Kell said, ‘This was a significant breach, and shows how important it is for licensees to have robust systems in place to ensure financial products deliver the benefits that consumers have paid for.’

‘Manual processes to apply discounts, waivers and other concessions involve inherent compliance risks. Licensees should carefully consider whether those risks are being appropriately managed, or are capable of being appropriately managed’ Mr Kell said.

CBA has simplified the Wealth Package by reducing the number of options and products on offer. These changes have not removed benefits that existing package holders were entitled to receive for existing eligible products.

CBA Expands Digital Wallet

CBA has announced that the CommBank app Tap & Pay now supports both MasterCard and American Express credit card payments, adding to the existing debit card functionality and giving more Australians the ability to further embrace the digital wallet and manage their money on-the-go.

Customers can now make credit card purchases at the Point of Sale using CommBank app Tap & Pay on all Android handsets with NFC, as well as the CommBank PayTag solution for iPhone users. CommBank is the first Australian bank to roll out American Express payments on all Android devices.

The latest development of the digital wallet reflects rapid customer adoption of contactless payments. Since launching Tap & Pay supporting Debit MasterCard using NFC technology in Android phones in March this year, more than 300,000 cards have been set up on the CommBank app and one million transactions have been processed.

Angus Sullivan, Executive General Manager, Retail Products and Strategy, Commonwealth Bank, said:

“Australia has some of the highest volumes of contactless payments globally and with more than 2.8 million users of the CommBank app each week, we are focused on delivering innovative payment features to our customers.

“This next evolution of the digital wallet places the power of mobile technology in the hands of even more Australians, giving them more convenient access to their finances whenever and wherever they are,” he said.

Delivering value beyond making payments

Tap & Pay is one of many features developed by CommBank to deliver simple and convenient mobile experiences. Others include:

  • Loyalty feature in the CommBank app allows customers to scan the barcode of their physical loyalty cards and add a digital copy of them to the CommBank app, eliminating the need for a physical wallet.
  • Cardless Cash in the CommBank app allows customers to make withdrawals at ATMs without the need for a physical card.
  • Lock, Block & Limit provides a safe and immediate way to lock credit cards for overseas purchases, block ATM cash advances, set spending limits, as well as put a temporary lock on a misplaced card or report a lost/stolen card for replacement.
  • The CommBank Offers app, currently piloting at Westfield Hornsby, enables customers who have an iPhone 5 or above to opt-in and take advantage of tailored merchant offers that deliver value based on their shopping behaviour and location.

CBA 1Q Results Shine

The Commonwealth Bank (“the Group”) today advised that its unaudited cash earnings for the three months ended 30 September 2015 (“the quarter”) were approximately $2.4 billion. Statutory net profit on an unaudited basis for the same period was approximately $2.3 billion, with non-cash items treated on a consistent basis to prior periods.

The cash profit was in line with expectations, margin was consistent (before the upside from recent repricing), losses were well controlled, and implied expenses were managed well.  Capital ratios have improved (though are slightly lower than expected) and funding remains strong.

Key outcomes for the quarter are summarised below:

  •  Income growth was similar to FY15. Underlying Group Net Interest Margin (excluding Treasury and Markets) was stable, whilst overall Group NIM was slightly lower largely due to higher liquid assets. Trading income was a little lower than the quarterly average of FY15, reflecting a slightly negative Derivative Valuation Adjustment in the quarter;
  • Across key markets, household deposits balance growth was strong and above system. Home lending continued to trend in line with recent growth rates, whilst core domestic business lending growth remained at mid-single digit levels (12 months rolling). In Wealth Management, FirstChoice and Custom Solutions achieved combined net flows of $0.9bn for the quarter, whilst FUA declined two percent on falling investment markets, partially offset by exchange rate movements and investment performance. ASB lending growth was solid;
  • Operating expense growth continued to reflect a combination of business growth and investment, ongoing regulatory and compliance costs and FX impacts;
  • Credit quality remained sound, with arrears levels reducing across all consumer portfolios in line with seasonal expectations. Troublesome and impaired assets reduced to $5.5 billion. Total loan impairment expense was $220 million in the quarter, with strong provisioning levels maintained and the economic overlay unchanged;
  • The Group’s Basel III Common Equity Tier 1 (CET1) APRA ratio increased 70 basis points to 9.8 per cent, driven by the proceeds of the Group’s entitlement offer and capital generated from earnings, partially offset by the impact of the June 2015 final dividend and higher risk weighted assets. The Group’s Basel III Internationally Comparable CET1 ratio as at 30 September 2015 was 13.6 per cent. The Group’s Leverage Ratio was 4.7 per cent at 30 September 2015 on an APRA basis and 5.3 per cent on an internationally comparable basis;
  • Funding and liquidity positions remained strong, with customer deposit funding at 63 per cent and the average tenor of the wholesale funding portfolio at 3.8 years. Liquid assets totalled $137 billion with the Liquidity Coverage Ratio (LCR) standing at 123 per cent.  The Group’s long term funding increased by $8.6 billion in the quarter.

CBA Lifts Mortgage Rates

As predicted, another major has announced hikes in its mortgage rates. Commonwealth Bank will increase in its variable home loan rates by 15 basis points for both owner occupied and investment variable rate mortgages, partially offsetting costs associated with recent changes to capital requirements.

As a result, for owner occupiers, the standard variable home loan rate will increase to 5.60% per annum. For investment home loan standard variable rate customers, interest rates will rise to 5.87% per annum. The new rates will be effective from 20 November 2015.

The bank cites the higher capital requirements as the driver, and says it has carefully tried to balance the interests of its customers and shareholders in pitching the quantum of the increase.

Matt Comyn, Group Executive for Retail Banking Services said: “The Commonwealth Bank is supportive of an Australian financial system that is strong, stable and competitive. We recently raised $5.1 billion to strengthen our capital position in line with new regulatory requirements implemented in response to the Financial System Inquiry. We have now reviewed our home loan pricing in light of these changes.

“As Australia’s largest home lender, we are committed to delivering competitive products and services to our customers, while maintaining an unquestionably strong capital position.

“Any decision to change interest rates is carefully considered. The cost of the new capital required to make the Australian banking system more secure needs to balance the interests of our customers, as well as the nearly 800,000 households who are direct shareholders and the millions more who are invested through their superannuation funds.”

Fixed rates and business rates remain the same, with the current Owner Occupier Wealth Package 2-year fixed rate remaining at 4.29% per annum.

Expect other lenders to follow, using the capital and financial stability alibis to protect margins.

In addition, some will argue the RBA should now cut rates in November, to adjust for recent home lending rate rises, but given the high growth rates in lending, as APRA highlighted today, we think this would be inappropriate.

CBA Announce Results to 30 June 2015 With Profit up 5% and $5bn Share Rights Offer

CBA announced its results for the financial year ended 30 June 2015. The Group’s statutory NPAT was $9,063 million, which represents a 5 per cent increase on the prior year. Cash NPAT was $9,137 million, also up 5 per cent. The Group also announced the launch of a $5 billion pro rata renounceable entitlement offer for all shareholders. The Group remained one of only a limited number of global banks in the ‘AA-’ ratings category.

Whilst an impressive result, we see signs of margin compression and rising levels of arrears, which, together with higher capital costs may constrain future momentum.

Group net interest income increased by 5 per cent, with average interest earning assets up $50 billion to $755 billion and retail and business average interest bearing deposits – up $32 billion to $445 billion. However, net interest margin (NIM) decreased by 5 basis points to 2.09 per cent year on year driven by the negative impacts of the falling cash rate environment and an increase in liquid assets. Excluding treasury and markets, Group NIM was down 1 basis point over the year in a highly competitive, low-rate environment. Underlying Group nim dropped 3 basis points in the second half. The Australian bank margin continues to slide, with pressure in the second half.

CBA-June-2015---RBS-MarginsOther banking income increased 12 per cent due to increased commissions, higher trading income, which was driven by strong Markets sales and trading performance and a favourable counterparty valuation adjustment. This was partly offset by the implementation of a new derivative valuation methodology, Funding Valuation Adjustment (FVA), which resulted in an initial cost of $81 million.

Funds management income was flat on a “headline” basis at $1,938 million. Excluding the impact of Property transactions and businesses from the comparative results, income increased 8 per cent, driven by a 14 per cent increase in average Funds Under Administration.

Insurance income decreased 3 per cent due to an unusually large number of weather event claims during the year in New South Wales and Queensland.

Expense growth was higher, increasing 5 per cent on the prior year, due to staff expenses and the impact of the lower Australian dollar. The major driver of expense growth was growing regulatory, compliance and remediation costs, including those associated with a number of legislative reforms (FATCA, FoFA, Stronger Super), provisioning for the costs of the Advice Review program and ongoing regulatory engagement.

The Group improved its cost-to-income ratio by 10 basis points to 42.8 per cent, assisted by the continued focus on productivity initiatives which delivered savings of $260 million over the past 12 months.

In a relatively stable credit environment, the ratio of cash loan impairment expense (LIE) to gross loans and acceptances remained unchanged at 16 basis points. Total loan impairment provisions were $3.6 billion, and the ratio of provisions to credit risk weighted assets at 1.14 per cent.

CBA-June-2105---ProvisionsCollective provisions included a management overlay of $755 million including an increased economic overlay. 90 day home loan arrears are higher at Bankwest.

CBA-June-2015---90-DaysCustomer deposits, now account for 63 per cent of total funding. During the year, the Group issued $31 billion of long-term wholesale debt in multiple currencies.

The Group continued to invest in the long-term growth of the business, with $1.2 billion invested on initiatives including risk and compliance projects, technology and productivity; Ongoing organic capital generation delivered a Basel III CET1 ratio of 12.7 per cent on an internationally comparable basis and 9.1 per cent on an APRA basis. The APRA change increases risk weights from approximately 16% to 25%. As at 30 June 2015, the impact for CBA would result in a decrease of 95bps in CET1 (approximately $4bn).

The Group will offer entitlements to CBA ordinary shares pro rata to all eligible shareholders, which can be exercised to buy 1 new share for every 23 shares held on the record date for the offer at an offer price of $71.50 per new share at a 10.5 per cent discount to the dividend adjusted closing price on the ASX on 11 August 2015. The offer will be fully underwritten to raise approximately $5 billion. Approximately 71 million new fully paid CBA ordinary shares will be issued (approximately 4.3 per cent of shares on issue). Following the capital raising, the Group’s pro forma CET1 ratio will be 14.3 per cent on an internationally comparable basis (which assumes full implementation of the Basel III reforms), and 10.4 per cent on an APRA basis. In December 2013, APRA announced that the Australian major banks are domestic systemically-important banks (D-SIBs). From 1 January 2016, D-SIBs are required to hold 1% additional capital in the form of CET1 (called the D-SIB buffer)

CBA-June-2015---CET1Interesting to note the flow through of online activity into the bank, with the proportion of logins via a mobile device, and online sales rising. Absolutely no surprise, as foreshadowed in the DFA “Quiet Revolution” report. 39% of credit card sales were online.

CBA-June-2015---OnlineFinally, looking at the Australian Home Loan portfolio, CBA has the largest footprint for owner occupied loans. The chart below shows the combined CBA and Bankwest portfolio. Arrears are lowest in the fastest growing state, NSW.

CBA-June-2015---Home-Loans-1Looking specifically at investment property loans, CBA is growing its portfolio below the 10% speed limit, (9.7% compared with 11.5% system), and show lower arrears in the investment portfolio, and a larger borrower income footprint.

CBA-2015---Home-Loans-2 They provided one stress test scenario, in which stressed losses could be $3.17bn over 3 years, of which $1.98bn would be losses net of LMI recoveries. This is based on December 2014 data. Total stressed losses increased by 1% between June 2014 ($3.14bn) and December 2014 ($3.17bn), primarily due to growth in the Home Loan portfolio.

CBA Follows The Mortgage Pricing Crowd

CBA has announced changes to its investment loan pricing.  Like ANZ, which we covered yesterday, the price rise applies to existing as well as new investment loans, which means that the move, whilst ostensibly connected with APRA’s 10% growth hurdle actually has more to do with the changing capital requirements which were announced this week and the ability to offer keen rates to attract new owner occupied loans (which are not caught by the 10% cap).

Commonwealth Bank has today taken further steps to moderate investor home loan growth and to manage its portfolio to address the Australian Prudential Regulation Authority’s concerns regarding investment home lending growth. The interest rate on investor home loans will increase by 27 basis points to 5.72% per annum. Fixed rates for 1,2,3,4 and 5 year new investor home loans will also increase by between 10 and 40 basis points. There are no increases to the SVR on owner occupied loans and fixed rates for some owner occupied loans have been reduced.

Demand for investor home loans across Australia has reached historic highs, with recent data noting that over 50% of new home loan approvals are for investment purposes. Last December, APRA introduced new regulatory measures to reinforce sound residential lending practices, including actions to restrict investor lending growth to no more than 10% p.a.

Matt Comyn, Group Executive for Retail Banking Services said: “As Australia’s largest home lender, we support the prudential regulator’s actions to ensure lending practices remain sustainable and we have been actively managing our investment home loan portfolio to remain below the 10% growth limit.

“Despite making a range of changes to our investor lending policies in the past few months we have witnessed ongoing investor lending growth, and at an industry level, investor lending approvals remain 22% higher than 12 months ago.”

Commonwealth Bank has moved to ensure it remains competitive for owner occupied loans and we have reduced rates on our 1,2,3, and 4 year fixed rate loans by up to 30 basis points. These fixed rate changes came into effect this week (22 July 2015).

“In the current market conditions, we believe these changes strike an appropriate balance in our portfolio between owner occupied home loans and those seeking investment loans,” Mr Comyn said.

Fixed rate loans for investors will increase by between 0.10% and 0.40% . This will apply to new loans only and will come into effect from 31 July 2015.

The new investment home loan rate of 5.72% remains one of the lowest rates offered by CBA and is 0.18% lower than the rate six months ago. It will apply to new and existing customers and will come into effect from 10 August 2015.

We expect the other majors to topple into line, so moving pricing of investment loans higher. Some fixed owner occupied rates are cut, so CBA is re-balancing its portfolio. Now of course the question will be, does this translate into dampening demand for investment property, as the RBA hopes, or does it simply lift the interest costs which can be set against tax, (remember many investment loans are interest only). Given the significant capital appreciation we have been seeing lately, and that fact that rates are low (as low as ever) we suspect demand will still be there. It is conceivable as this works through the RBA may have more wriggle room for another rate cut, but we are not so sure.

CBA 3Q Trading Update – Is Pressure Rising?

The CBA released their 3Q update today.  We see the same signs of margin pressure and likely slower growth ahead, as in the recent results from ANZ and Westpac. We think the sector will be under more pressure going forwards. Extra capital requirements will also bear down in coming months. Provisions, at the bottom of the cycle were up.

Unaudited cash earnings for the three months ended 31 March 2015 (“the quarter”) were approximately $2.2 billion. Statutory net profit on an unaudited basis for the same period was also approximately $2.2 billion, with non-cash items treated on a consistent basis to prior periods. This was below market expectations.

Revenue growth was similar to 1H15. Group Net Interest Margin continued to be impacted by competitive pressures by around 3 basis points. Trading income remained strong; Expense growth was higher in the quarter, impacted by growing regulatory, compliance and remediation costs, including those associated with a number of legislative reforms (FATCA, FoFA, Stronger Super, LAGIC), provisioning for the advice review program and ongoing regulatory engagement.

Across key markets, home lending volume growth continued to track slightly below system, consistent with the Group’s underweight position in the higher growth investment and broker segments; core business lending growth remained at mid-single digit levels (pa), household deposits growth was particularly strong in the quarter, with balances growing at an annual rate of over 10 per cent; in Wealth Management, Funds under Administration and Assets under Management grew 7 and 8 per cent respectively in the quarter, reflecting strong investment performance, net inflows and FX gains; insurance inforce premiums increased 3 per cent on the prior quarter; ASB business and rural lending growth remained above system and home loan growth was stronger Credit quality remained sound.

In the retail portfolios, home loan and credit card arrears were broadly flat, whilst seasonal factors contributed to higher personal loan arrears. Troublesome and impaired assets were lower at $6.4 billion. Total loan impairment expense was $256 million in the quarter, up from $204m a year earlier, with strong provisioning levels maintained and the economic overlay unchanged. Home loan arrears were higher in Bankwest than the Australian and New Zealand businesses.

CBA-Home-Loan-Arrears-May-2015The Group’s Basel III Common Equity Tier 1 (CET1) APRA ratio was 8.7 per cent as at 31 March 2015, an increase of 20 basis points on December 2014 after excluding the impact of the 2015 interim dividend (which included the issuance of shares in respect of the Dividend Reinvestment Plan). The Group’s Basel III Internationally Comparable CET1 ratio as at 31 March 2015 was 12.7 per cent. They will need to raise more capital on these ratios than we expected.

CBA-Capital-May-2015  Funding and liquidity positions remained strong, with customer deposit funding at 64 per cent and the average tenor of the wholesale funding portfolio at 3.9 years.

CBA-Deposit-Funding-May-2015Liquid assets totalled $144 billion with the Liquidity Coverage Ratio (LCR) standing at 122 per cent. The Group completed $8.5 billion of new term issuance in the quarter.