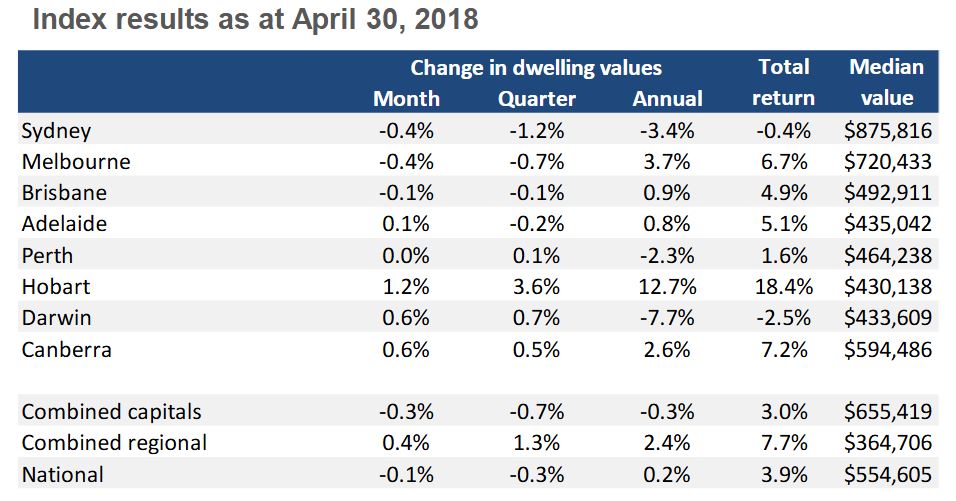
Corelogic published their hedonic index for April 2018. Capital city dwelling values record their first annual decline since November 2012 while regional dwelling values continue to edge higher.
National dwelling values nudged 0.1% lower in April, the seventh consecutive month-on-month fall since values started retreating in October last year.
The declines were concentrated within the largest capitals, while regional dwelling values edged 0.4% higher.
Capital city dwelling values were 0.3% lower over the month, driven by larger falls of -0.4% in Sydney and Melbourne and a smaller decline in Brisbane values (-0.1%). The falls were offset by flat conditions in Perth and subtle rises in Adelaide (+0.1%), Darwin and Canberra (both +0.6%). Hobart was the only city where dwelling values rose by more than 1% in April.
On an annual basis, the combined capitals recorded the first decline in dwelling values since late 2012, with values slipping 0.3% lower, driven by falls in Sydney (-3.4%), Perth (-2.3%) and Darwin (-7.7%). The only capital city to see an improvement in annual growth conditions relative to a year ago is Perth, where the rate of decline has slowed from -3.0% last year to -2.3% over the past twelve months.
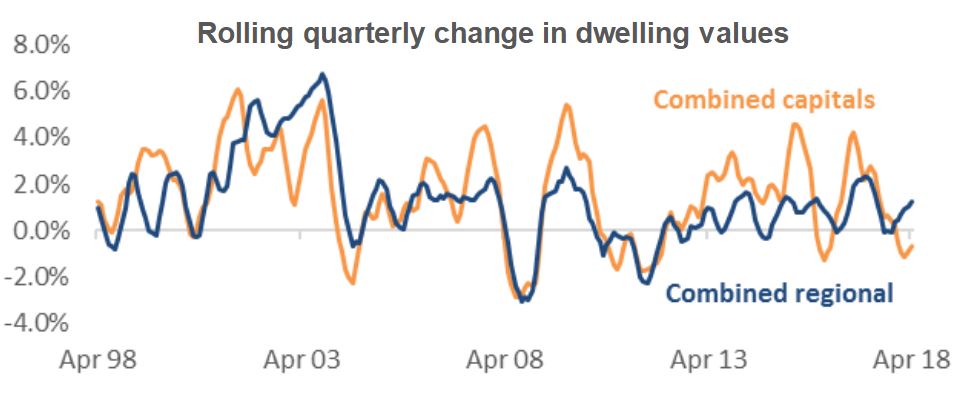
Regional areas now outpacing the capital cities The past five years has seen combined capital city dwelling values appreciate at the annual rate of 6.8% which is almost double the annual rate across the combined regional markets at 3.5%. The past twelve months has seen capital city dwelling values fall by 0.3% while regional values are 2.4% higher.
Unit values outperform house values Similarly, capital city detached house values have recorded an average annual growth rate of 7.3% over the past five years, while unit values were up 5.5% per annum over the same period. Mr Lawless said, “Despite the surge in unit construction over recent years, the past twelve months has seen unit values continue to trend higher, up 1.9%, compared with a 1.0% fall in house values.”
More affordable housing stock has been resilient to value falls Across the most expensive quarter of the market, dwelling values have increased at almost twice the pace of the most affordable quarter over the past five years, up 8.2% per annum compared with 4.4% per annum. As conditions have slowed down, it’s been the most affordable end of the housing market where values have remained resilient to falls, trending 1.9% higher over the past twelve months while the most expensive quarter of properties has seen values fall by -1.6%.
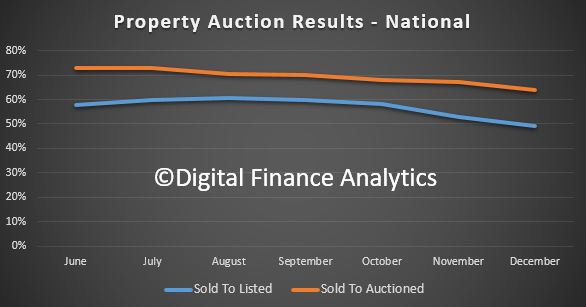
Auction results continue to track lower than last year and more are getting withdrawn before they go to auction. Comparing the listed with sold totals, we get below 50%!
We are also seeing more evidence of property with the “offers invited” sticker rather than the “for auction” label. You can watch our video on the reliability of auction results.
The number of homes taken to auction across the combined capital cities rose this week, with a total of 2,539 held, the higher volumes returned a preliminary clearance rate of 62.5 per cent. Last week, there were 1,799 capital city auctions returning a 62.2 per cent final clearance rate.The combined capital city auction market has seen a relatively steady performance over the year-to-date, with the average weighted clearance rate continuing to track around the low-to-mid 60 per cent range for most of this year despite the level of activity over each week.
Combined results split by property type show the smaller segment of the auction market continued to outperform for another week, with 64.4 per cent of units selling at auction while 61.6 per cent of houses sold this week.
Melbourne saw an increase in clearance rates and volumes this week, with a total of 1,326 Melbourne homes taken to auction returning a preliminary clearance rate of 65.5 per cent, up on the 63.6 per cent last week when a lower 914 auctions were held.
As volumes rose across Sydney this week, the preliminary clearance rate dropped below 60 per cent for the first time since the first week of February earlier this year. The preliminary clearance rate showed 59.8 per cent of the 805 auctions held reportedly sold, however this will likely revise lower as results are finalised early in the week.
Each of the smaller auction markets recorded an increase in auction activity this week; the higher activity saw week-on-week clearance rates strengthen across Adelaide, Brisbane and Perth, while Canberra and Tasmania returned lower clearance rates.
Auction activity remains relatively steady across the combined capital cities this week, with a total of 1,746 homes taken to market, returning a success rate of 63.1 per cent increasing from last week’s final clearance rate which saw the lowest weighted average result so far this year at 61.7 per cent (1,915 auctions).
The results segregated by property type showed that units outperformed houses this week, with 65 per cent of units selling, while the combined houses returned a 62.2 per cent success rate; conversely the house market accounts for a higher proportion of overall auction activity.
Melbourne saw a total of 905 auctions take place this week, returning a 63.8 per cent preliminary clearance rate, which was slightly higher than the 62.4 per cent over the week prior when 873 auctions were held.
The number of homes taken to auction across Sydney fell this week, with 551 held. The lower volumes returned a higher week-on-week clearance rate with 66.4 per cent of properties reportedly selling, increasing on the week prior’s 61.5 per cent final clearance rate when volumes were higher (795).
The performance across the smaller auction markets continues to be quite varied, with Tasmania returning the highest preliminary clearance rate of 75 per cent, while only 19 per cent of auctions were successful across Perth.
There were 1,890 homes taken to auction across the combined capital cities this week, with preliminary results showing a 64.5 per cent success rate. In comparison, 1,839 auctions were held last week and the final clearance rate came in at 62.8 per cent.
Over the same week last year, auction volumes were significantly lower due to the Easter weekend with just 493 homes going under the hammer across the combined capital cities, although the clearance rate was a stronger 73.9 per cent.
In Melbourne, a preliminary auction clearance rate of 64.3 per cent was recorded across 874 auctions this week, down from 68.2 per cent across 723 auctions last week. Over the same week last year, 102 homes were taken to auction across the city, returning a clearance rate of 81.3 per cent.
Sydney was host to 774 auctions this week, with preliminary results showing a 64.9 per cent success rate, up from 62.9 per cent across 795 auctions last week. This time last year, the clearance rate was a stronger 77.0 per cent across 279 auctions.
Canberra recorded the highest preliminary clearance rate this week (74.3 per cent), followed by Adelaide (70.6 per cent).
Looking at auction volumes, Melbourne was the only city to see an increase in the number of homes taken to auction this week, while all other cities saw lower volumes week-on-week.
In the second part of our series on the anatomy of the property auction results, we dive deeper into the numbers.
We compared data from CoreLogic and Domain, two of the players who report auction clearance rates. We summarised the research in our latest video blog.
In each case, there is an interim step, where both Domain and CoreLogic adjust to a lower number of actual auctions on the day. Domain calls them “the number of reported auctions” and CoreLogic “CoreLogic Auctions”.
So, this takes us to two questions. First how are the figures collated and second, what adjustment are made between the listed auctions and final figures?
Domain says their data comes from Australian Property Monitors (APM). APM is of course part of the Domain Group which is a subsidiary of Fairfax Media Limited. APM publishes auction activity results for the Sydney, Melbourne, Brisbane and Adelaide capital cities every Saturday evening, providing a snapshot of how demand and supply in the auction market is behaving and as a leading indicator for the overall property market. (Auction activity for the other capital cities is also monitored and made available by mid week)
APM adopts the Australian Bureau of Statistics geographic definition for capital cities, referred to as the Statistical Division (SD).
APM publishes Auction Clearance Rates (ACR) on the Saturday evening, based on the majority sample collected on that day, for release across various publications on the Sunday, while the process of collecting results continues throughout the week.
When reporting auction activity, APM monitors the following five key elements that can occur to properties listed for auction. These are;
a) Sold prior to auction;
b) Sold at auction (under the hammer)
c) Passed in
d) Withdrawn from auction, or
e) Sold after auction
Including some or all of these five elements of auction activity in the calculation used will affect the reported clearance rate.
APM’s definition of the reported clearance rate calculation is defined as: Sold at auction plus sold prior, over all reported plus withdrawn.
On the “top-line” of the clearance rate calculation, APM considers only those properties sold either prior or during the auction to be “sold at auction”.
On the “bottom-line”, APM includes all reported auctions (including properties passed in), and any listed auctions withdrawn prior to the scheduled auction time.
APM includes withdrawn auctions in the calculation to prevent any bias in the clearance rate caused by properties being withdrawn due to expectations it may not sell or fail to achieve an expected price. It’s still counted as no sale.
I also examined in detail the weekly listings of property sold, each transaction is coded in line with the APM method. I also saw a small number of what appeared to be duplicate transactions across weeks, but not a significant number so I think we can lay to rest the idea that the results may be being inflated by duplicating the same results across multiple weeks.
Turning to CoreLogic, I spoke with Tim Lawless their research guru. This is what he told me:
Our auction data is collected directly from the industry, via a variety of channels including our call centre based in Adelaide, results which are pushed through from agents via our app or portal, or via direct data feeds from agency groups. Each week we publish three sets of clearance rates: Saturday night, Sunday morning (CoreLogic media release) and final results on Thursday morning. The collection of auction results progressively improves across each release as we receive more results from the industry. By the time we finalise our collection on Wednesday afternoon, on average, we collect 90% of auction results.
There has been some discussion that auction results which are not reported each week must also be unsuccessful auctions intentionally withheld by the agent. There may be an element of this – real estate agents aren’t obliged to provide us with their results, however each week it is generally the same agents who choose not to provide their auction results to us.
Regardless, we publish our results with full transparency, showing the number of auctions, together with the number of results collected segmented by successful auctions (sold before, at or prior to auction) and unsuccessful results (unsold, vendor bid, withdrawn). For those that believe the clearance rate should be adjusted lower based on unreported auctions, it’s pretty easy to do so… however the direction of the trend would be very similar, just a lower clearance rate.
For a long time there has been discussion around whether auction results are accurate or not. As a data aggregator and analytics provider, it’s in our best interest to publish results that are as accurate as possible; we have no interest in talking the market up or down.
Thanks Tim.
My take out of that is there may be some holding back of failed sales by some agents, but there is no way to triangulate the quantum of the problem, and there is no mandatory reporting of results. So the data must be seen as a best endeavours exercise. Tim also makes an excellent point that the trends really tell the tale.
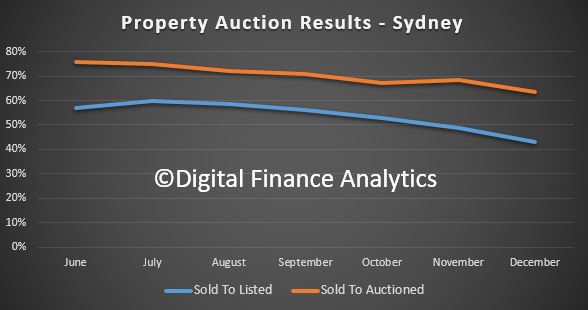
So, one final piece of the puzzle is some analysis we have done of the results, using both the percentage of all listings and sold property. I have charted the monthly trends for the second half of last year.
Here is the plot for Sydney. We see the clearance rates are declining, and the ratio of sold to listed is falling faster – suggesting that more properties are withdrawn (perhaps a sign of a fading market).
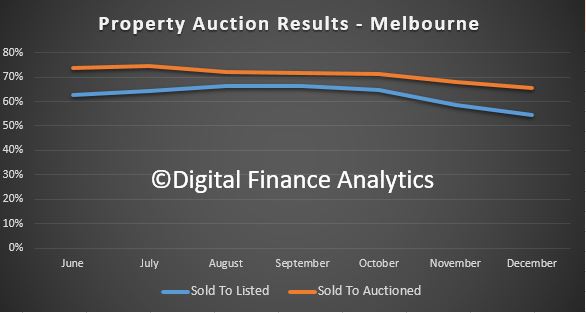
Compare this with Melbourne, where the momentum is also slowing, but the ratio of sold to listed is not so far below the sold to auctioned ratio – which suggests Melbourne is a little more buoyant (though is still slowing).
Finally, we can look at the national picture, which tells a similar story.
One final piece of the puzzle. If I then calculate the number sold properties compared with the transfer counts, which we discussed in a previous post, in the quarter to September 2017, the auctions comprised around 32% of all transfers made – allowing for an average 6-week delay in settling and completing the transaction. Looking back further, this ratio is pretty consistent. But in the December quarter, this shot up to 62% of transfers, which suggests that either there is now more false positives in the auction data, or the volume of non-auction sales has fallen. The former is, I think more likely than the latter, because in a falling market, I would expect a smaller number of auctions to run, compared with private sales. And we know that the listing volumes, and time in market, as well as discounts made to close a sale are all rising.
So, I think we need to be very careful when using the auction data. There is potential for agents to withhold negative results, but no one knows the extent of this. There is also some evidence of double counting, but only at the margin. Sydney looks the most suspicious.
In terms of the calculations, there are various tweaks made to the numbers and the two sources of data we looked at came out with different results. The trends are most telling, and the momentum was easing, up to the end of last year. We have not had enough normal weeks since January to trend the more recent weeks, and the ABS data will not be out for several weeks. We will revisit this later in the year
The most telling data is the mapping, or lack of it between the transaction data from the ABS and the auction results. This suggests to me there are more questions to ask. I have put some questions in to the ABS to dig further into their datasets, but I am still waiting for a reply. I will update you when I hear back. My suspicion is that ABS uses data feeds from CoreLogic, but the relevant page which outlines this, and the various terms report a missing page – 404 error – on the ABS site. Not good.
So here is the bottom line, be cautious with these numbers, and remember they have no statutory authority, may be contaminated with partial data, and of course the “marketing” use of the data may pull against the quest for accuracy, especially remembering Domain’s links to Fairfax and its property related businesses.
So, my conclusion is, we are without a really good chart and compass, here, just as we are with the RBA data series. More noise in the system!
The weighted average preliminary clearance rate rose across a higher volume of auctions this week with 1,813 homes taken to market returning a 65.3 per cent success rate. The higher activity this week comes of the back of the Easter period slowdown which saw only 670 auctions held across the capitals and a 64.8 per cent final auction clearance rate.
Overall results by property type, saw 70 per cent of units selling at auction this week, which was higher than the combined house result which returned a 63.4 per cent clearance rate.
Across Australia’s two largest cities, Melbourne recorded an increase in both auction volumes and clearance rate week-on-week, with 69.6 per cent of the 720 homes selling at auction this week, increasing on last week’s 65.5 per cent final clearance rate when a much lower 152 auctions were held. In Sydney, 775 auctions were held this week returning a 67.1 per cent preliminary clearance rate, down on the 67.9 per cent last week when 394 auctions were held across the city.
All of the remaining auction markets saw an increase in auction activity this week, however the performance was varied, with Adelaide recording the highest success rate of 59.7 per cent, while only 33.3 per cent of auctions cleared in Tasmania.
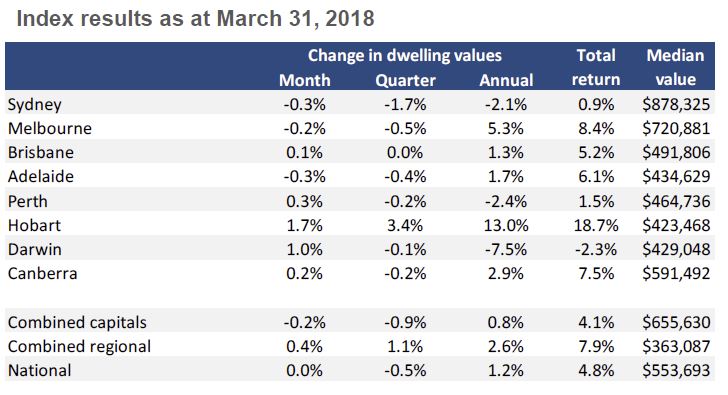
CoreLogic has released their March Index results. Their hedonic home value index showed national dwelling values were unchanged in March, with the steady month on month reading comprised of a 0.2% fall in capital city dwelling values while the combined regional markets saw values rise by 0.4%.
Trends across the March quarter showed that capital city home values were 0.9% lower over the March quarter, while values across the regional markets have tracked 1.1% higher. Focusing on the capital cities, six of the eight capital cities have recorded a fall in values over the first quarter of 2018, ranging from a 1.8% drop in Sydney values to a 0.1% fall in Darwin.
Sydney unit values are up 1.9% over the past twelve months, while house values are down 3.8%. Similarly in Melbourne, unit values are 6.6% higher over the past twelve months while house values are up just 4.9%.
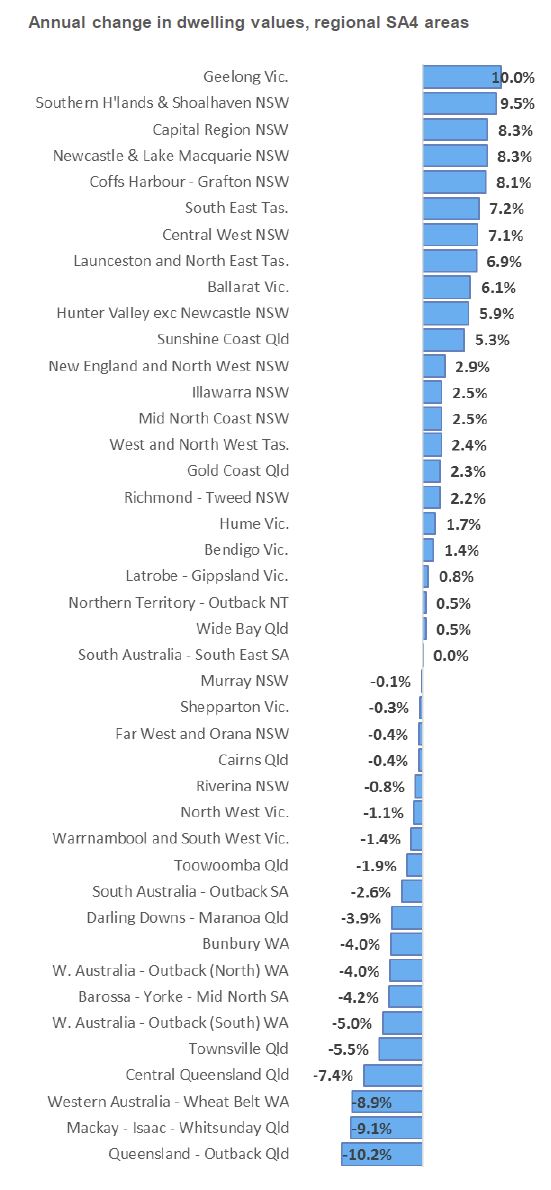
Movements were stronger in some regional centers, with Geelong the strongest over the past year, and Outback Queensland the weakest.
Corelogic says auction activity reaches its highest level not only over the year-to-date, but the highest volume of auctions ever recorded across the combined capital cities and Melbourne individually.
But the preliminary clearance rate is reported at 65.5% this week and will fall further, compared to 67.5% last week – which was subsequently revised down to 66.0%. Last year at the same time the result was 74.5%.
Something else to watch is the discounts to asking price, which we suspect is also rising, more data on this soon.
The pre- Easter week sees the number of homes taken to auction reach their highest level ever recorded, with a total of 3,967 auctions held across the combined capital cities exceeding the previous highest week on record over the week ending 30th November 2014 when 3,908 auctions were held.
The uplift in activity is what has historically been seen in the lead up to the Easter period slowdown, although compared to the pre-Easter week last year auction volumes were significantly lower than this week (3,517).
The weighted average preliminary clearance rate did shift slightly lower this week amid the higher activity, returning a 65.5 per cent success rate.
Across Melbourne, a total of 2,078 homes were taken to market across the city also making it a record busiest week in CoreLogic history; surpassing the previous record over the week ending 29th October 2017 when 1,983 auctions were held. The preliminary auction clearance rate fell however across the higher volumes, with 67 per cent of homes selling, down from the previous weeks 68.7 per cent.
A preliminary auction clearance rate of 66.2 per cent was recorded across Sydney this week, while volumes across the city reached a year-to-date high, with a total of 1,359 auctions held which was lower than what was seen over the pre-Easter week last year (1,436). Despite the increase in activity the preliminary clearance rate was second highest for the city this year.
Results across the smaller auction markets saw volumes increase across all remaining cities, however auction clearance rates returned varied results week-on-week.
Preliminary auction clearance rates soften as the number of auctions surges to the second busiest week so far this year.
There were 3,097 homes taken to auction across the combined capital cities this week, making it the second busiest week of the year so far, with preliminary results showing a 67.5 per cent success rate. In comparison, 1,764 auctions were held last week and the final clearance rate came in at 63.3 per cent. Over the same week last year, auction volumes were lower with 2,916 homes going under the hammer across the combined capital cities, although the clearance rate was a stronger 74.1 per cent.
In Melbourne, a preliminary auction clearance rate of 68.9 per cent was recorded across 1,656 auctions this week, down from 70.8 per cent across just 453 auctions last week. Over the same week last year, 1,441 homes were taken to auction across the city, returning a clearance rate of 77.0 per cent.
Sydney was host to 1,055 auctions this week, with preliminary results showing a 67.8 per cent success rate, up from 62.2 per cent across 974 auctions last week. This time last year, the clearance rate was a stronger 76.8 per cent across 1,001 auctions.
Excluding Tasmania, where all 3 reported auctions were successful, Adelaide recorded the highest preliminary clearance rate this week (69.7 per cent).
Looking at auction volumes, Perth was the only city to see a slight fall in the number of homes taken to auction this week, while all other cities increased week-on-week.
Capital city preliminary clearance rate rises to 67.3 per cent, with auction activity across the capitals significantly lower.
There were 1,721 auctions held across the combined capital cities this week, significantly lower than the 3,026 held last week, although higher than one year ago (1,473). The fall in auction volumes this week is due to the fact that four of the eight states and territories have a public holiday this coming Monday.
The preliminary clearance rate across the combined capital cities rose to 67.3 per cent this week, up from 63.6 per cent last week, although this will revise as more results are collected over the week. Over the same week last year, the clearance rate was recorded at 75.1 per cent.
The two largest auction markets, Melbourne and Sydney, saw their preliminary clearance rates rise, with Sydney at 66.6 per cent across 936 auctions and Melbourne at 72.2 per cent across 447 auctions, while the highest clearance rate was in Canberra where 77.6 per cent of auctions cleared over the week.
Looking at results by property type, units outperformed houses again this week with 70.0 per cent of units selling at auction, while 66.0 per cent of houses sold across the combined capital cities.


 Finally, we can look at the national picture, which tells a similar story.