The Election’s Effect on Expected Inflation

From St. Louis Fed Blog.

Expected inflation rose steadily throughout 2016 and had a relatively large gain during the week of the U.S. elections. What does this mean and why is it important?

The Rise of Expected Inflation

The breakeven rate is the difference between the benchmark Treasury rate and its corresponding inflation-protected security rate. It is used as a market measure of expected inflation. For example, the difference between the 10-year constant maturity Treasury note and the 10-year inflation-protected Treasury note on Nov. 4 was 1.7 percent. This means that investors expect inflation to be around 1.7 percent over the next 10 years.

Over the period Nov. 4-11, the 30-year breakeven rate rose by 10 basis points, while both the 10-year and five-year breakeven rates rose by 8 basis points. By the last week of 2016, breakeven rates were inching closer to the Fed’s longer-run target of 2 percent inflation:1

  • The 30-year breakeven rate was 2.07 percent.
  • The 10-year rate was 1.97 percent.
  • The five-year rate was 1.85 percent.

The Election’s Effect on Expected Inflation

Though unexpected by most, the election results in early November delivered a positive shock to U.S. financial markets overall. Market expectations shifted with the anticipation of aggressive fiscal policy changes, including higher infrastructure spending, financial deregulation and major tax reforms. If these policy changes materialize, they could lead to higher productivity, higher growth rates and a quicker pace of inflation.

However, they could also lead to higher than anticipated levels of U.S. government debt and a growing deficit. Along with recent announcements of major oil-producing countries curbing production to reduce excess supply of oil and help push oil prices higher, speculation around these policies has reinforced expectations of higher inflation.

Despite historically low interest rates, and particularly after the steep decline in energy prices at the end of 2014, headline inflation in the U.S. has remained below the Fed’s target rate of 2 percent, as seen in the figure below.


Inflation expectations also declined below 2 percent toward the end of 2014. However, their rise during the last six months of 2016 is a sign suggesting future inflation is expected to be around the Fed’s target rate. At this point, which policies will come to fruition and their impact on the economy remains to be seen.

Notes and References

1 It’s important to note that the Fed’s inflation target is based on the personal consumption expenditures price index, while inflation-protected Treasuries rely on the consumer price index.

How Best To Measure Owner Occupiers Housing Costs

Within the CPI, the costs of housing are included. But as a recent article from the UK’s Office for national statistics shows, this is not straight forward.

Owner occupiers’ housing costs (OOH) are the costs of housing services associated with owning, maintaining and living in one’s own home. There is not a single defined measure of OOH because they can be calculated differently depending on what the target is.

In particular, should OOH be measured at the point of acquisition of the housing service (for example, the net acquisitions approach – NA), the point of use (for example, the rental equivalence approach – RE), or the point at which it is paid for (for example, the payments approach)? Each of these 3 approaches has its own specific methodological strengths and weaknesses, and is measured using different methods.

Although each of the methods measure different aspects of OOH and are therefore not comparable, it is still useful to look at the 3 measures together to see how they differ over time.

The fact that OOH(RE) does not directly follow house prices is not a disadvantage to using the rental equivalence approach in the calculation of the owner occupier’s housing costs component. This is because the rental equivalence approach aims to measure the housing services that are consumed each period, and therefore there is no reason why it should follow the trend of house prices.

The CPI rose 0.7 per cent in the September quarter 2016

The Consumer Price Index (CPI) rose 1.3 per cent through the year to September quarter 2016, according to the latest Australian Bureau of Statistics (ABS) figures. This is a rise from 1% last time, and higher than expected. However much of the rise is a reaction to recent bad wealth with the prices of fruit and vegetables higher. This is a temporary effect.

Nevertheless, the RBA trimmed mean remains at 1.7%, and probably means no rate cut in the near future.

The CPI rose 0.7 per cent in the September quarter 2016. This follows a rise of 0.4 per cent in the June quarter 2016. This quantum is towards the higher end of expectations.

cpi-sept-2016-trend-statesSydney had the highest movement at 1%. Housing, and furnishings helped to lift the number here, as well as rising fruit and vegetables prices.

cpi-sept-2016-last-qNationally, the most significant price rises this quarter are fruit (+19.5 per cent), vegetables (+5.9 per cent), electricity (+5.4 per cent) and tobacco (+2.3 per cent). These rises are partially offset by falls in communication (-2.3 per cent) and fuel (-2.9 per cent).

cpi-sept-2016-mixThe rise in fruit and vegetable prices is due to adverse weather conditions, including floods, in major growing areas, impacting supply.

Inflation subdued in the June quarter 2016

The Consumer Price Index (CPI) rose 0.4 per cent in the June quarter 2016, according to the latest Australian Bureau of Statistics (ABS) figures.

The RBA will probably take this as a signal to cut the cash rate again next week, despite the fact that evidence is mounting that rate cutting at these low interest rate levels will not help much, and create a problem down the track. In fact we should ask if a 2-3% target for inflation is meaningful anymore. Worth reading Mark Carney, Governor, Bank of England comments on this subject. Low inflation appears to carry significant risks, and low interest rates do not help.

CPI-2016-JunThis follows a fall of 0.2 per cent in the March quarter 2016.

The most significant price rises this quarter are in medical and hospital services (+4.2 per cent), automotive fuel (+5.9 per cent) and tobacco (+2.1 per cent). These rises are partially offset by falls in domestic holiday travel and accommodation (–3.7 per cent), motor vehicles (–1.3 per cent) and telecommunication equipment and services (–1.5 per cent).

The increase of 4.2 per cent for medical and hospital services was driven by the annual increase in Private Health Insurance (PHI) premiums, which rise on 1 April every year.

The increase of 5.9 per cent for automotive fuel follows three consecutive quarterly falls, with the rise driven by increases in unleaded, premium and ethanol fuels, as world oil prices increased from a 12-year low last quarter.

The CPI rose 1.0 per cent through the year to the June quarter 2016. This is the weakest annual rise since the June quarter 1999.

There are interesting state variations, with Brisbane recording 1.5 per cent, and Darwin 0 per cent this time.

June-2106-State-CPI


Consumer Price Index falls 0.2 per cent

The Consumer Price Index (CPI) fell 0.2 per cent in the March quarter 2016 according to latest figures from the Australian Bureau of Statistics (ABS).

This follows a rise of 0.4 per cent in the December quarter 2015.

The CPI rose 1.3 per cent through the year to the March quarter 2016, following a rise of 1.7 per cent through the year to the December quarter 2015.

The fall in the CPI this quarter was broad based, with six out of the eleven CPI groups recording a fall for the quarter.

The most significant fall occurred in transport (–2.5 per cent), due to automotive fuel (–10.0 per cent) falling for the third consecutive quarter.

Recreation and culture (–1.0 per cent) was the second most significant contributor, with falls in both international holiday travel and accommodation (–2.0 per cent) and domestic holiday travel and accommodation (–1.9 per cent).

Food and non–alcoholic beverages (–0.2 per cent) also fell this quarter, with fruit (–11.1 per cent) providing the most significant contribution.

These falls were partially offset by rises in secondary education (+4.6 per cent), medical and hospital services (+1.6 per cent) and pharmaceutical products (+4.8 per cent).

CPI December quarter 2015 rises 0.4 per cent

The latest Australian Bureau of Statistics (ABS) figures show the Consumer Price Index (CPI) rose 0.4 per cent in the December quarter 2015, following a rise of 0.5 per cent in the September quarter 2015.

The most significant price rises this quarter were in tobacco (+7.4 per cent), domestic holiday travel and accommodation (+5.9 per cent) and international holiday travel and accommodation (+2.4 per cent). These rises were partially offset by falls in automotive fuel (–5.7 per cent), telecommunication equipment and services (–2.4 per cent) and fruit (–2.6 per cent).

The increase of 0.1 per cent for the housing group is the weakest movement since March quarter 1998 as price rises for rents (+0.2 per cent) and new dwelling purchase by owner occupiers (+0.1 per cent) have been subdued through the quarter. The 0.1 per cent rise for new dwellings purchase by owner occupiers is the weakest movement since March quarter 2014.

The CPI rose 1.7 per cent through the year to the December quarter 2015, following a rise of 1.5 per cent through the year to the September quarter 2015.

CPI September quarter 2015 rises 0.5 per cent

The latest Australian Bureau of Statistics (ABS) figures show the Consumer Price Index (CPI) rose 0.5 per cent in the September quarter 2015, following a rise of 0.7 per cent in the June quarter 2015.

The most significant price rises this quarter were in international holiday travel and accommodation (+4.6 per cent), fruit (+8.2 per cent) and property rates and charges (+4.6 per cent), These rises were partially offset by falls in vegetables (–5.9 per cent), telecommunication equipment and services (–2.0 per cent) and automotive fuel (–1.7 per cent).

The CPI rose 1.5 per cent through the year to the September quarter 2015, following a rise of 1.5 per cent through the year to the June quarter 2015.

CPI-Sept-2015Underlying inflation, using the mean trimmed data, is still within the RBA 2-3% target band, so there is no reason to expect an interest rate cut on this measure in November.

Mean-Inflation-Sep-2015

CPI June Quarter 2015 Rises 0.7 per cent – ABS

The ABS released the latest CPI data. The Consumer Price Index (CPI) rose 0.7 per cent in the June quarter 2015, following a rise of 0.2 per cent in the March quarter 2015.

CPI-to-Jun-2105This translates to an annual CPI of 1.5 per cent through the year to the June quarter 2015, following a rise of 1.3 per cent through the year to the March quarter 2015.

Underlying inflation is still in the 2-3% RBA target range, so there would be no impact of potential cash rate movements.

Underlying-Inflation-June-2015
The most significant price rises this quarter were in automotive fuel (+12.2 per cent), medical and hospital services (+4.5 per cent) and new dwelling purchase by owner–occupiers (+1.5 per cent), These rises were partially offset by falls in domestic holiday travel and accommodation (–5.4 per cent) and pharmaceutical products (–1.8 per cent). The increase in fuel is registered in four of the five fuel types with the quarterly rise the largest since December 1990.

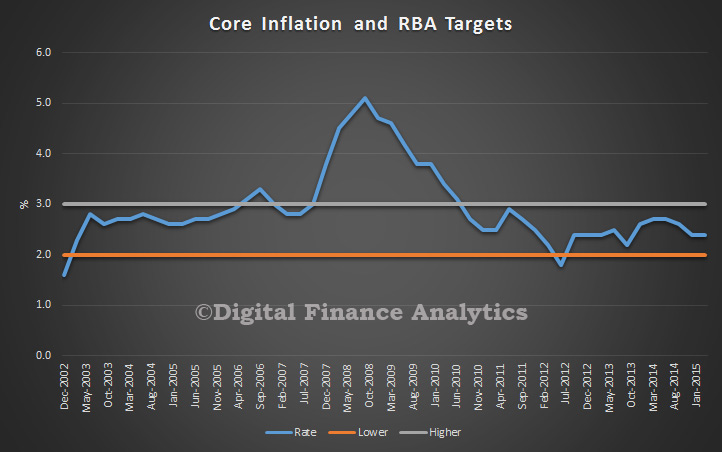
Core CPI Right In RBA Target Range

The Consumer Price Index (CPI) rose 0.2 per cent in the March quarter 2015, following a rise of 0.2 per cent in the December quarter 2014, according to data released by the Australian Bureau of Statistics (ABS) today. The CPI rose 1.3 per cent through the year to the March quarter 2015, following a rise of 1.7 per cent through the year to the December quarter 2014. The reading is flattered by a significant fall in fuel.

The underlying rate was 2.4%, right within the RBA target range, a little higher than expected, and as such it will more than likely tip the RBA in “hold” territory next month, when coupled with better than expected previous employment data, and hot Sydney property. Moreover, little evidence that a further cut would change the picture much (other than reducing savers ability to spend).

CPICoreApril2015
The most significant price rises this quarter were in domestic holiday travel and accommodation (+3.5 per cent), tertiary education (+5.7 per cent) and medical and hospital services (+2.2 per cent), These rises were partially offset by falls in automotive fuel (—12.2 per cent) and fruit (—8.0 per cent). The decrease in fuel was registered in all fuel types with the quarterly fall the largest since December 2008 and over the twelve months to March 2015, automotive fuel has decreased by 22.5 per cent. This is the largest yearly fall in the history of the series, beginning in September 1973.

CPI Down To 1.7%

According to the ABS, the Consumer Price Index (CPI) rose 0.2% in the December quarter 2014, following a rise of 0.5% in the September quarter 2014. The CPI is trending down at the moment.

CPI-Dec-2014-ALL

The most significant price rises this quarter were for domestic holiday travel and accommodation (+5.8%), tobacco (+4.8%) and new dwelling purchase by owner-occupiers (+1.1%), These rises were partially offset by a fall in automotive fuel (–6.8%). Global oil markets continue to experience oversupply, which resulted in continued falls in oil prices. In Australia, average unleaded petrol prices reached a low of $1.17 per litre in December 2014, the lowest recorded average daily price since February 2009.

The CPI rose 1.7% through the year to the December quarter 2014, following a rise of 2.3% through the year to the September quarter 2014.

The fall in CPI may stimulate calls for the RBA to cut rates, but given that oil price falls already acts as a quasi rate cut, DFA believes a further cut in official rates is not required. The lower dollar and stable unemployment data also suggests there is no need for cuts, indeed, the next movement should be upwards.