Non Bank Home Lending Rising

The RBA released their credit aggregates to end January 2019 today, and the data confirms that lending growth continues to slow across home lending and personal credit.

We will get to the detail shortly, but I want first to head to a comparison between the APRA data for the banks, also released today, and the total credit from the RBA.

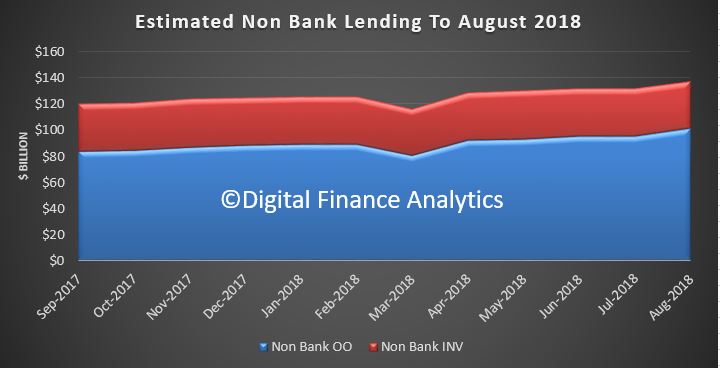
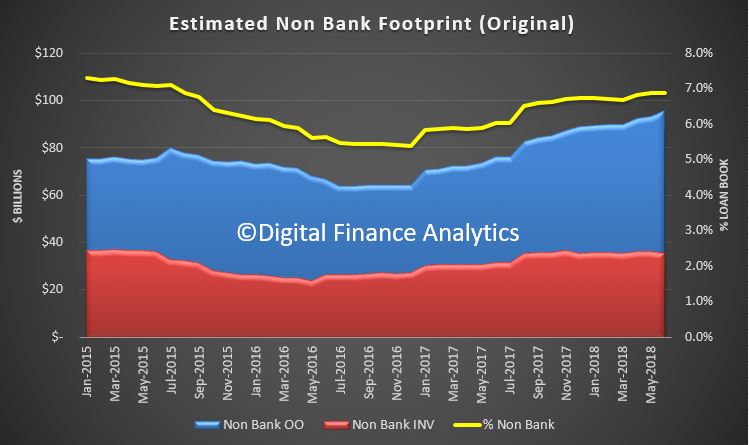
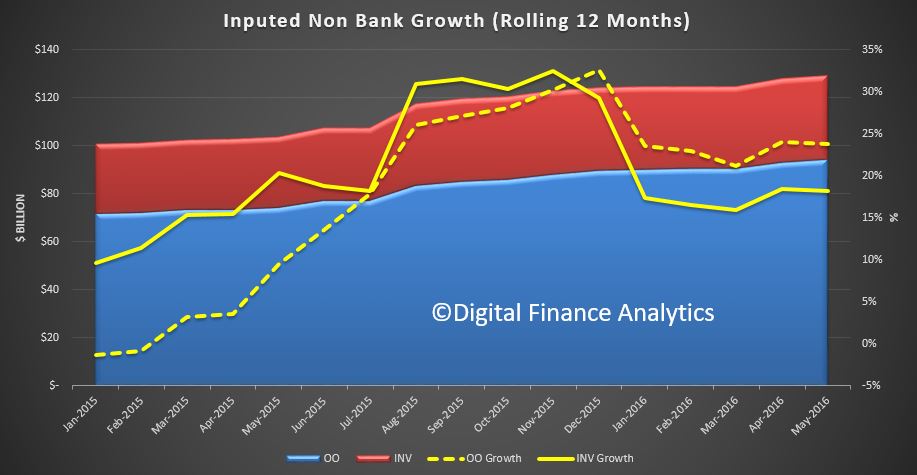
The gap between the two relates to the non-bank sector, and the fact is, despite all the funnies in the numbers, lending from the non-bank credit sector is booming. Owner occupied non-bank lending is growing at an annualised rate of 17.2% and lending for investment housing is 4%. Both well above the bank sector. This is unsurprising, given the different funding arrangements, and restrictions between the banks and non-banks. Of course both have responsible lending obligations, but evidence suggests non-banks are more willing to lend, at a price. APRA sort of has responsibility for the non-bank sector, but do not seem to be doing much to stem the tide.

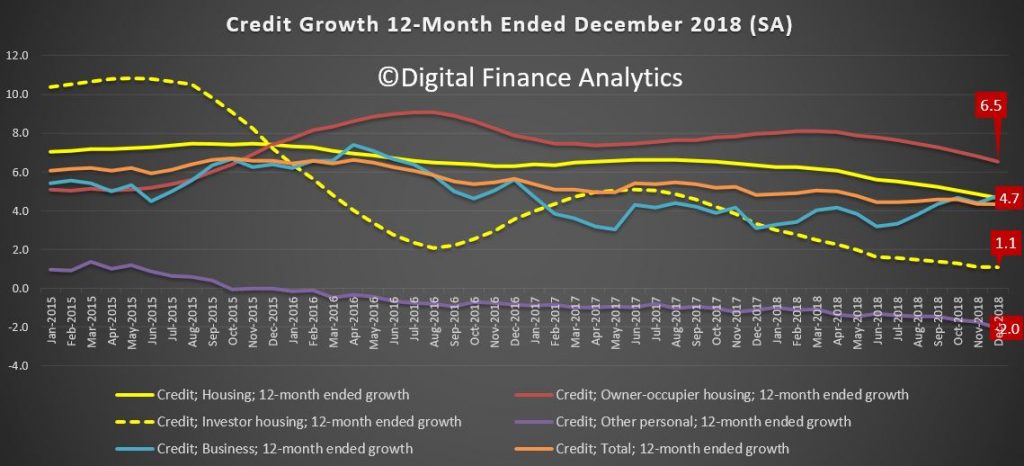
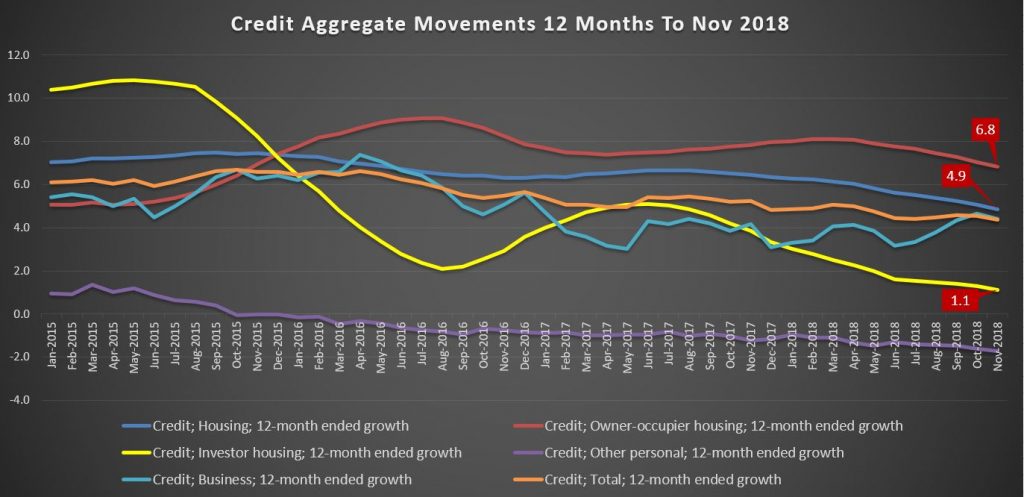
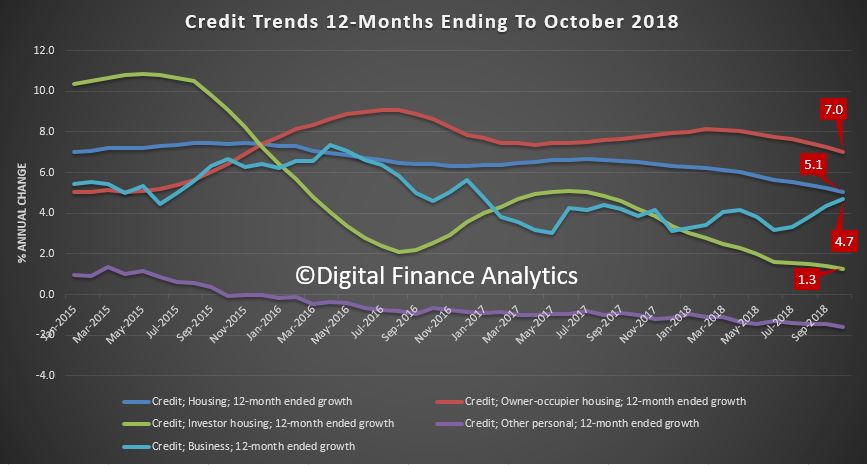
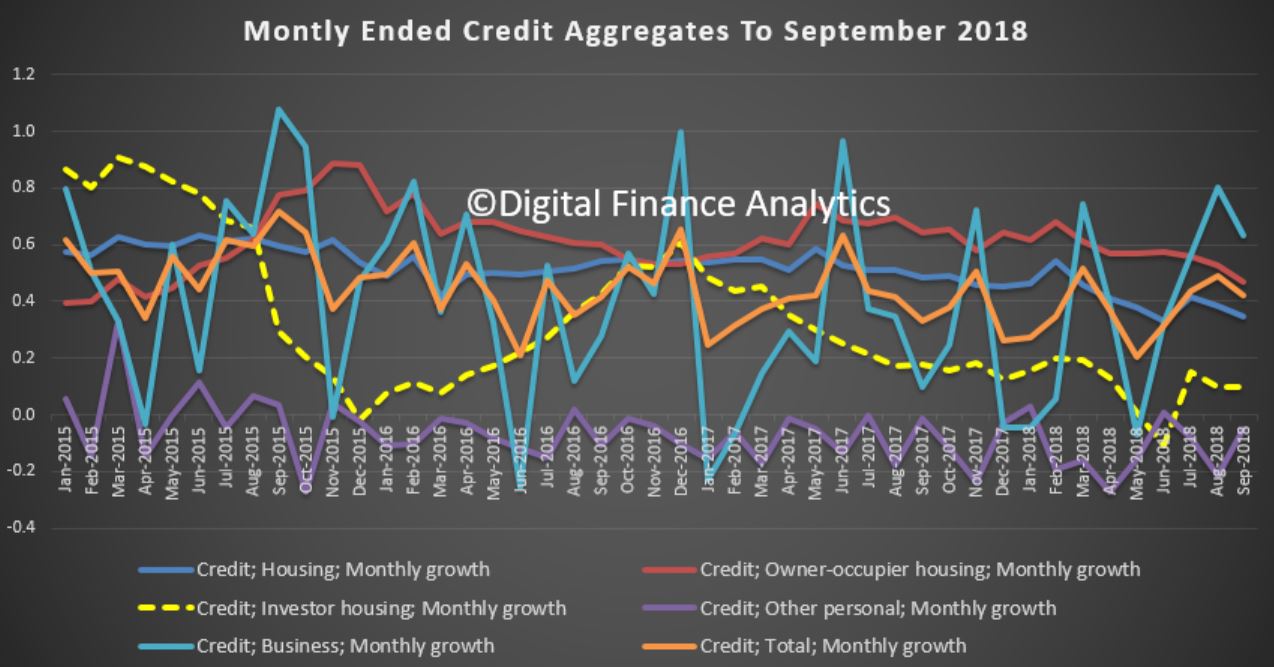
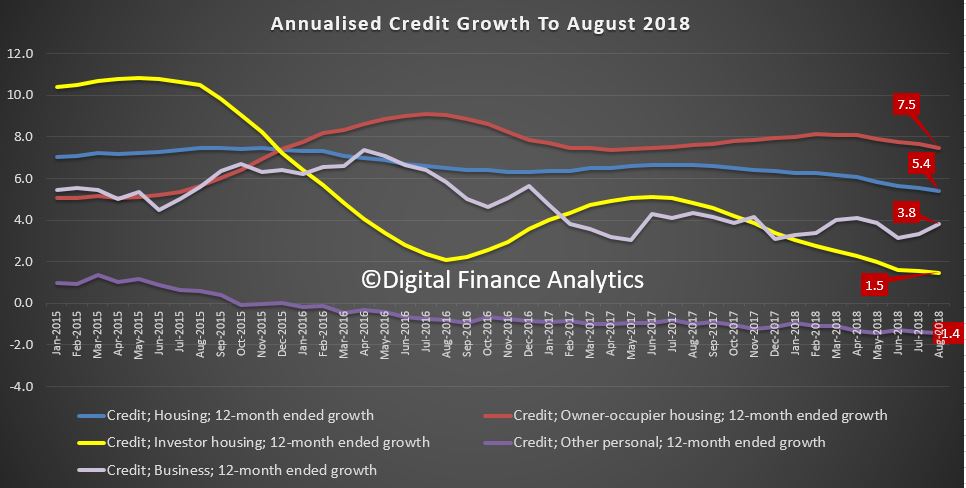
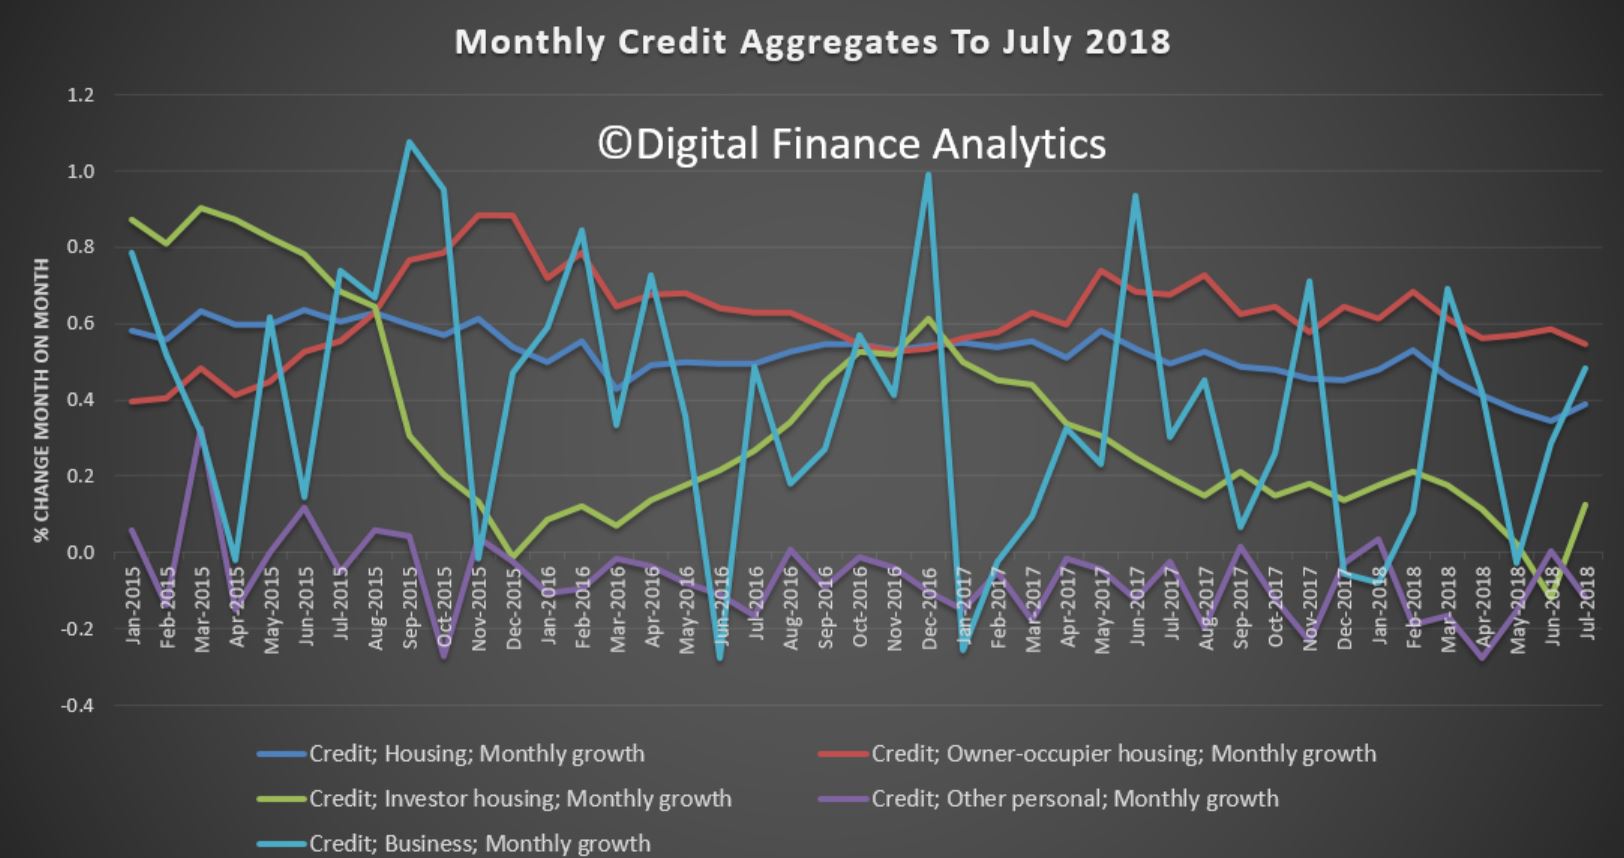
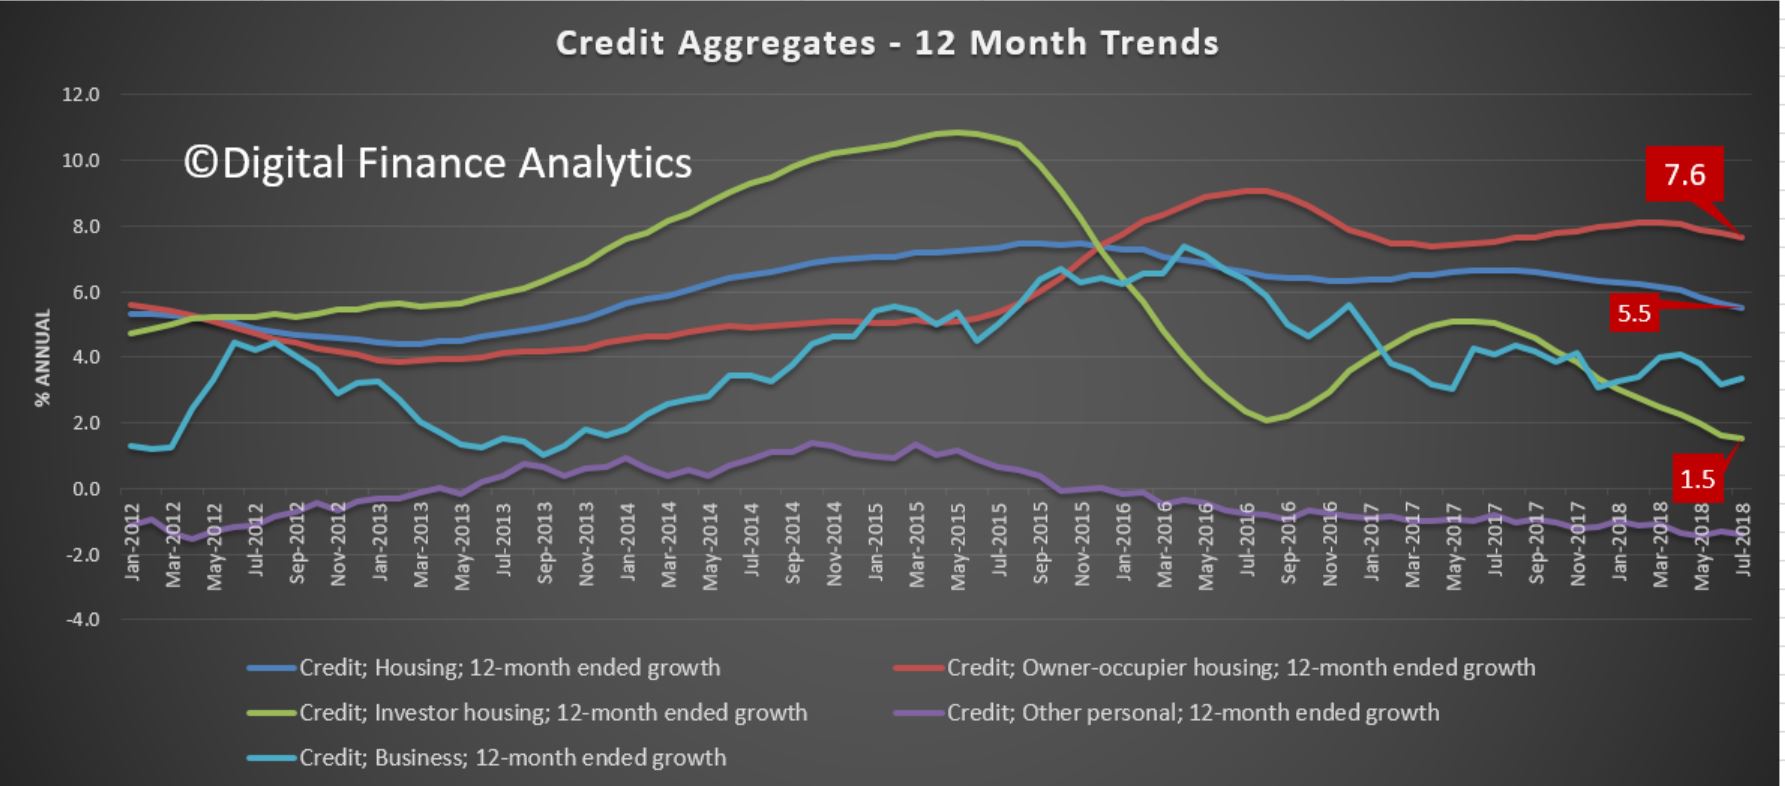
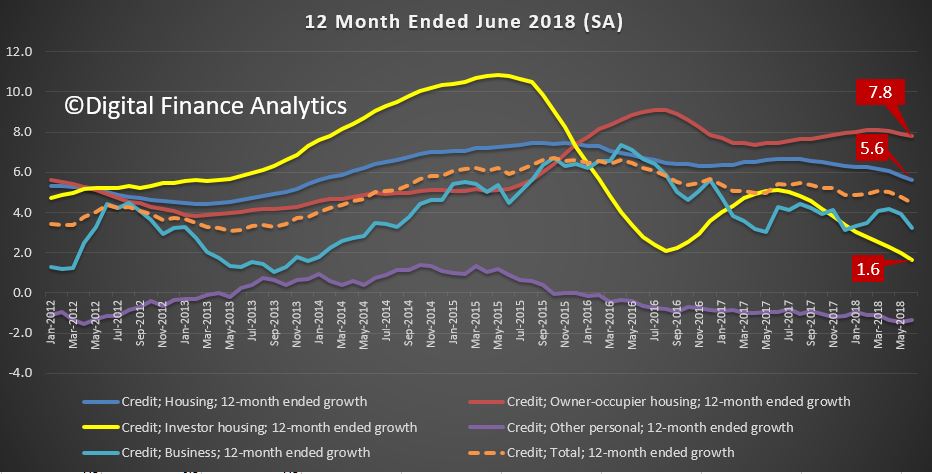
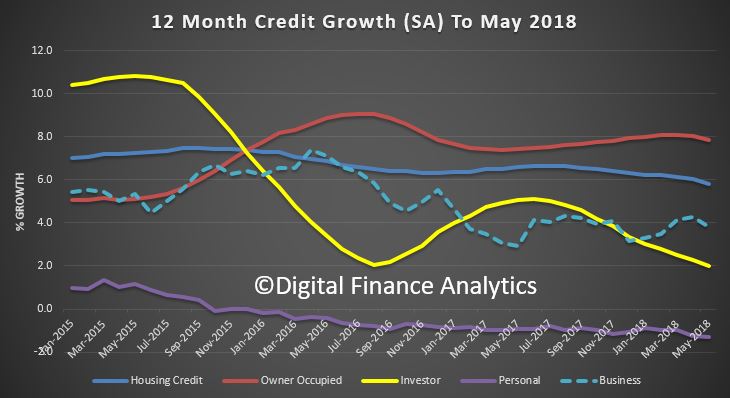
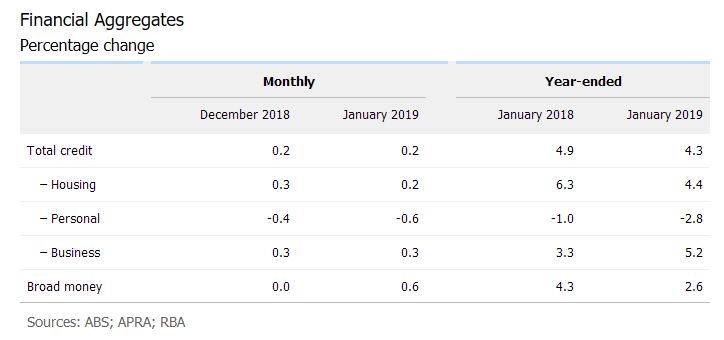
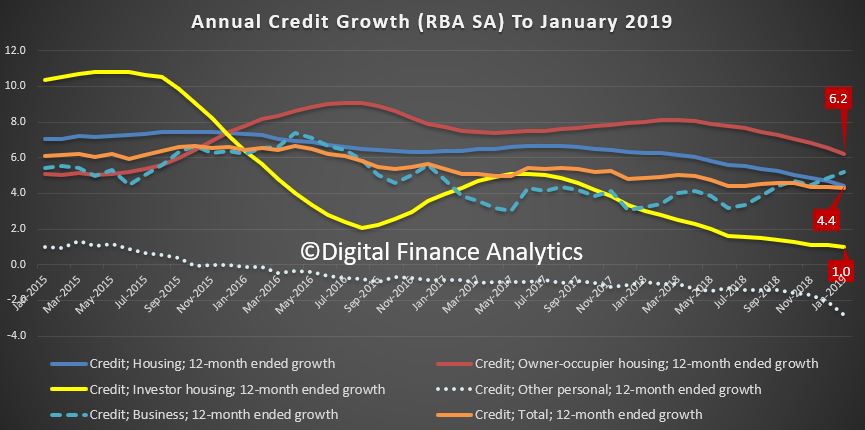
Meantime, the RBA lending aggregates shows that annual owner home lending now stands at 6.2%, investment lending at 1% and overall credit growth is 4.4%. There was a considerable drop off in personal credit, and a rise in business lending.

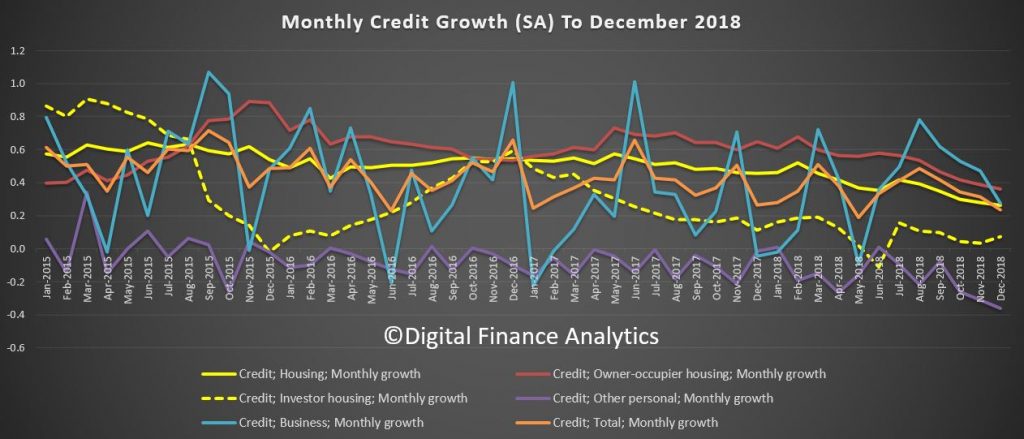
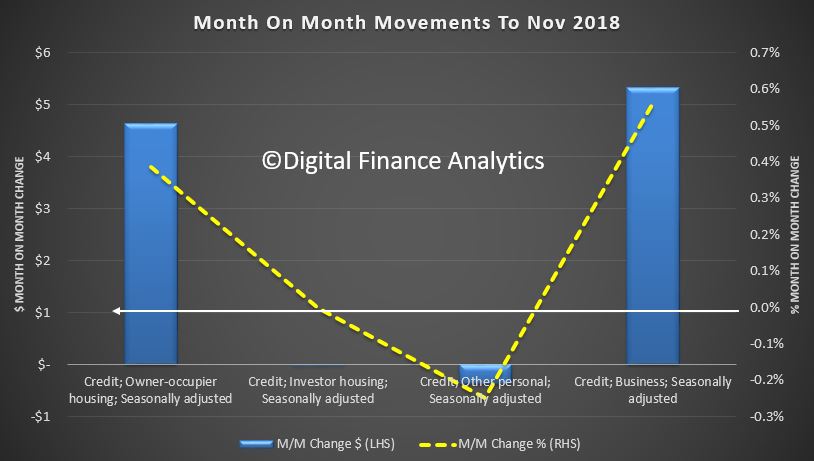
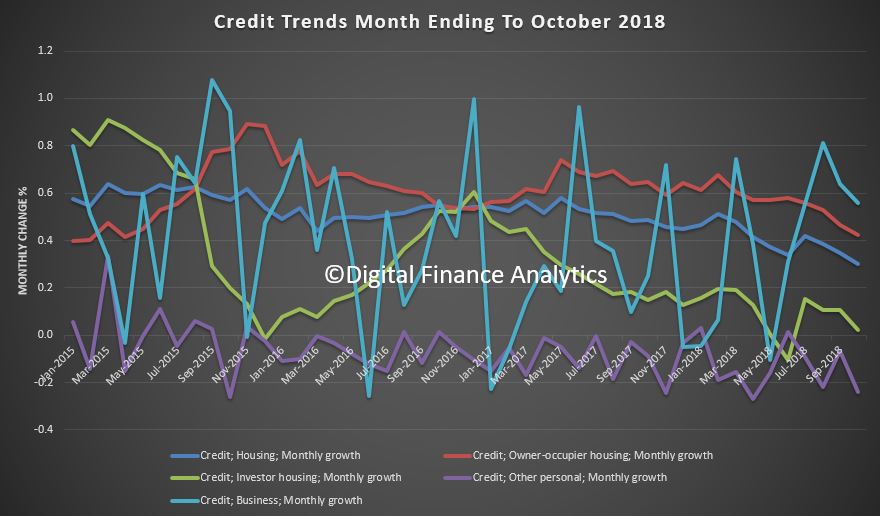
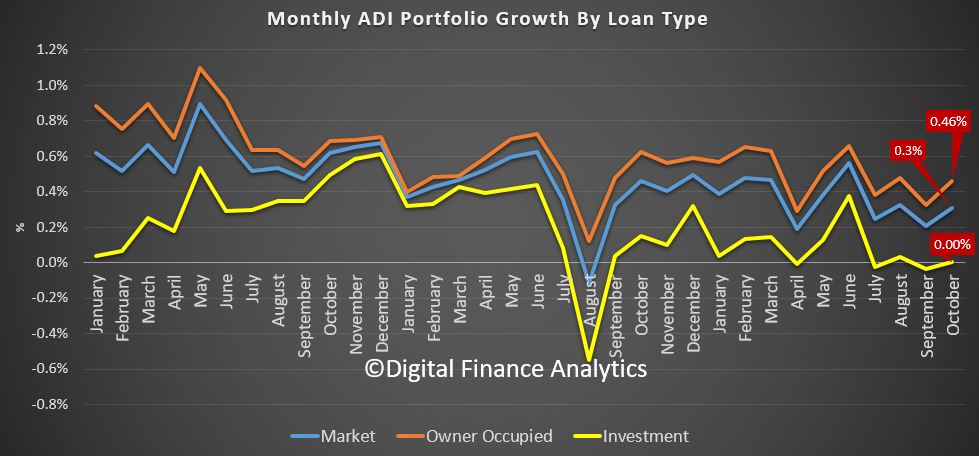
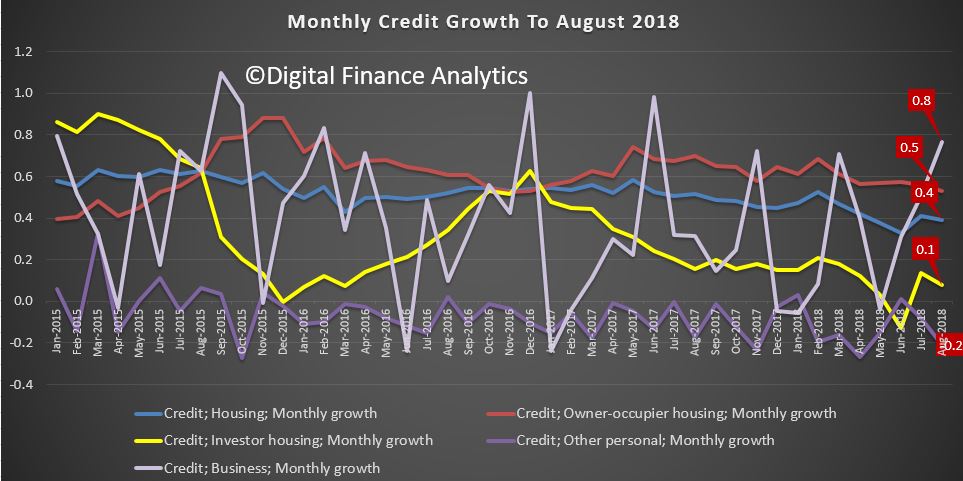
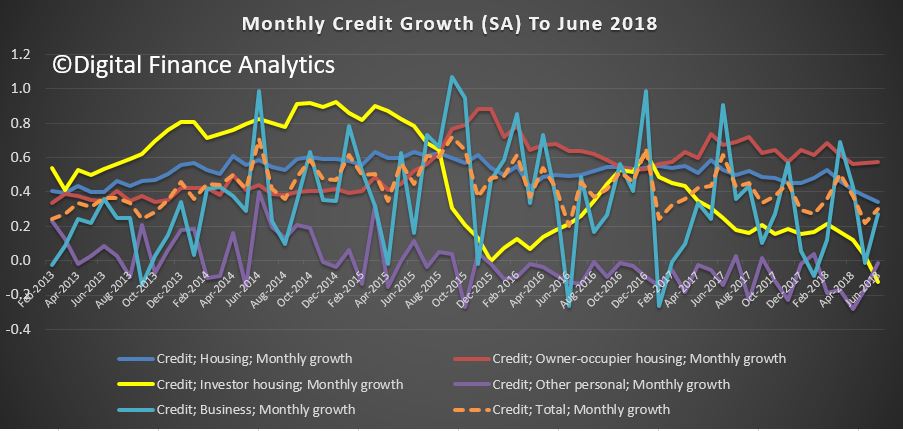
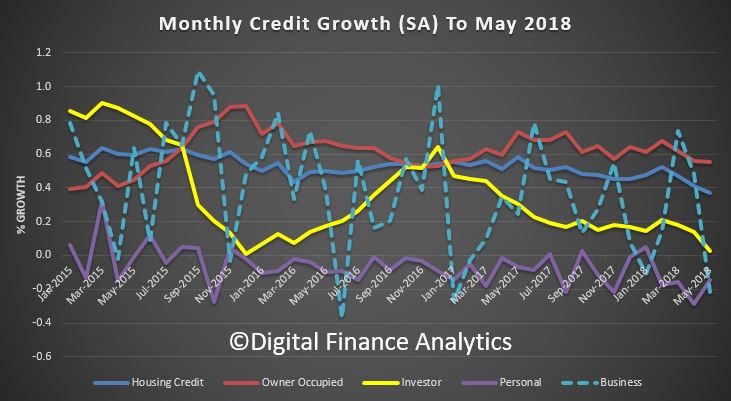
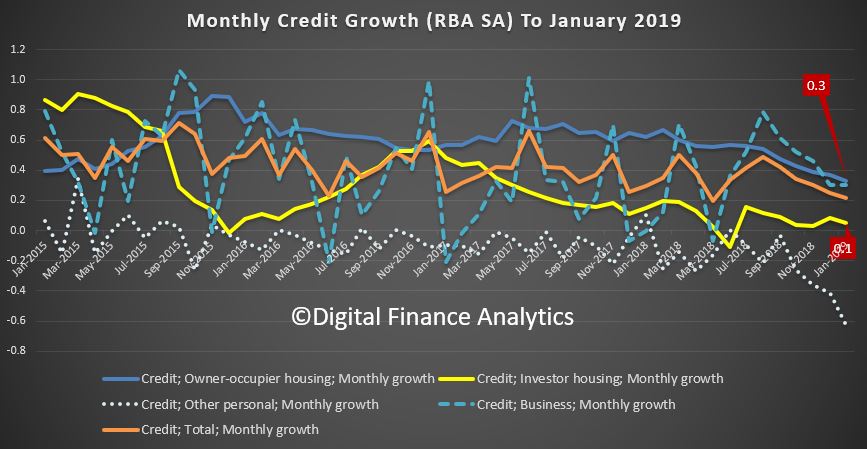
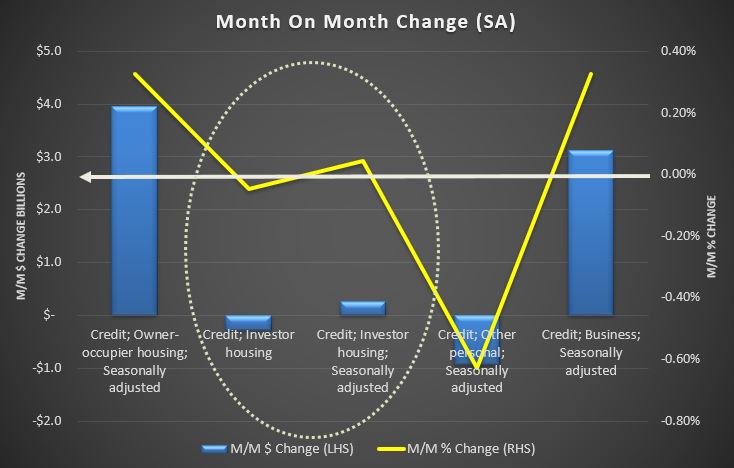
The monthly trends are more noisy, as expected.

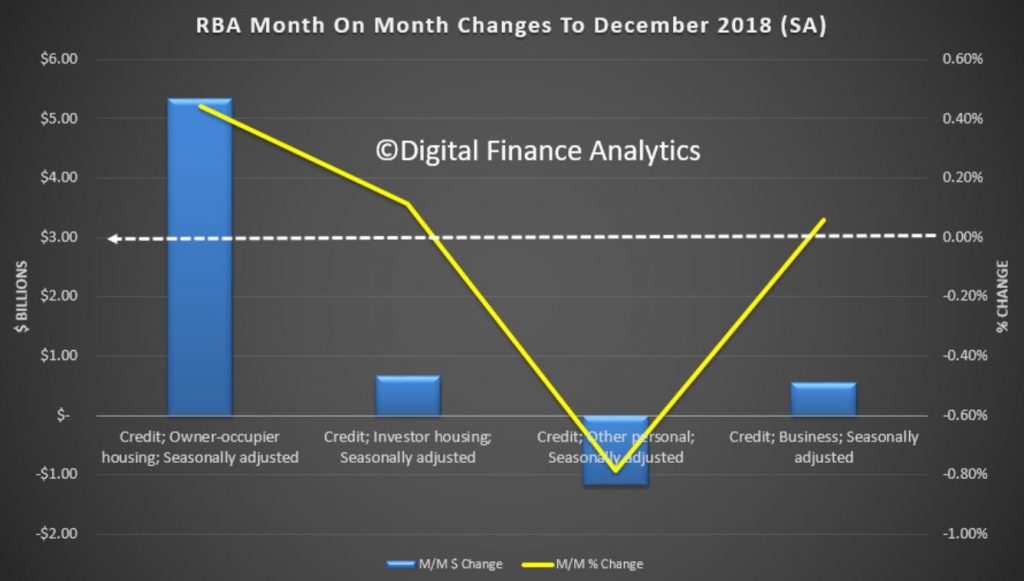
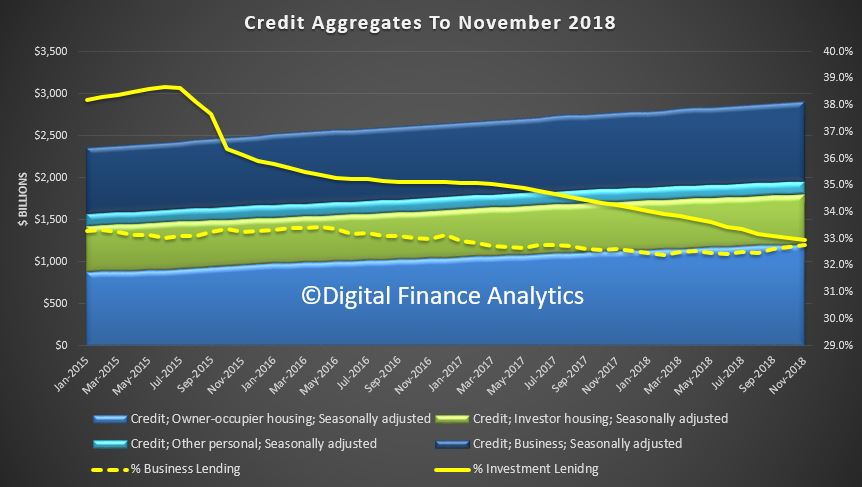
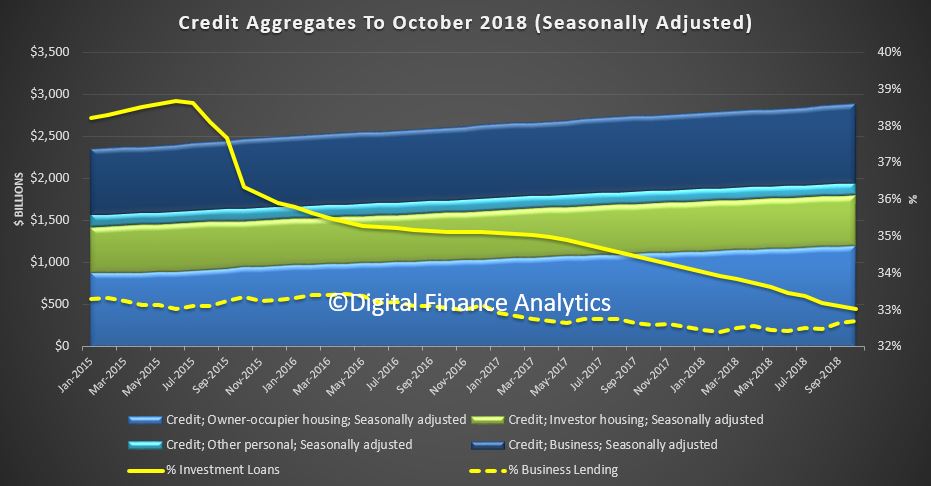
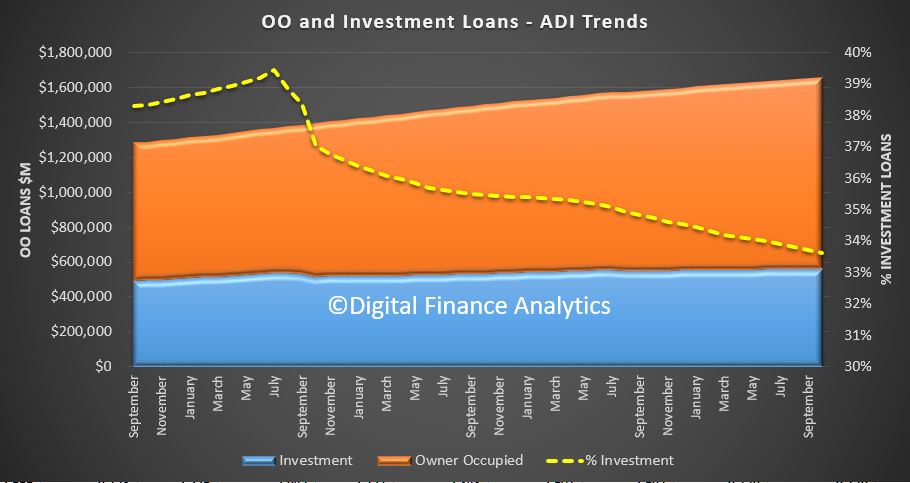
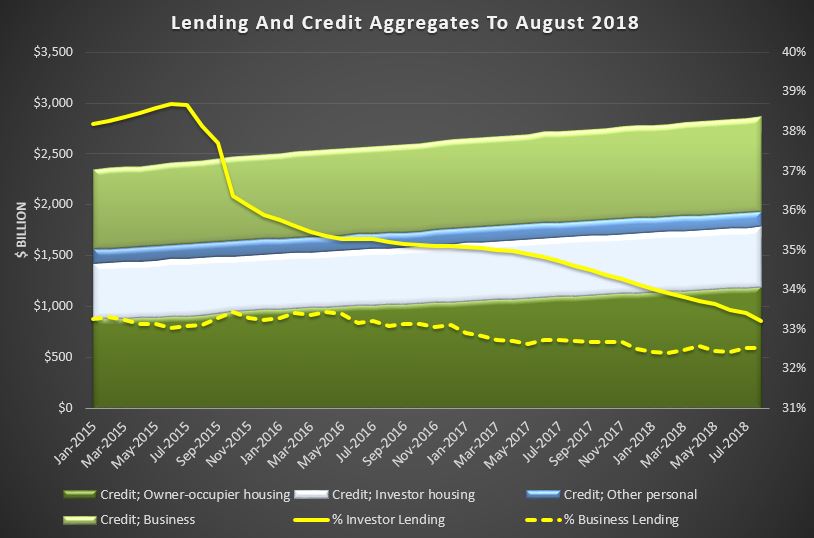
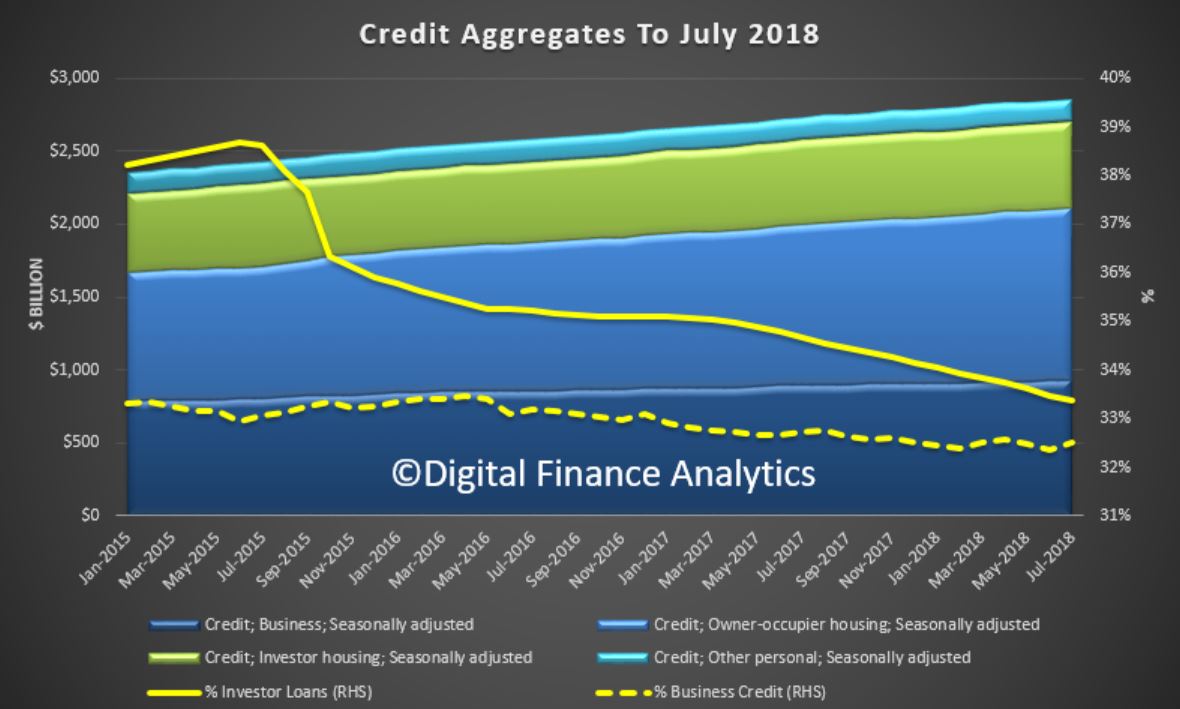
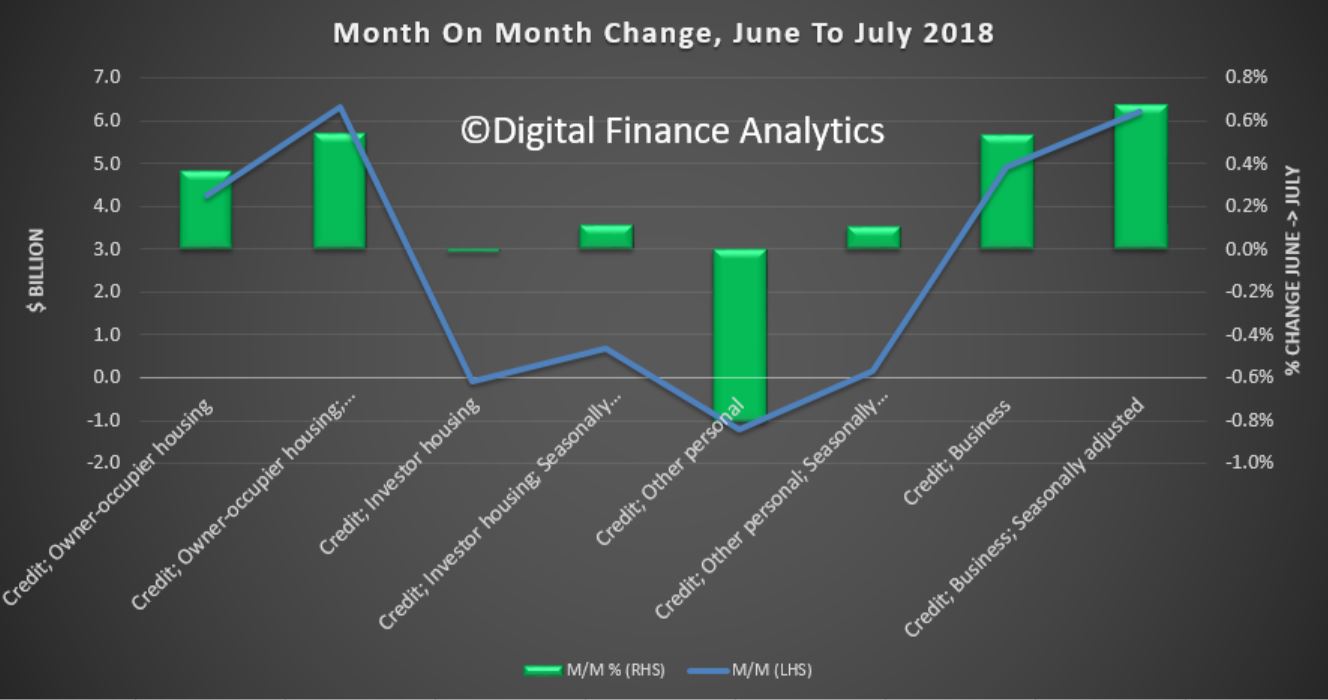
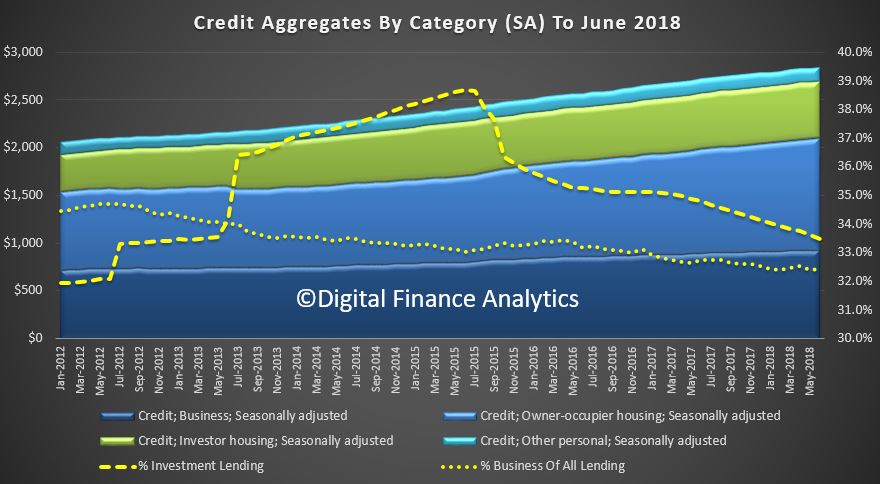
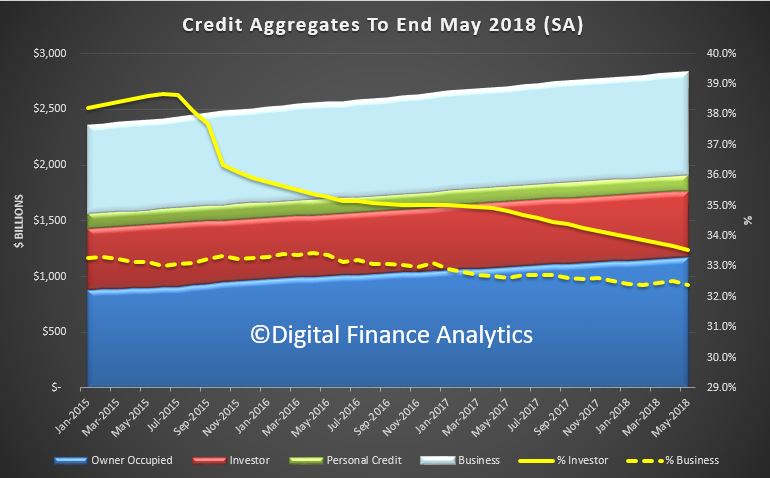
Turning to the credit stock, and using the seasonally adjusted figures, we see that overall credit still advanced. Total loans for owner occupation rose by $4 billion dollars to $1.22 trillion dollars, up 0.33% while loans for investors rose $0.3 billion seasonally adjusted to $594.6 billion dollars, up just 0.04%. Investment loans were 32.8% of the total, down slightly from last month.

Business credit rose by $3.1 billion to $956 billion, up 0.33% and comprised 32.8% of all lending, up a little from last month.

Personal credit fell by $0.9 billion dollars to $147.5 billion, down 1.15%,

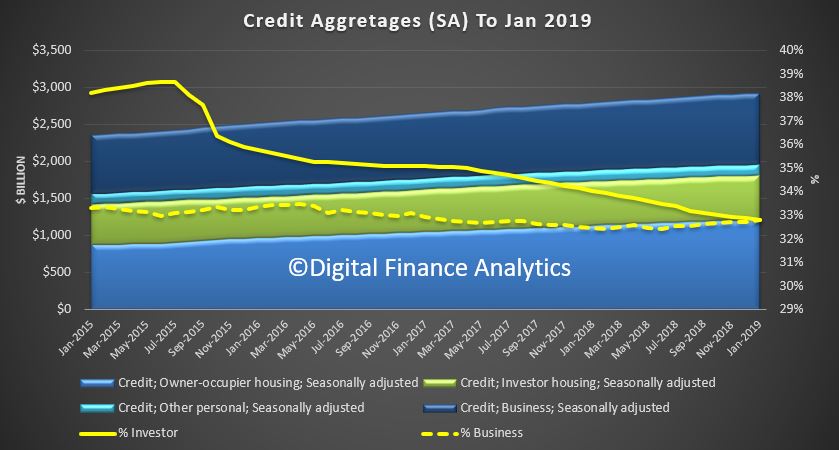
Its also worth noting the seasonally adjusted figures overstates the investment lending by a net $0.6 billion dollars.

To me the slowing credit impulse is clear, as is the worrying rise in non-bank lending. Adopt the brace position!

RBA Says Credit Hits New High, But Growth Is Lower Again

The December 2018 data from the RBA has been released today, and credit growth continues to slow, led down by both housing and business finance. That said total credit is still expanding, and housing credit reached a new record, $1.8 trillion dollars. Within that Owner occupied loans were reported at $ 1.21 trillion dollars and Investment loans $0.59 trillion, accounting for 32.9% of all housing lending. Credit to business was up a little to 32.8% of all lending stock. Personal credit shrank again.

The share of lending for housing investment fell again, while the business mix was up just a little.

Total credit for housing was an annualised 4.7% compared with 6.3% a year ago. Personal credit was down again, to -2.0% over the past year, compared with -1.1% a year before, and business credit was at 4.8% compared with 3.1% a year back.

Within the housing sector, home lending for investment purposes was at 1.1% and for owner occupation a (still massive) 6.5%. Still way higher than inflation and wages, so household debt ratios will continue to deteriorate.

The monthly movements show a fall in business lending momentum and owner occupied lending, though a small uptick in investor loans, if from a low base.

The APRA data is also out today, so we will look at this later… But we can conclude the overall growth in housing lending is still building more risks in the market, despite all the hype. Credit loosening should be resisted.

The Debt Machine Is Alive And Well

As we approach the end of the year, we got some stats from the RBA on credit to the end of November. Whilst the debt is growing the value of the housing assets are falling, this is a nasty pincer movement!

Their credit aggregates reveals that in seasonally adjusted terms total credit rose by 0.34% or $9.9 billion dollars, to a new record of $2.9 trillion dollars.

Within that credit for owner occupied housing rose 0.38%, or $4.63 billion to a new record $1.21 trillion dollars, lending for property investment was flat, standing at $0.59 trillion dollars and lending for business rose 0.56%, or $5.32 billion to $0.95 trillion dollars, another record. The proportion of business lending to all lending rose to 32.8%, while the share of residential property lending for investment property fell to 32.9%, the lowest in years (but still too high in my book!). Credit growth is too fast.

The trend charts show that on a 12 month basis, investment lending has now only growth 1.1%, while owner occupied lending is still running at 6.8%, still faster than business lending. Personal credit continues to fall.

This indicates that despite all the hype about tight lending, loans are still being written, at a growth rate which is well above inflation and income. As a result the total debt burden is still rising. RBA please note.

We can see the consequences working out by looking at the latest Household Finance Ratios from the RBA, using ABS data

This shows that total household debt to income to September 2018 fell from 189 to 188.6, whilst the housing debt to income rose from 139.4 to 139.6 and the owner occupied ratio rose from 107.4 to 108.4. Now this ratio includes households and unincorporated businesses – small businesses essentially. So we see the continued consolidation of debt around housing, while other forms of debt, such as credit cards, diminished. In fact, the change quarter on quarter for owner occupied housing debt is close to 1%, so have no doubt, debt relative to income for housing is still rising.

The assets to income data in the same series fell, thanks to the fall in value of housing.

The ratio of household assets to income fell from 956.0 to 950.8, the ratio of housing assets to income fell from 517.3 to 508.4, down 1.7% in the quarter and  2.7% for the year to date, while the ratio of financial assets (stocks etc.) lifted from 410.3 to 414.5 (though will be lower now thanks to the recent market falls). In other words, whilst the debt is growing the value of the housing assets are falling – a double whammy.

The final dimension is interest payments to debt, both of which are higher (thanks to bigger loans and only small changes in mortgage rates).

The ratio of housing debt interest repayments to income rose from 7.4 to 7.5 per cent and interest payments on all debt rose from 9.0 to 9.1 percent.  This is confirming the growth trend since 2016, where the out of cycle interest repayments hit.

The point to note here is that the one third of households with mortgage debt are seeing a rise in the share of income going to support the interest repayments – at these extremely low, emergency interest rates. And that is the point, the averages mask the marginal borrower who remains under extreme pressure, which is why mortgage stress continues to rise. We will report on the December data in a week or so.

So the key take away as we move into 2019 is the debt machine is still working, more households are being encouraged to get deeper into debt, despite the clear evidence of massive over borrowing. A strategy applauded by the RBA, the Treasury and the Banks!

We really need a change in strategy because debt fueled household consumption and property speculation will be one of the nails in the economies coffin down the track. Interest rates will rise. The other is sporty corporate borrowing, but that is a story for another day!

Finally, seasons greetings to all our followers, and our best wishes for (a debt free) 2019!

The Credit Impulse Weakens Further In October

The RBA and APRA both released their statistics today to end of October. The data clearly shows the mortgage flows are easing, which is a key indicator of weaker home prices ahead. Remember it is the RATE of credit growth, or the credit impulse we need to watch. Essentially, for home prices to rise, the rate of credit growth needs to accelerate, and the reverse is also true as can be clearly seen.

The RBA credit aggregates   shows that overall credit rose by 0.4% last month, or 4.6% over the past year. Housing credit rose by 0.3% in October, or 5.1% over the past year. Business credit rose 4.7% over the past year and 0.6% in October. Personal credit fell 1.6% over the year, and broad money rose by 1.9%, compared with 6.8% last year – the credit impulse is easing!

Total housing lending rose by 0.28% to $1.78 trillion. Within that owner occupied lending rose 0.42% or $5 billion to $1.2 trillion while investment lending rose by just 0.1% to $593.6 billion.  Investment loans fell to 33% of all loans, down from 38.6% in 2015.

Business lending was 32.7% of all lending, lower than 2015.

The monthly flows continue to show significant noise…

… but the annualised figures show the fall in housing lending across the board.

Turning to the APRA banking stats, we can look at individual lender portfolios.  We see that Westpac and ANZ both reduced their investor loan portfolios between September and October, while NAB and CBA grew theirs.

Macquarie Bank is still growing its investor pools (well above the now obsolete APRA 10% speed limit).

ADI portfolios hardly moved overall with CBA still the largest owner occupied lending, and Westpac the largest investment lender.

We can still plot the annualised movements of investor loans, and we see a small number of lenders well above the 10% speed limit (which was removed a few months ago). Significantly many lenders are well below that rate.

At an aggregate level, lending by ADIs was up 0.3% in the month, with investor loans flat, and owner occupied loans at 0.46%.

The proportion of investor loans fell again in stock terms to 33.6%.

Total ADI lending rose to $1.66 trillion, up 0.3% of $5 billion. Owner occupied loans rose 0.46% to $1.1 trillion and investor loans rose 0.004% to $557.4 billion.

In fact some smaller banks, and non-banks are growing their portfolio faster than the majors, thus the rotation across the sectors continues.

We expect credit to continue to grow more slowly ahead, and this will lead home prices lower.


Credit Growth Eases According To The RBA

The latest Credit Aggregates from the RBA to September 2018 continues to show an easing of credit growth. Total credit, across all categories rose seasonally adjusted by $14.41 billion or 0.5%, to $2.8 trillion.

Within that owner occupied lending rose 0.5% or $5.5 billion to $1.19 trillion while investment lending rose 0.1% or $0.52 billion to $593 billion. Other personal lending was flat, and business lending rose 0.9% to $943 billion, up $8.4 billion.

Investor loans fell again to 33.1% of all housing lending, while business lending rose a little to 32.7% of all lending.

The monthly movements are still noisy…

… but the 12 month ended data shows how investor lending continues to slow, owner occupied lending growth is slowing, and overall lending for housing growth is slowing to 5.2%.

This is a problem for the banks in that to maintain profitability as assets grow, they need the rate of growth of housing loans to RISE not slow down. Even at these levels (with some growth) household debt will rise relative to loans, so again it highlights the fundamental problem we have in the system at the moment.

Lending in the less regulated Non bank sector still appears to be growing more strongly than ADI lending.

Investor Lending Slows, But…

The RBA Credit Aggregates to August 2018, out today tells an interesting story.

The 12 month growth by category shows that owner occupied lending is still growing at 7.5% annualised, while investment home loans have fallen to 1.5% on an annual basis. Overall housing lending is growing at 5.4% (compared with APRA growth of 4.5% over the same period, so the non-banks are clearly taking up some of the slack). Still above wages and inflation. Household debt continues to rise.

The more noisy monthly data shows investor loans slowing, while business lending is up. Personal credit continues to slide.

The non-bank sector (derived from subtracting the ADI credit from the RBA data) shows a significant rise up 5% last month in terms of owner occupied loans.  This is indicative, as there are timing and other issues when making this comparison, but its the best available.  This is consistent with our survey data which slows that non-banks are indeed seeking to grow their books under the lighter non-ADI regulation.

Finally, total lending lose to 1.78 trillion, with owner occupied loans at $1.2 trillion and investment loans at $593 billion.  The mix of loans fell to 33.2% of housing loans for investment lending. Business lending was $934 billion, comprising 32.5% of all credit.

In summary, housing debt is still rising too fast . Period.  APRA needs to look at the non-banks. And quickly.

Credit Momentum Eases – RBA

The monthly RBA credit aggregates for July are out today.   Total credit for housing rose 0.2% in the month, to $1.77 trillion, with owner occupied credit up 0.5% to $1.18 trillion and investment lending down 0.1% to $593 billion. Investment housing credit fell to 33.4% of the portfolio, and business credit was 32.5%.

Interestingly the RBA’s seasonally adjusted numbers lifted credit growth from the non-adjusted set, but we are skeptical of these adjustments, given the current abnormal conditions in the market (especially taking into account the APRA data today).

That said, the trends tell the story, with the noisy monthly chart

less easy to read than the annual charts. Owner occupied housing is growing at 7.6%, investment housing at 1.5% and overall housing at 5.5%.

We still see some growth in the non-bank sector, and this month the RBA reported NO switching between investment and owner occupied loans.

So overall, the credit tightening continues to bite and investors are at the sharp end. No reason to think this will change, as it is driven by more responsible lending practices.

Investment Lending Slides, But Overall Credit Higher

The RBA released their credit aggregates to June 2018 today.  Overall credit grew 0.3% in the month to $2.84 trillion, up $9.7 billion. to a new record.

Within that, owner occupied housing lending rose 0.6% or $6.6 billion to $1.18 trillion, while investment lending fell $800 million, down 0.1% in seasonally adjusted terms, or rose $1 billion, up 0.2% in original terms. (I have no idea what adjustments the RBA makes, its not disclosed!).

Investment lending fell to 33.5% of the portfolio. Total lending for housing is a new record $1.77 trillion, and remember this is at a time when housing debt to income is knocking on the 200 door, and we are one of the most in debt nations on the planet.  Least we forget, loans need to be repaid, eventually!

Business lending in seasonal terms rose 0.4%, up $4.1 billion to $921 billion, and fell to 32.2% of all lending – we see a continued fall in the proportion of lending to business, as opposed for housing, which is not good.

Personal credit rose $600 million, up 0.4% in original terms or fell $300 million in seasonally adjusted terms down 0.2%.

The monthly seasonally adjusted numbers highlight the slide in investor lending, and the stronger owner occupied lending.

Finally, we also estimate the growth in on-bank lending, by taking the original RBA data, and comparing this with the ADI data from APRA also out today.

In essence, the relative share of home lending going to the non-banks is rising, to around 7% of all loans, and the bulk of the loans being written are for owner occupied borrowers.

A caveat here, as the non-bank segment of the data will always be a bit off, because there is less timely data captured from this small, but growing part of the market. Something which APRA needs to address.

So more of the old same old, same old, housing lending still growing way above inflation and wages, forcing housing debt higher, at the expense of business investment.

We have not fundamentally addressed the credit elephant in the room. Despite all the noise.

Perhaps the regulators would like to tell us, how much debt is too much? We clearly have not hit their pain threshold yet, despite the rising financial stress in many households.


RBA Credit Aggregates May 2018

The RBA released their credit aggregates to end May 2018 – the ying, to APRA’s yang…  This is a market level view, including belated and partial data from the non-bank sector, so its always a larger set of numbers than the APRA ADI set, which we discussed previously.

The RBA data shows that total housing lending rose 0.37% from last month, up $6.6 billion to $1.76 trillion. Within that, owner occupied housing rose 0.55% or  $6.5 billion, and investment lending rose just 0.02% or $220 million. Personal credit fell again, and business lending fell 0.3% down $2.5 billion to $917 billion, all seasonally adjusted.

Investment lending made up 33.5% of all housing loans, down from 33.7% the previous month, and continues to slide, as expected. However the drop in business credit meant the proportion of commercial lending fell to 32.4% of all lending.

The monthly growth trends show the fall in business lending, and the fall-off in investor lending, all seasonally adjusted, which in the current environment may well be writing the volumes down too far.

The 12 month rolling trend shows owner occupied housing still running at 7.9%, well above inflation and wage growth, while investor lending has a read of 2%, which is the lowest see since the RBA series started to be published in  1991. Have no doubt, investor lending is fading.

Personal credit dropped an annualised 1.3%, the largest fall since the fall out from GFC in 2009. Business lending was around 3.8% annualised and slid a little.

Finally, the non-bank contribution to lending growth can be imputed by subtracting the APRA ADI data from the RBA market data. This is an inexact science because of timing and coverage issues across the data.  But it tells an interesting story, with non-bank growth rates sitting at around 20% for owner occupied loans and around 18% for investor loans, on a twelve month rolling basis. So we can see where some of the slack in the system is being taken up as non-banks flex their muscles. Regulation of this sector is a concern, as Moody’s highlighted recently.  APRA has this responsibility, but how actively they are looking at this segment of the market, when data is so hard to acquire is a moot point.  My guess is they are light on.