Household Financial Confidence Slips Again In January

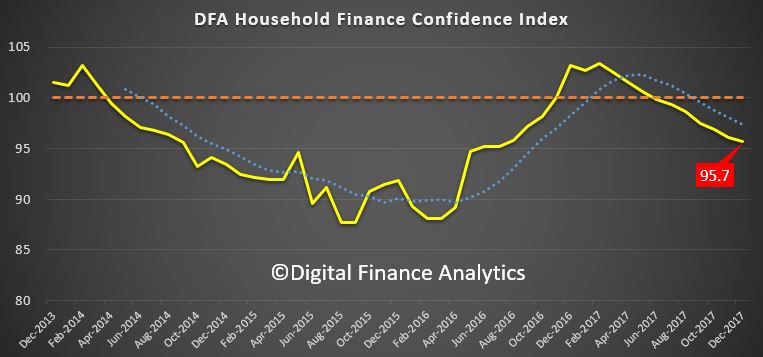
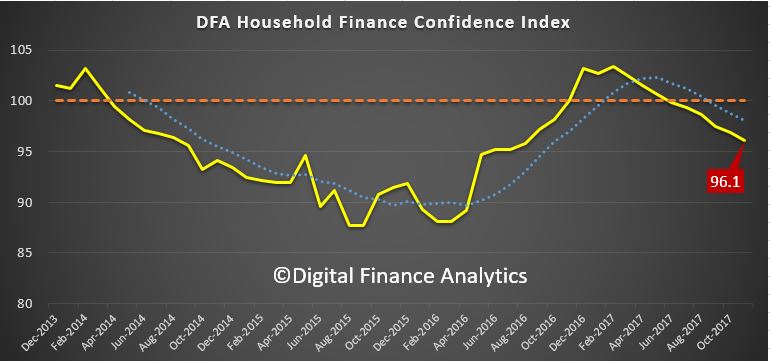
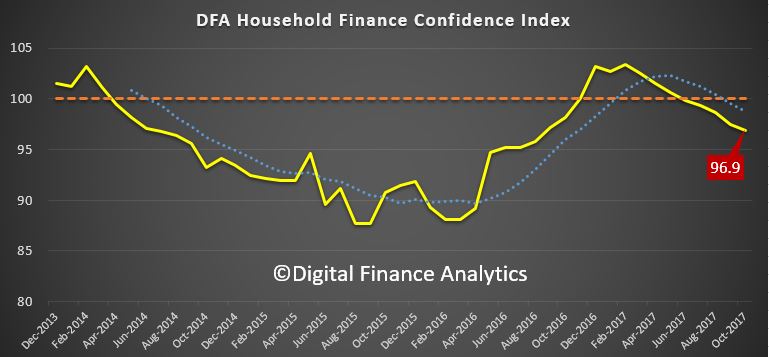
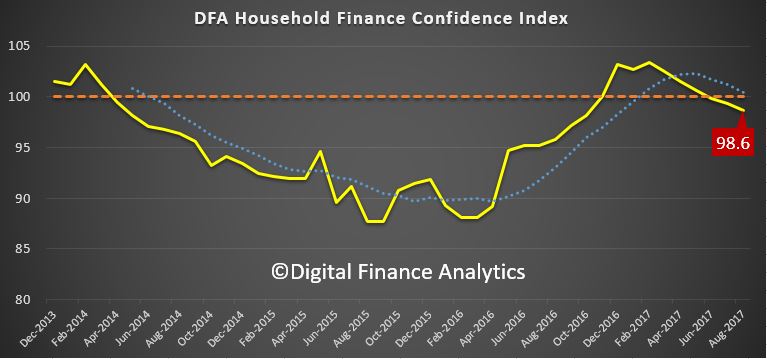
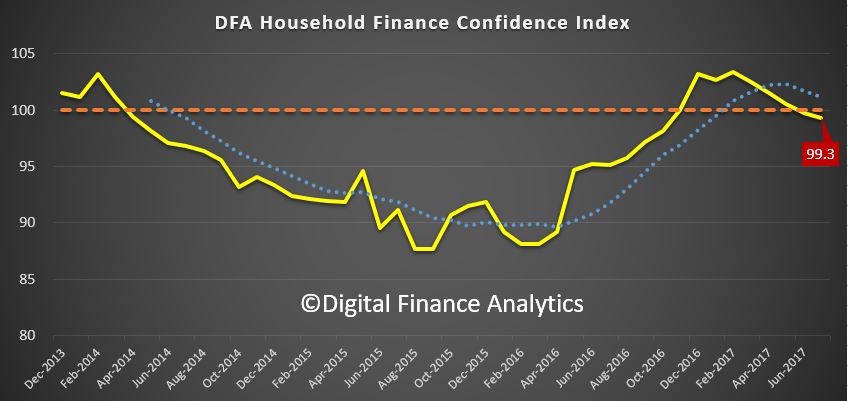
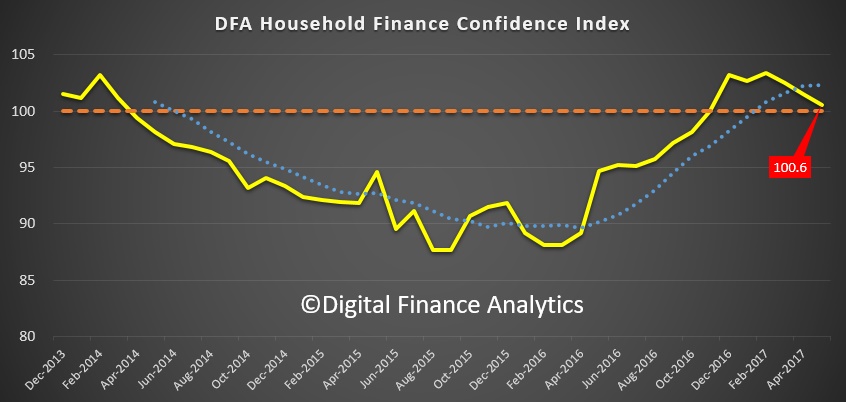
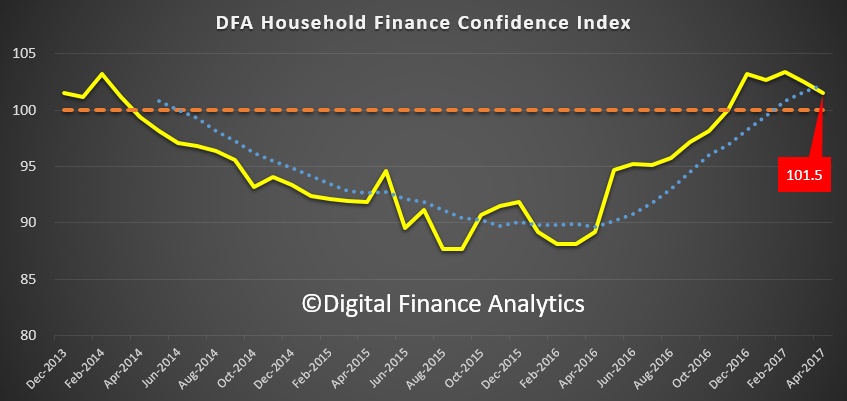
Digital Finance Analytics has released the January 2018 update of our Household Financial Confidence Index, using data from our rolling 52,000 household surveys.

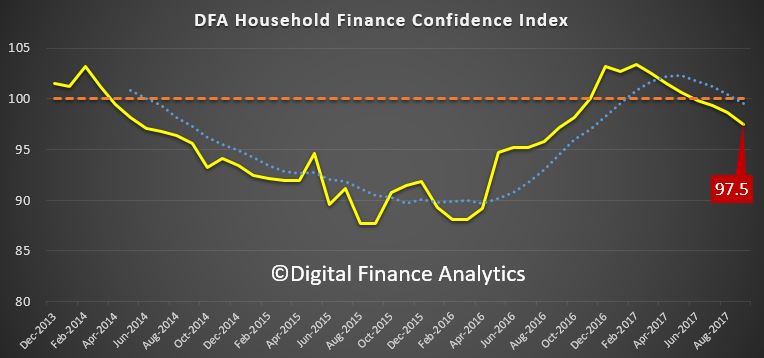
The news is not good, with a further fall in the composite index to 95.1, compared with 95.7 last month. This is below the neutral setting, and is the eighth consecutive monthly fall below 100.

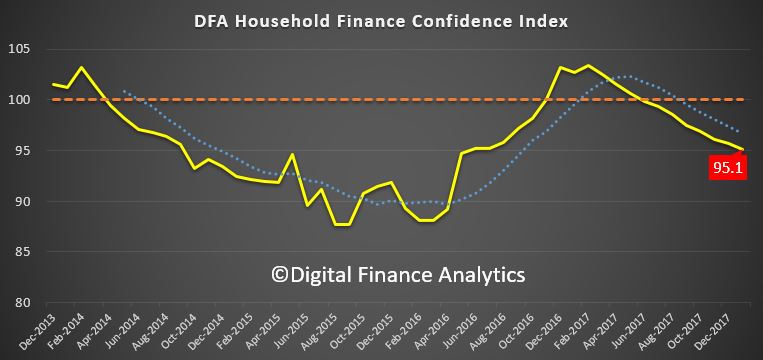
This result highlights the ongoing disconnect between business confidence, and consumers who are still reeling from rising costs of living, flat incomes and high debt.

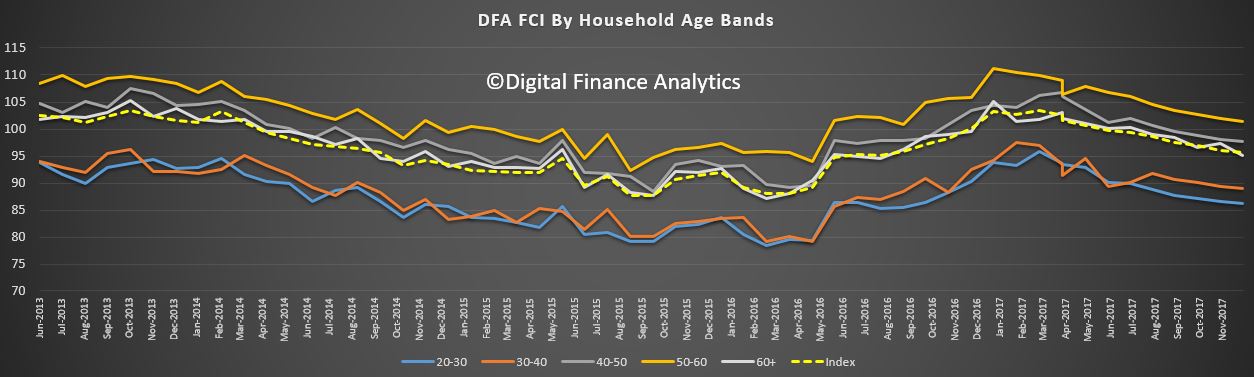
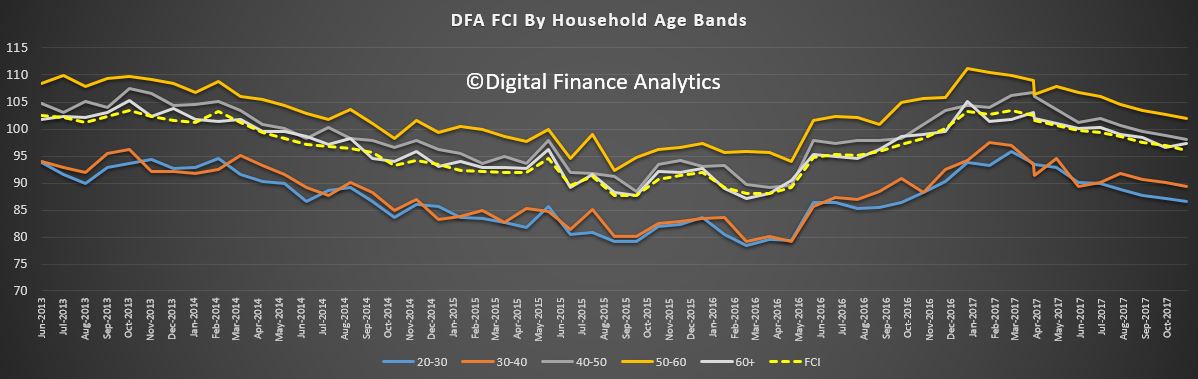
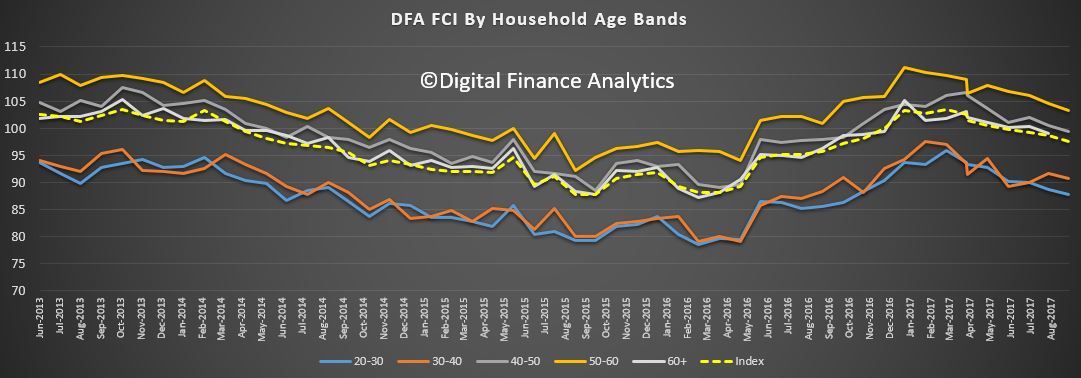
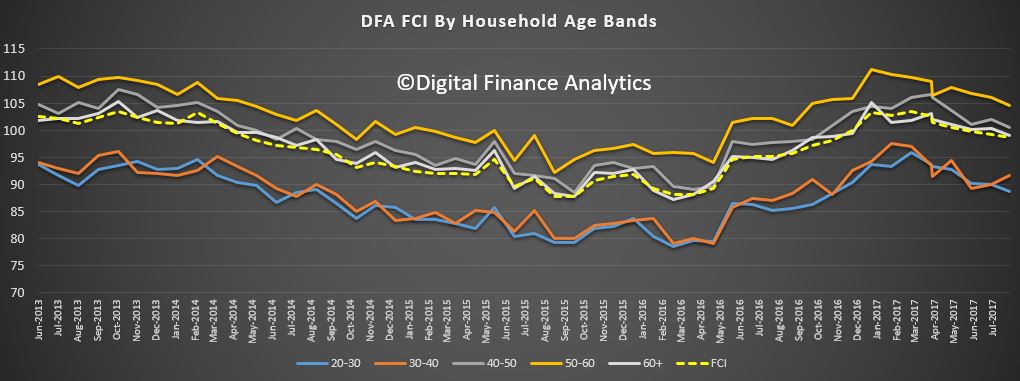
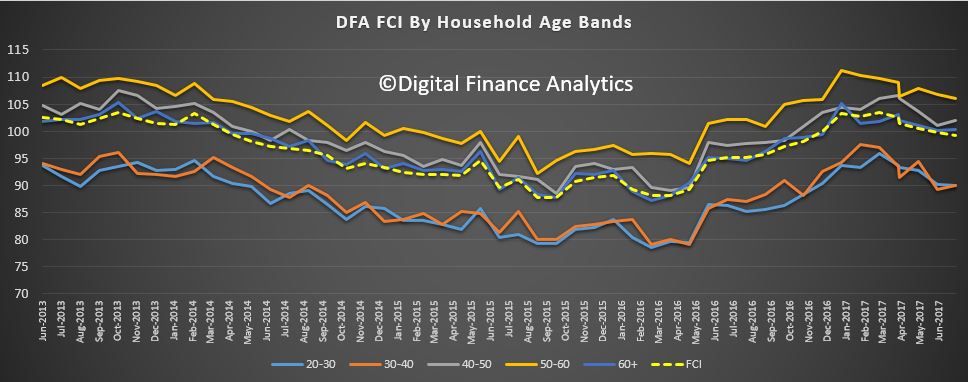
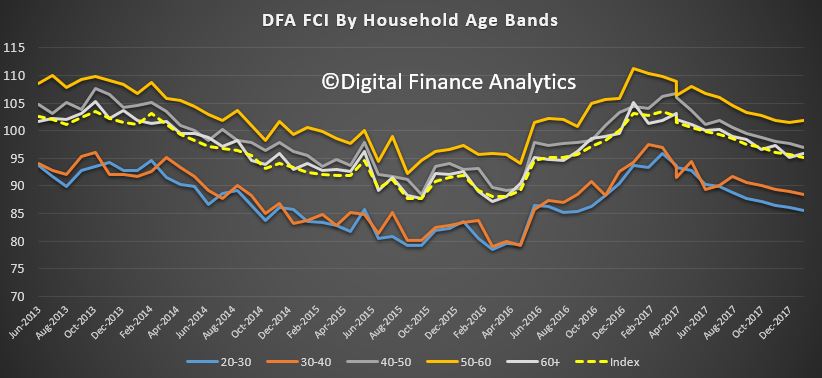
Across the age bands, there was a small rise in those older than 50 years, but younger households, from 20 -50 all tracked lower.

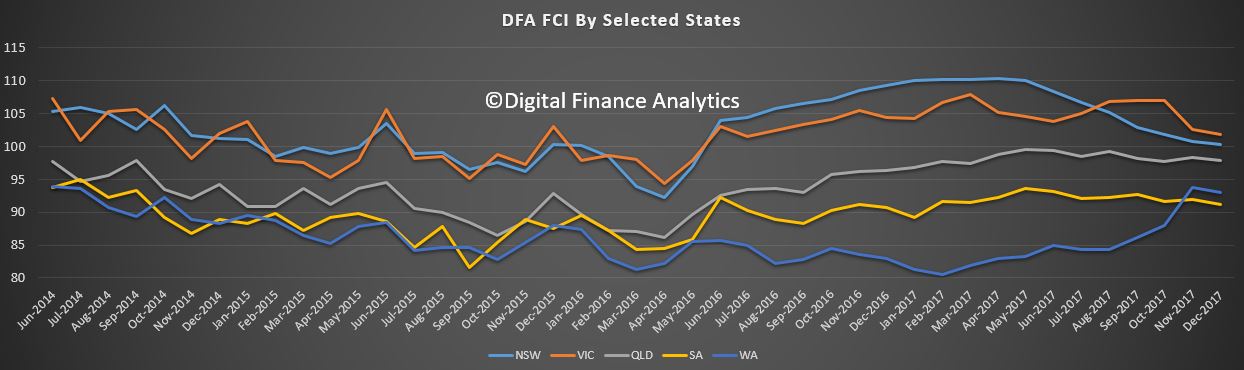
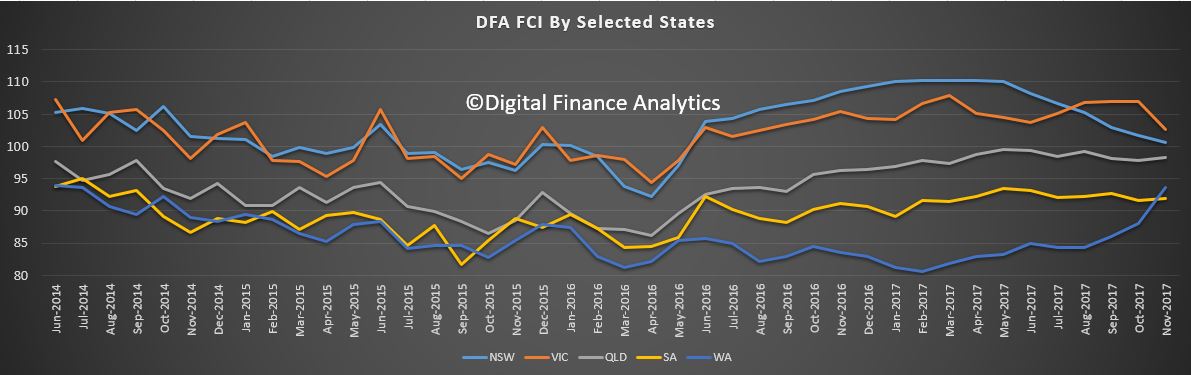
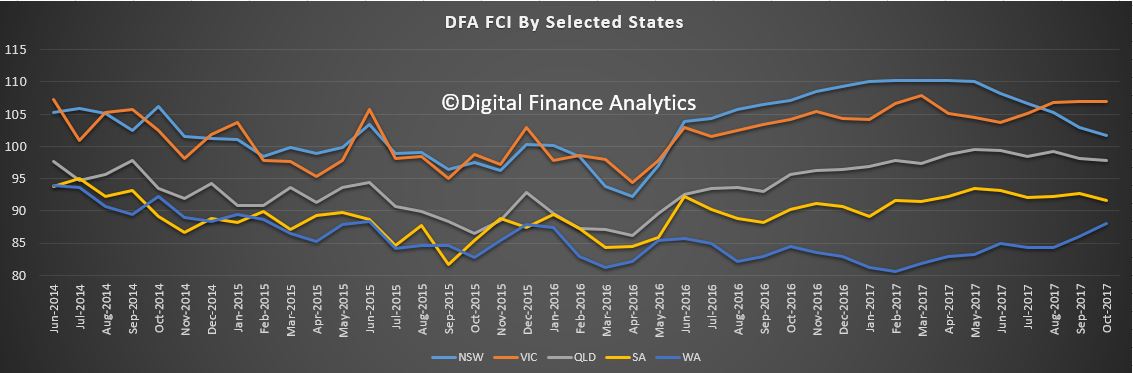
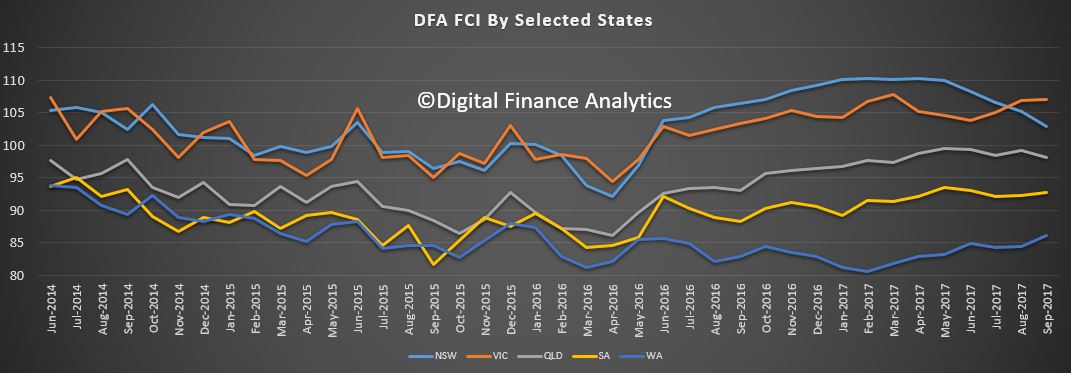
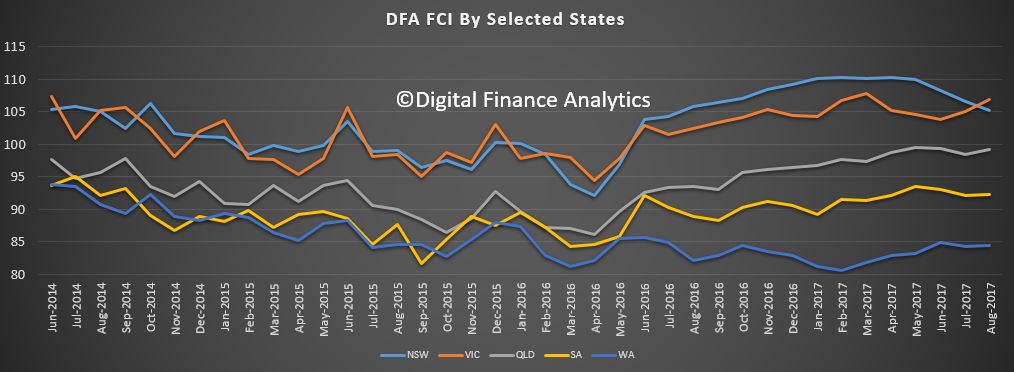
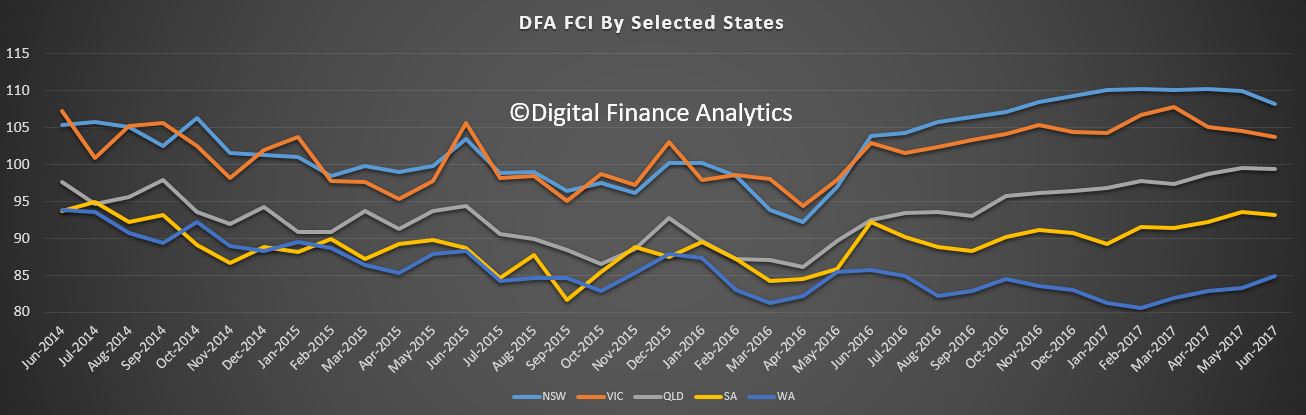
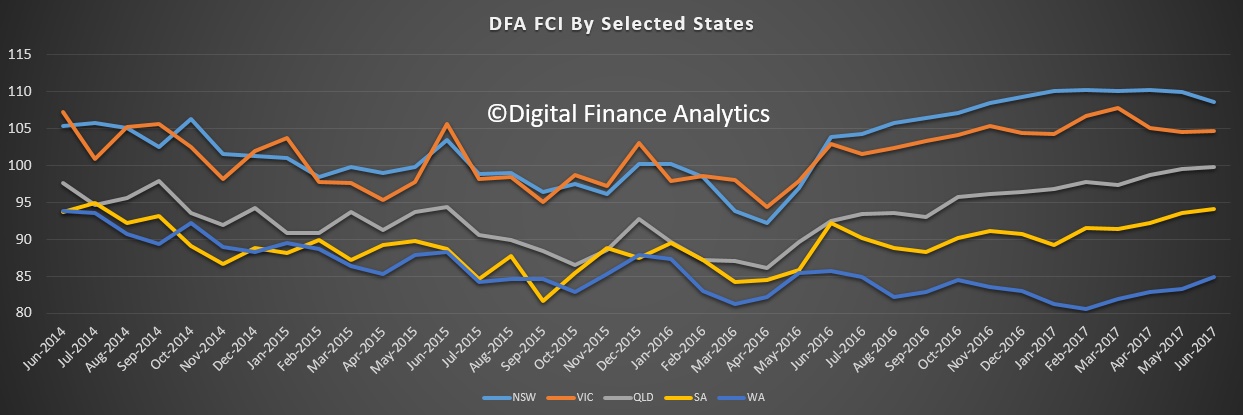
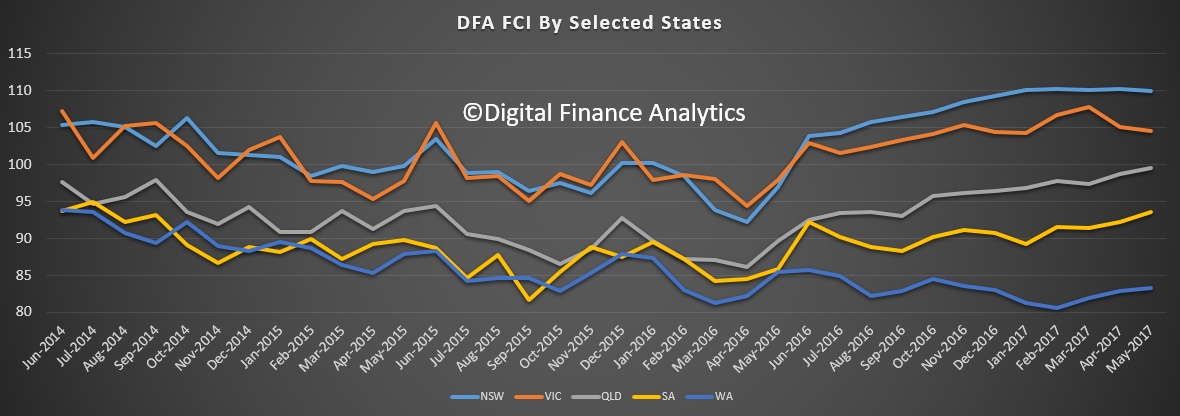
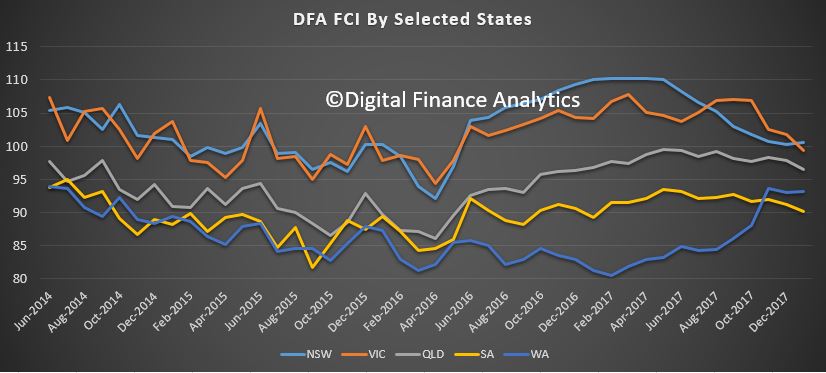
There was a significant drop in confidence in Victoria, which has now been overtaken again by New South Wales as the most confident state. Confidence fell in South Australia and Queensland, whilst there was little change in Western Australia, which recovered somewhat earlier in the year.

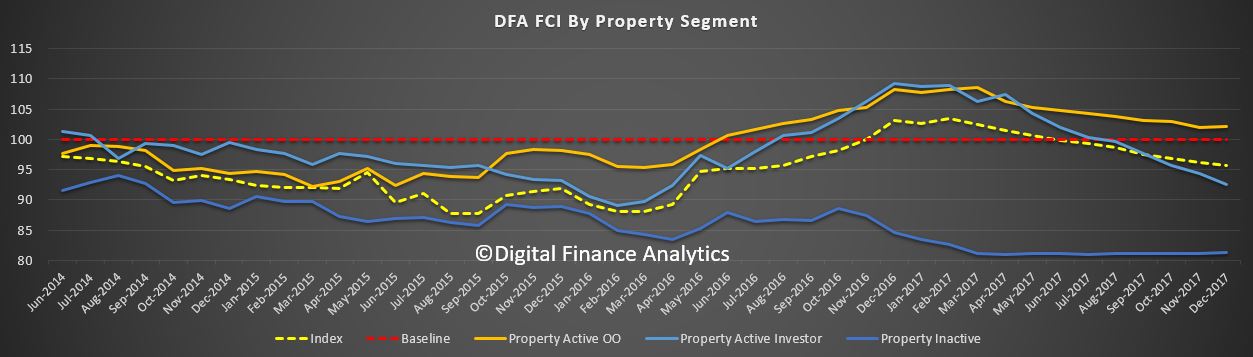
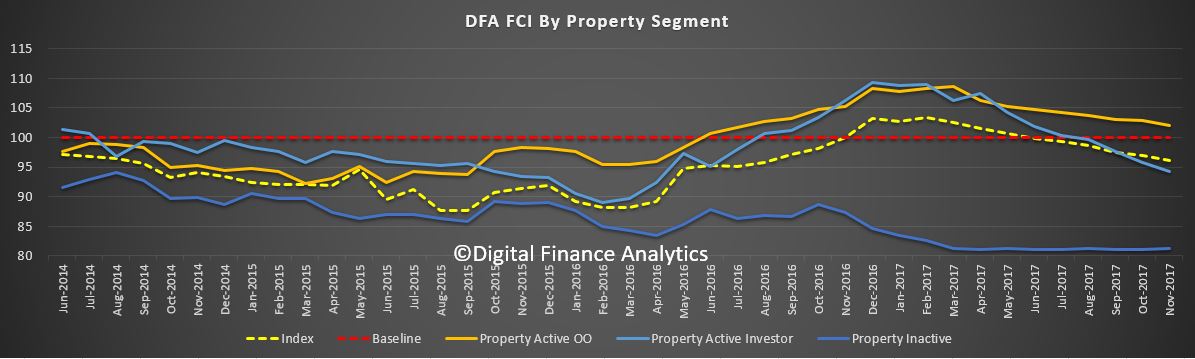
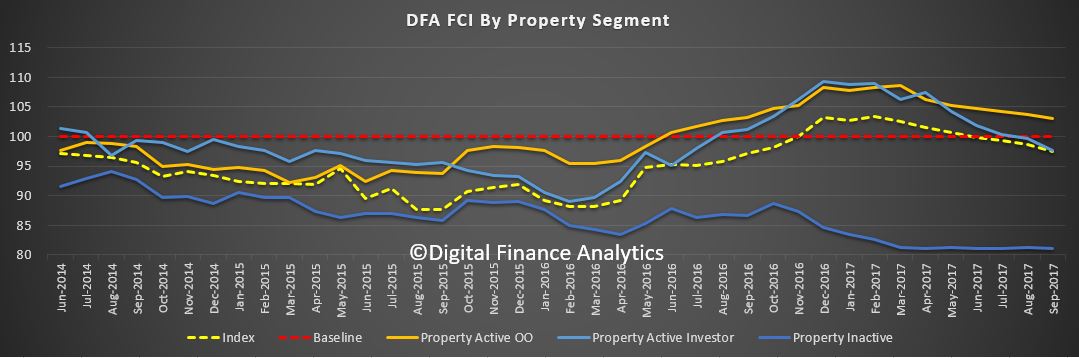
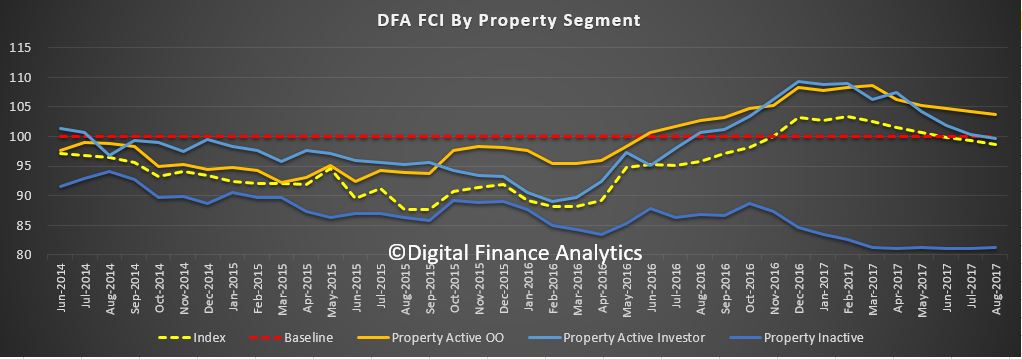
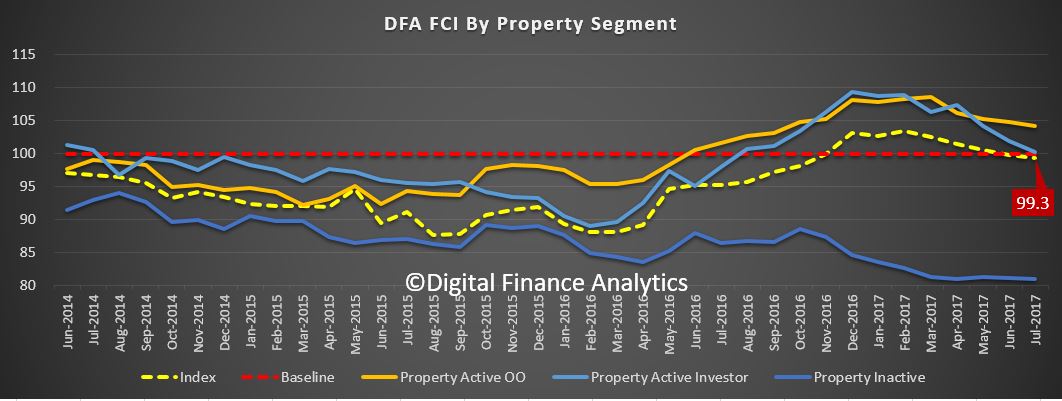
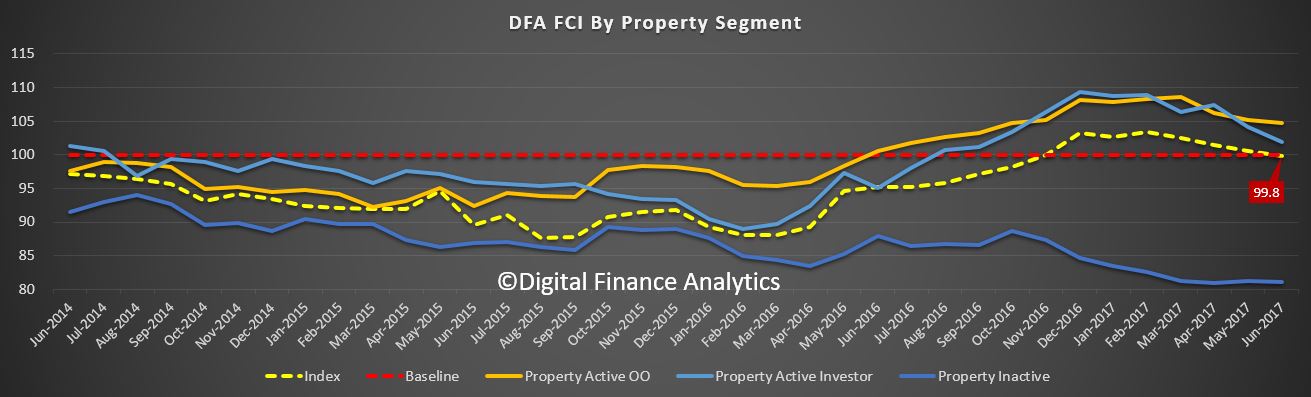
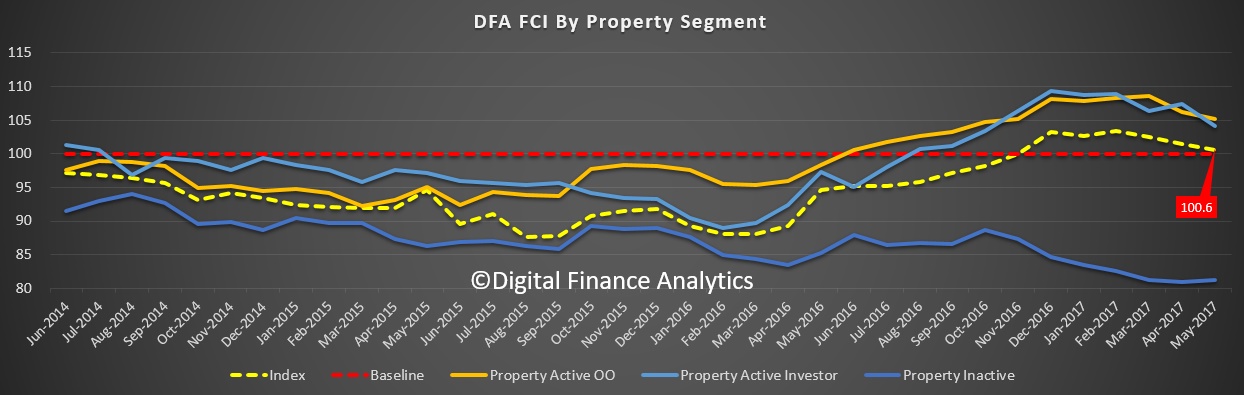
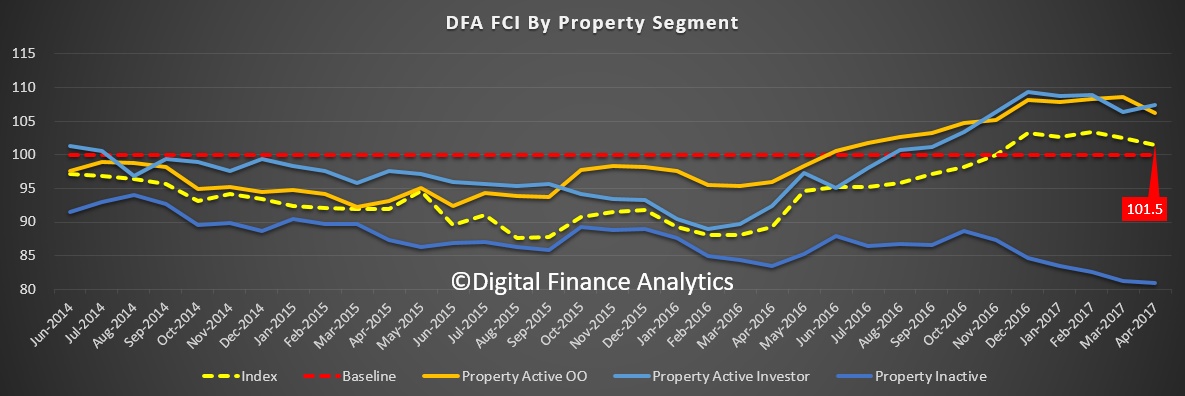
Household’s property footprint impacts confidence levels significantly, with those who are not property active and so living in rented accommodation sitting significantly below those who own property.  Owner occupied property holders saw a small uplift this month, reflecting the lower refinancing rates available, and more first time buyers. However, property investors, traditionally the more bullish, continues to languish, dragging the whole index lower.

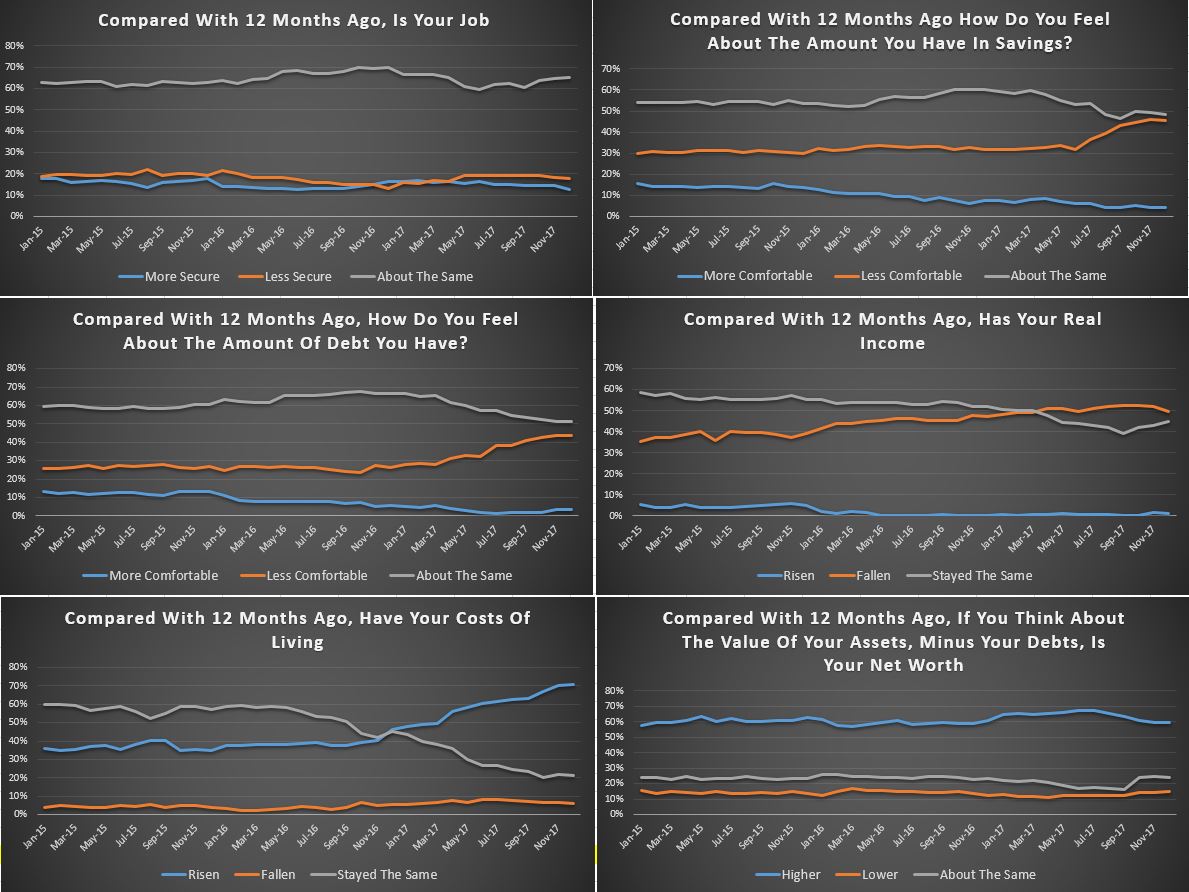
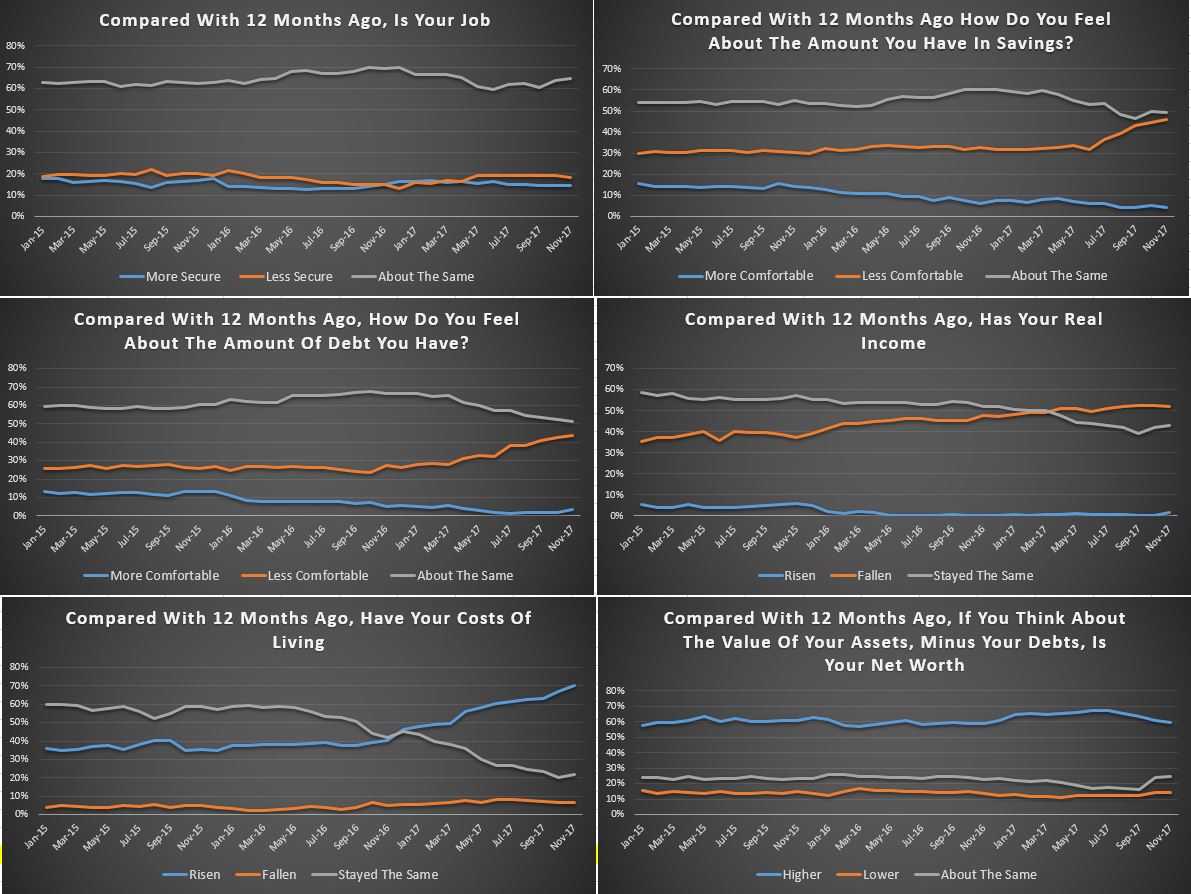
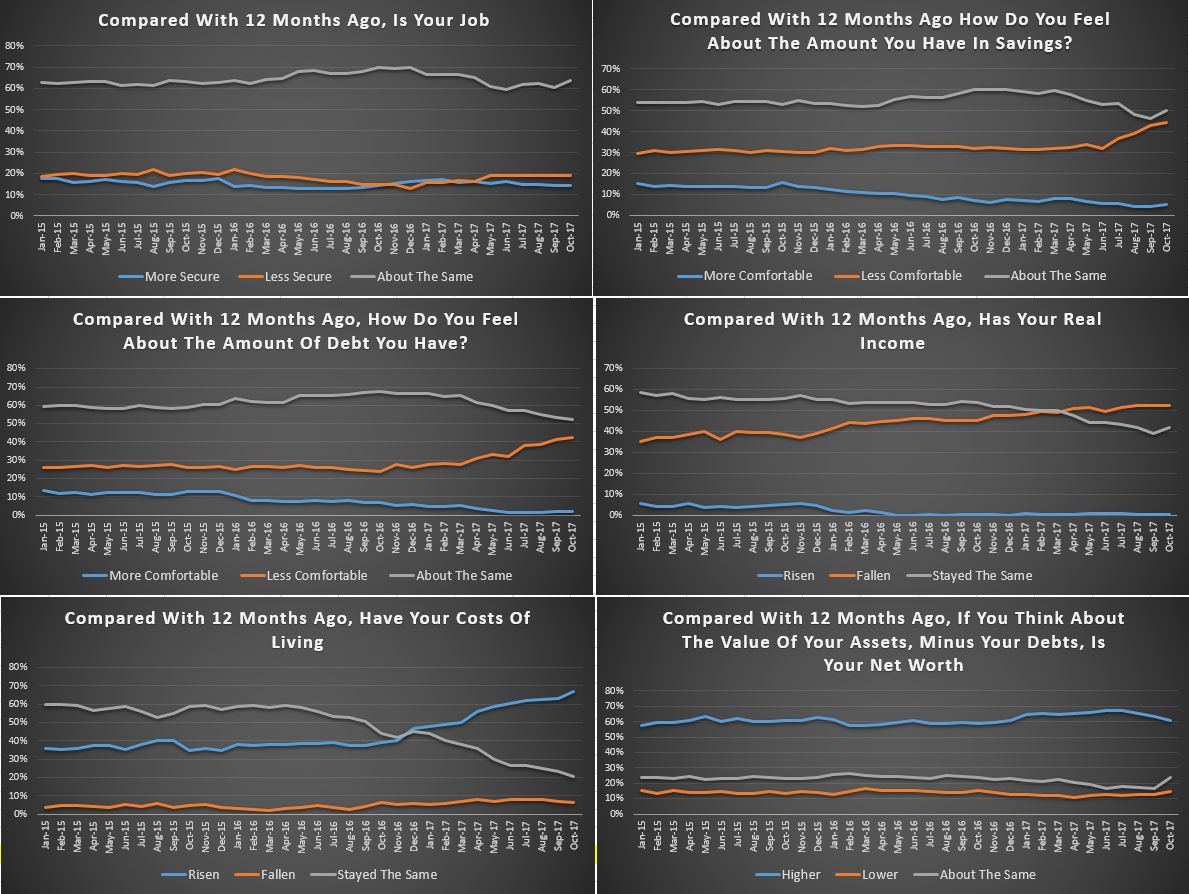
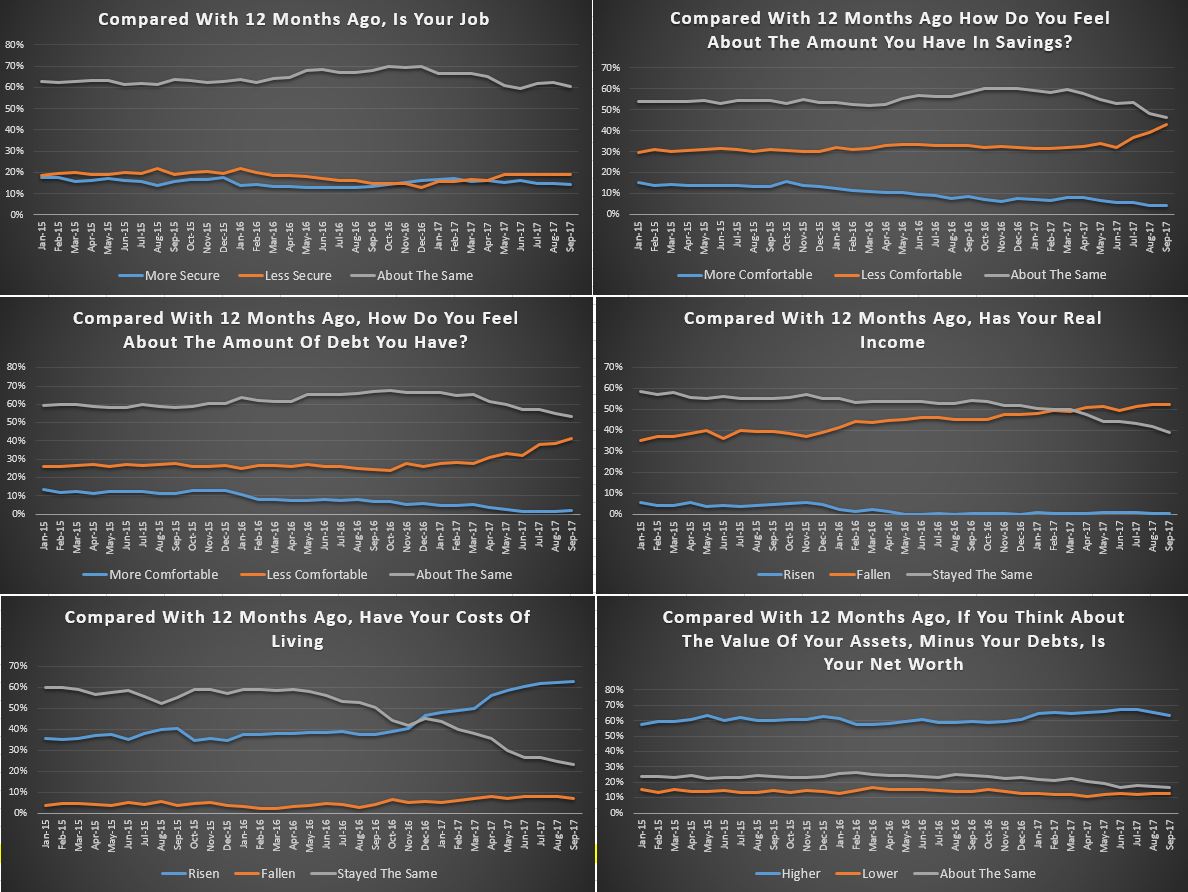
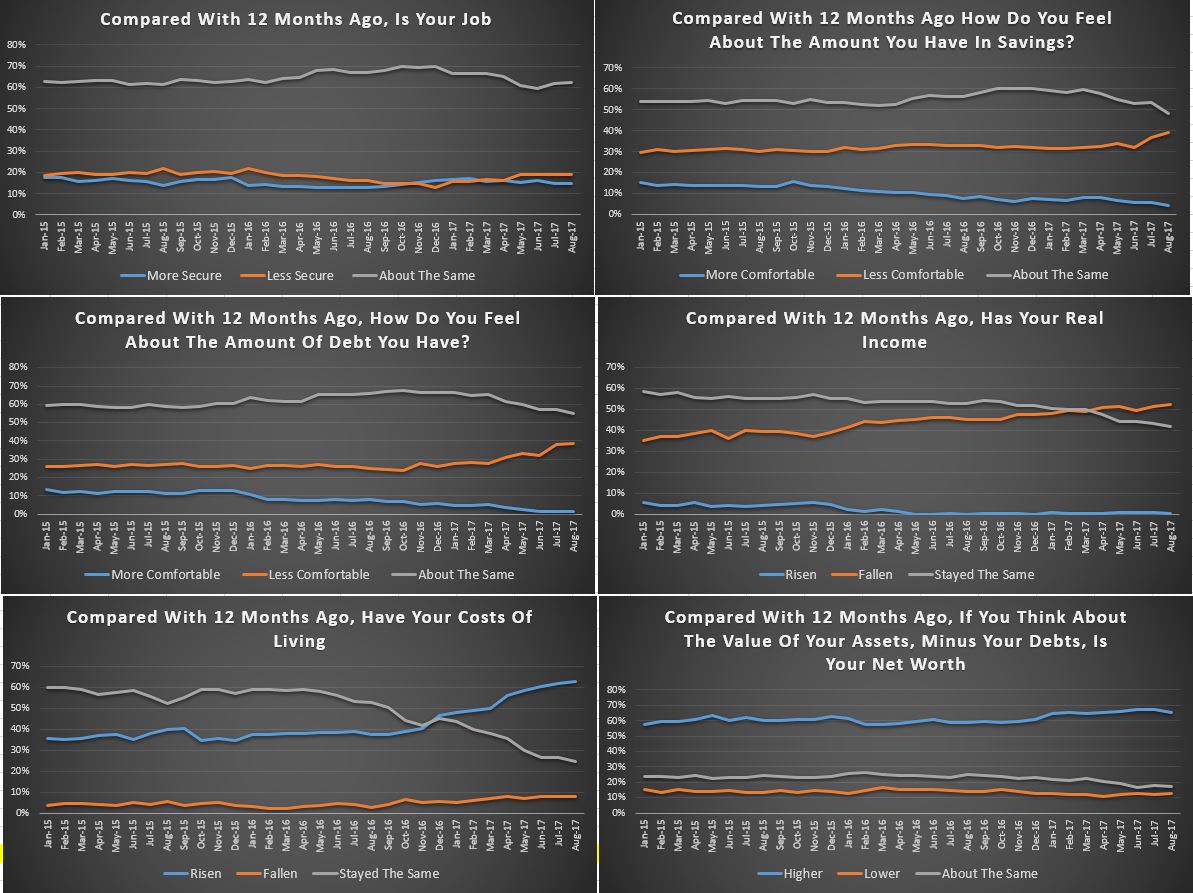
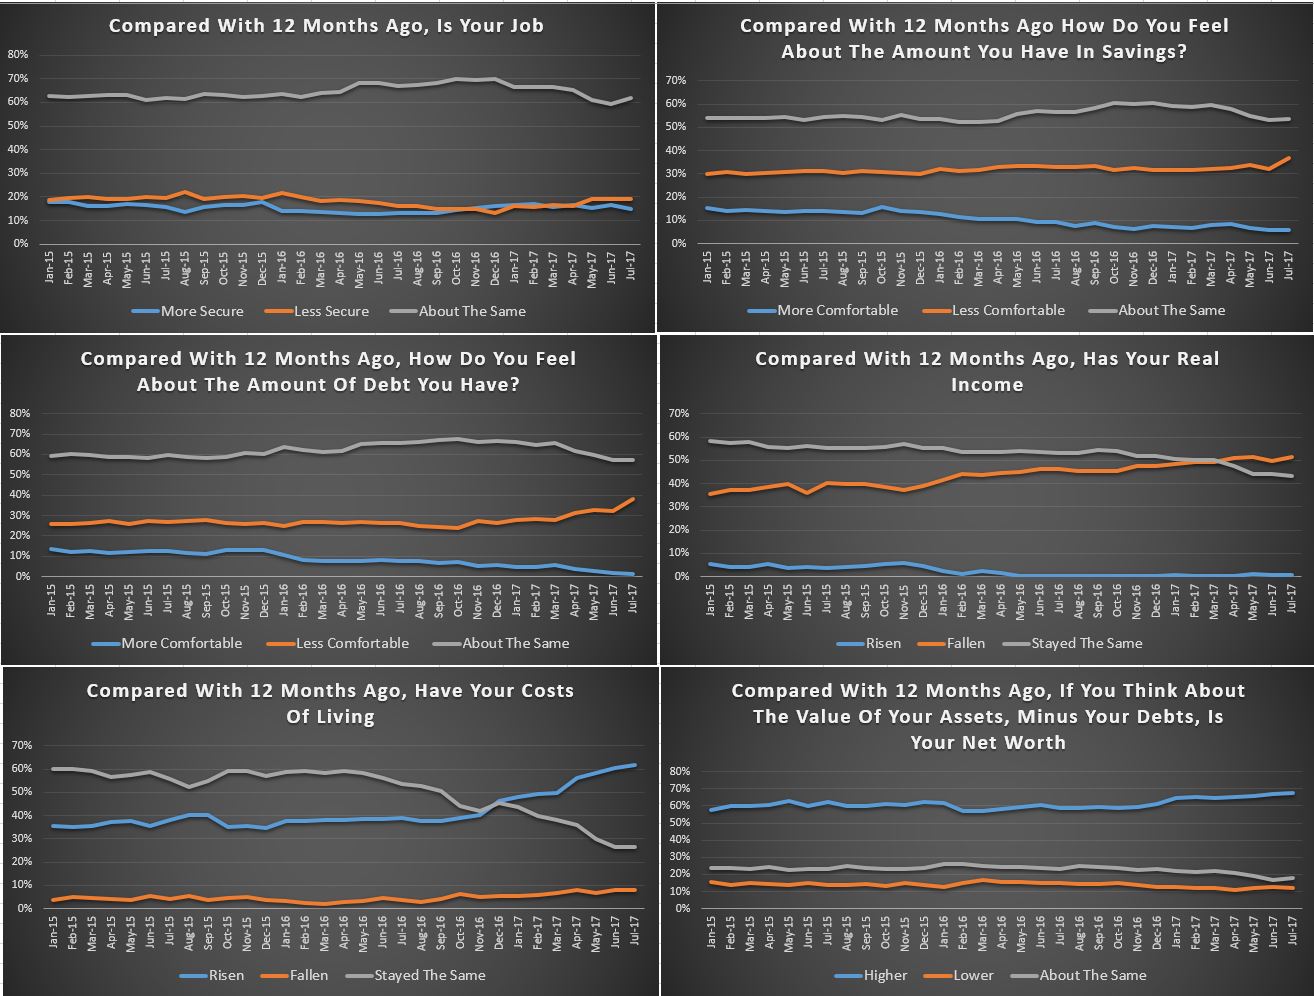
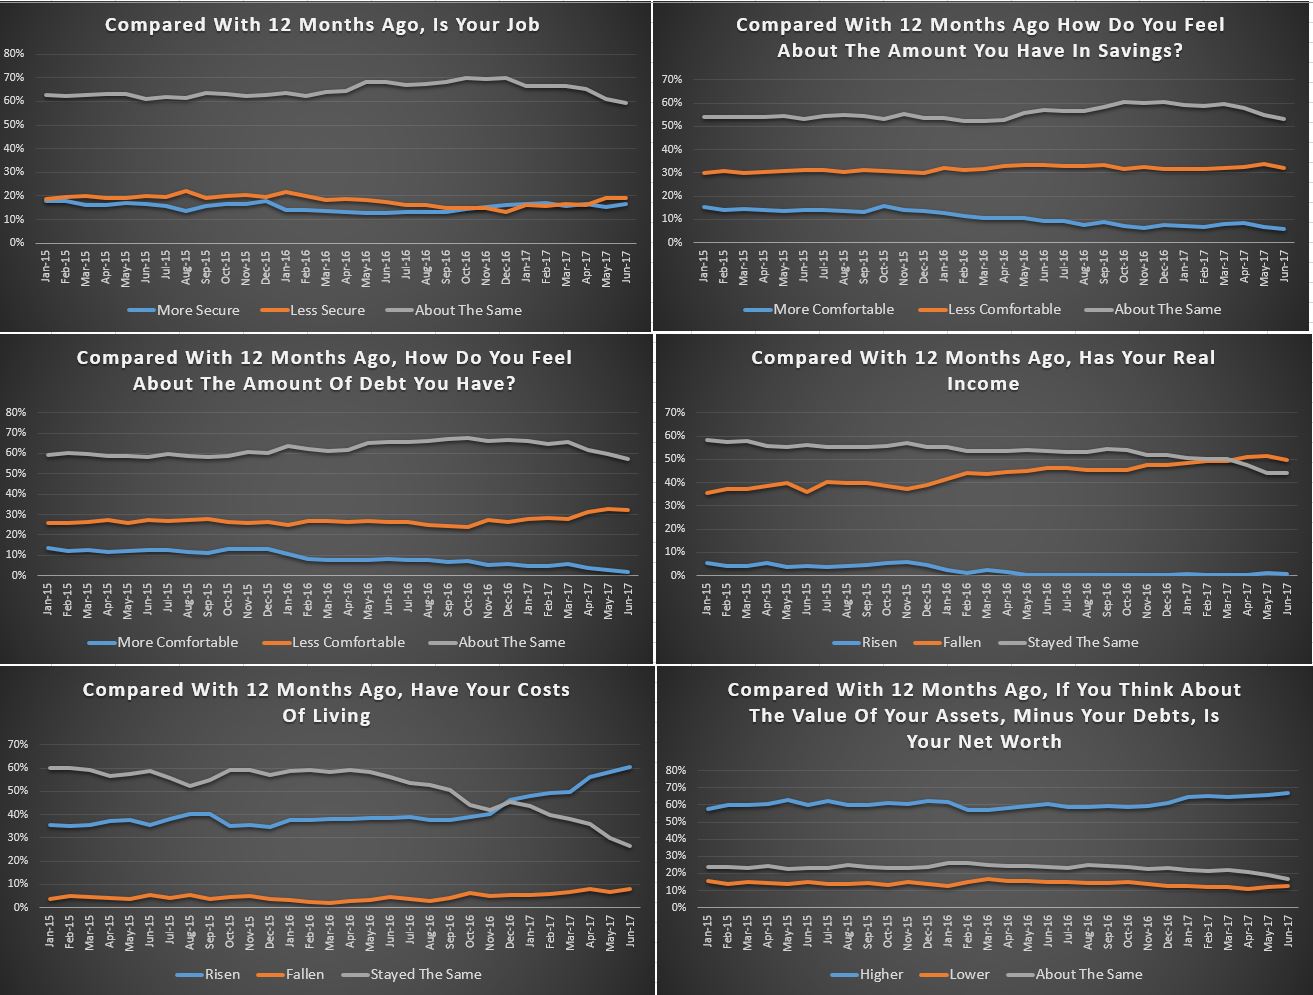
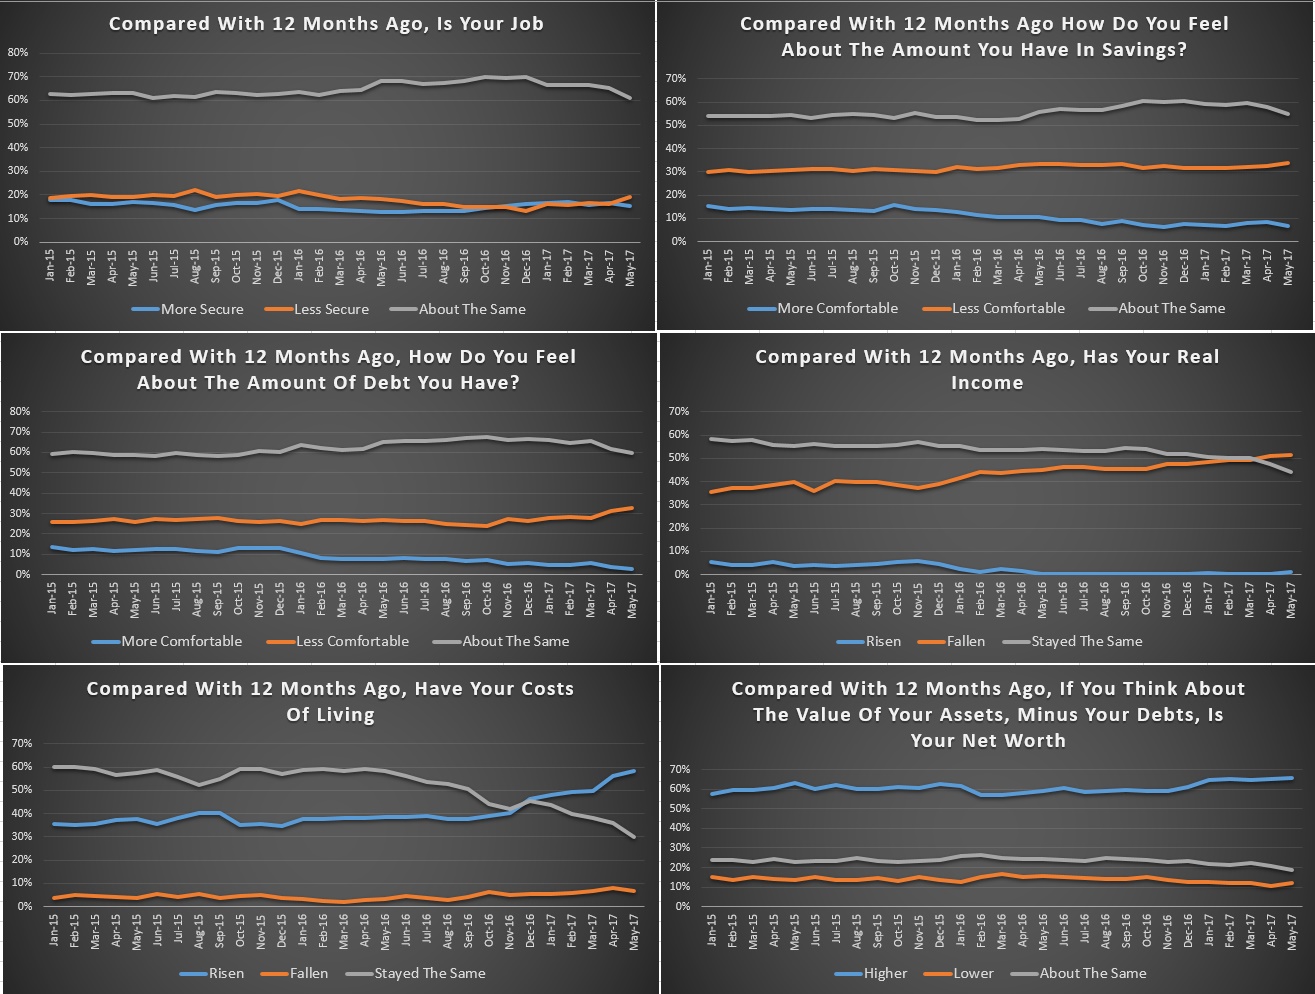
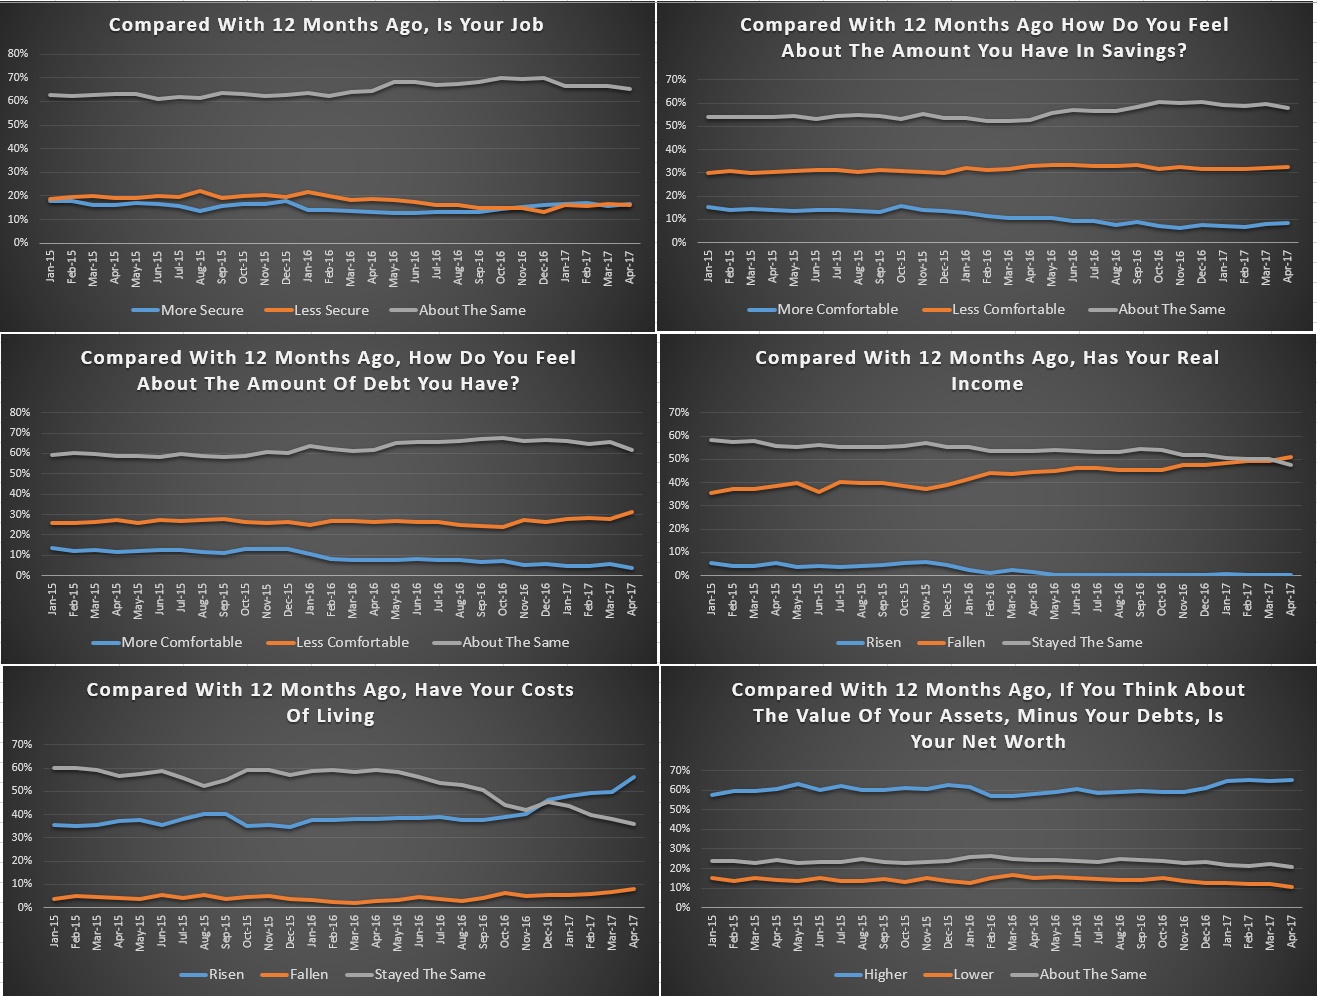
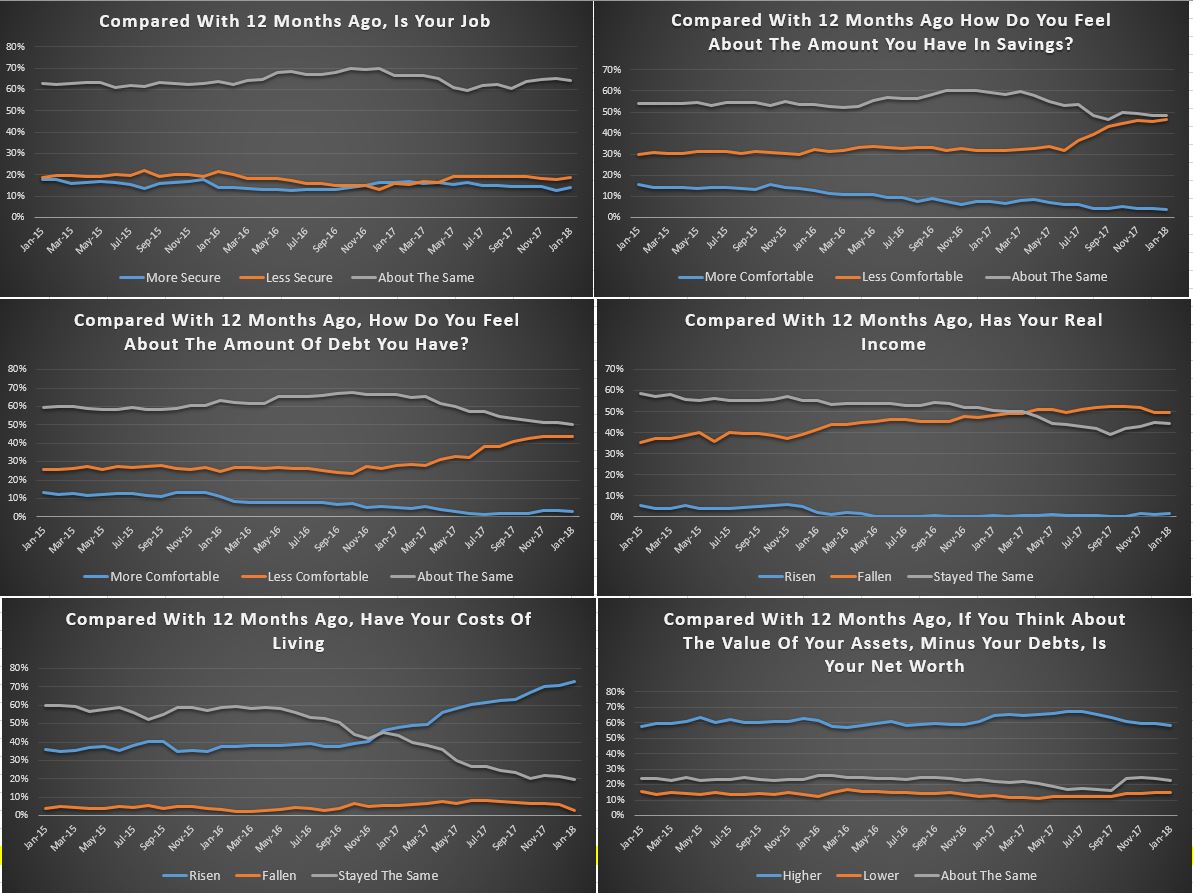
The segmental scorecard shows that whilst job security rose a little, pressure from large levels of debt rose further, with 44% of households less comfortable than a year ago, and only 3% more comfortable.  Pressure on savings continues, with lower returns on deposits, and more dipping into savings to pay the bills. 46% of households were less comfortable with their savings, compared with a year ago, and 4% only were more comfortable.

Costs of living pressures are very real, with 73% of households recording a rise, up 1.5% from last month, and only 3% a fall in their living costs. A litany of costs, from school fees, child care, fuel, electricity and rates all hit home.

On the other hand, only 1% of households records a real rise in incomes compared with a year ago, while 50% said their real incomes had been eroded, and 45% stayed the same. More evidence that incomes are rising more slowly than costs. Those employed in the private sector are particularly hard hit, with many recording no pay rises for the past 2 years.

Finally, household net worth is under pressure for some, as property prices slide, and savings are being eroded (despite high stock market prices). Whilst 58% said wealth had improved, 15% recorded a fall, and 23% said there was no change.  A further fall in property prices was the overwhelming concern of those holding real-estate, with more than half now expecting a fall in the months ahead. This expectation is already impacting their spending patterns, and have reduced their prospect of buying more property.

So, overall we see the ongoing slide in household financial confidence, and there is nothing on the horizon which is likely to change momentum. We expect wages growth to remain contained, and home prices to slide, while costs of living pressures continue to grow.

By way of background, these results are derived from our household surveys, averaged across Australia. We have 52,000 households in our sample at any one time. We include detailed questions covering various aspects of a household’s financial footprint. The index measures how households are feeling about their financial health. To calculate the index we ask questions which cover a number of different dimensions. We start by asking households how confident they are feeling about their job security, whether their real income has risen or fallen in the past year, their view on their costs of living over the same period, whether they have increased their loans and other outstanding debts including credit cards and whether they are saving more than last year. Finally we ask about their overall change in net worth over the past 12 months – by net worth we mean net assets less outstanding debts.

We will update the results again next month.

Household Financial Confidence Trudges South In December

The latest edition of the Digital Finance Analytics Household Financial Security Confidence Index, to December 2017 shows another fall, down from 96.1 last month to 95.7 this time, and remains below the neutral measure of 100.

The trend continues to drift south as flat incomes, big debt and now falling home prices all impact.

Analysis of households by their property owning status reveals that property investors are in particular turning sour, as flat net rental incomes, and rising interest rates hit many, at a time when property capital growth is stalling. Owner occupied households are faring a little better, thanks to a range of ultra cheap mortgage rates on offer at the moment, but they are also concerned about price momentum. Those without property interests remain the least confident, as the costs of renting outstrip income growth, and more are slipping into rental stress.

Looking across the states, they all slipped a little, with NSW now well behind VIC (we think the Victorian market is about 6 months behind Sydney, so will drift lower ahead). WA has not improved this time, suggesting that those talking up the market in the west may be over optimistic.

Across the age groups, young households are most concerned about their financial position, but every age group shows a small fall this month – perhaps thanks to the Christmas binge (though we think credit card debt will not rise that much this year) and retail stats may be lower than expected.

Looking in detail at the scorecard, which shows the elements which drive the index; job security is pretty stable, but savings are being raided by many to support their finances, while rates on bank deposits continue to drift lower.  Households are becoming increasingly uncomfortable with the level of debt they hold (they should at a ratio of 2:1, debt to income). Income continues to fall in real terms and costs of living are rising (child care costs and rising fuel costs are concerning many).  We also see a slide in net worth, as home prices, especially in the Sydney region decline. This despite high stock market prices at the moment.

We cannot see any circuit breakers in the mix ahead, so we expect the falling trend to continue into autumn.

By way of background, these results are derived from our household surveys, averaged across Australia. We have 52,000 households in our sample at any one time. We include detailed questions covering various aspects of a household’s financial footprint. The index measures how households are feeling about their financial health. To calculate the index we ask questions which cover a number of different dimensions. We start by asking households how confident they are feeling about their job security, whether their real income has risen or fallen in the past year, their view on their costs of living over the same period, whether they have increased their loans and other outstanding debts including credit cards and whether they are saving more than last year. Finally we ask about their overall change in net worth over the past 12 months – by net worth we mean net assets less outstanding debts.

We will update the results again next month.

Household Financial Security Takes Another Hit In November

Digital Finance Analytics has released the November 2017 results from our Household Financial Security Index. The index uses data from our household surveys to assess households level of financial comfort.

The index fell to 96.1, which is below the 100 neutral metric, down from 96.9 in October 2017. This is the sixth month in succession the index has been below the neutral point.

Watch the video or read the transcript.

Owner Occupied households are the most positive, scoring 102, whilst those with investment property are at 94.3, as they react to higher mortgage repayments (rate rises and switching from interest only mortgages), while rental yields fall, and capital growth is stalling, especially in Sydney).  Households who are not holding property – our Property Inactive segment – will be renting or living with friends or family, and they scored 81.2. So those with property are still more positive overall.

Looking across the states, households in NSW and VIC are just above the neutral setting, but continue to slipping lower. Households in QLD are below the 100, but up a little, as are those in SA and WA. Western Australian households are the least positive, but somewhat improved.

Looking across the age ranges, younger households are the least positive, and all ages banks fell, other than those over 60 years which saw a small rise.

Looking at the FCI score card, job security is on the improve, reflecting rising employment participation, and the lower unemployment rate.  Around 20% of households feel less secure, especially those with multiple part time jobs.

Savings are being depleted to fill the gap between income and expenditure – as we see in the falling savings ratio. As a result, nearly 40% of households are less comfortable with the amount they are saving. This is reinforced by the lower returns on deposit accounts as banks seek to protect margins.

More households are uncomfortable with the amount of debt they hold with 40% of households concerned. The pressure of higher interest rates on loans, tighter lending conditions, and low income growth all adds to the discomfort. More households reported their real incomes had fallen in the part year, with 50% seeing a fall, while 40% see no change.  Only those on very high incomes reported real income growth.

More households reported a rise in their costs of living, and this month this included higher school fees and child care costs, energy bills and fuel costs. The average cpi of around 2% appears to understate the real life experience of many households.

Finally, household net worth improved for more than 60% of households, but there is a rise in those seeing no growth, mainly as home price growth eases back. Those with share market investments have done quite well in recent months.

Looking ahead, we expect the overall index to trend lower, as incomes remain constrained, and costs of living grow. The property market has a big impact on households level of confidence and the leading indicators are flagging lower outcomes ahead.  However, home prices would need to fall significantly to allow many of those currently unable to afford to buy in to the market.

By way of background, these results are derived from our household surveys, averaged across Australia. We have 52,000 households in our sample at any one time. We include detailed questions covering various aspects of a household’s financial footprint. The index measures how households are feeling about their financial health. To calculate the index we ask questions which cover a number of different dimensions. We start by asking households how confident they are feeling about their job security, whether their real income has risen or fallen in the past year, their view on their costs of living over the same period, whether they have increased their loans and other outstanding debts including credit cards and whether they are saving more than last year. Finally we ask about their overall change in net worth over the past 12 months – by net worth we mean net assets less outstanding debts.

We will update the results again next month.


Household Financial Security Weakens Again In October

The latest edition of the Digital Finance Analytics Household Financial Security Confidence Index to end October shows households are feeling less secure about their finances than in September. The overall index fell from 97.5 to 96.9, and remains below the 100 neutral setting. We use data from our household surveys to calculate the index.

While households holding property for owner occupation remain on average above the neutral setting, property investors continue to slip further into negative territory, as higher mortgage rates bite, rental returns slide and capital growth in some of the major markets stalls.  Those property inactive households remain the most insecure however, so owning property in still a net positive in terms of financial security.

There are significant variations across the states. VIC households continue to lead the way in terms of financial confidence, and WA households are moving up from a low base score. However, households in NSW see their confidence eroded as prices slide in some post codes (the average small fall as reported does not represent the true variation on on the ground – some western Sydney suburbs have fallen 5-10% in the past few months). Households in QLD and SA on average have held their position this month.

Confidence  continues to vary by age bands, although the average scores have drifted lower again. Younger households are consistently less confident, compared with older households, who tend to have smaller mortgages relative to income, and more equity in property and greater access to savings.

Looking in more detail at the FCI scorecard, 63% of household saw no change in their job prospects last month, while 19% felt less secure, especially in WA and SA.  Those with savings were a little less comfortable, reflecting both a net reduction in the amount saved (more households are raiding their savings to cover their costs of living) and lower interest rates on deposits.  Those with shares and other investments benefited from higher stock prices.

The burden of debt weighed heavy on many households with 42% of households less comfortable with their debt, a rise of 1.4% in the month. Some were concerned about potential interest rate rises, while others, especially those on interest only loans, were exercised by the prospect of having to refinance down the track.

More than half of households say their real incomes have fallen in the past year, and 67% said their costs of living have risen, up 4.1% from last month. Utility bills are higher, as are child care costs and school fees. We see more household relying on multiple part-time jobs to bring in sufficient income to pay the bills, and even then many are having to tap into savings to keep afloat.

We see little evidence of income growth in real terms, while credit growth continues at more than three time income. Given the recent slide in property values, and continued rises in living costs, we do not expect the index to move back into positive territory in the next few months.

By way of background, these results are derived from our household surveys, averaged across Australia. We have 52,000 households in our sample at any one time. We include detailed questions covering various aspects of a household’s financial footprint. The index measures how households are feeling about their financial health. To calculate the index we ask questions which cover a number of different dimensions. We start by asking households how confident they are feeling about their job security, whether their real income has risen or fallen in the past year, their view on their costs of living over the same period, whether they have increased their loans and other outstanding debts including credit cards and whether they are saving more than last year. Finally we ask about their overall change in net worth over the past 12 months – by net worth we mean net assets less outstanding debts.

We will update the results again next month.


The Growing Gap Between Employment And Financial Security

The September update of the Digital Finance Analytics Household Finance Security Index, released today, underscores the growing gap between employment, which remains relatively strong, and the Financial Security of households.  We discussed this recently on ABC The Business. The Index fell from 98.6 in August to 97.5 in September.

This is below the 100 neutral setting, and continues the decline since December 2016.  Watch the video, or read the transcript.

The state by state view highlights a fall in NSW, while VIC holds higher, and there was a rise in WA from February 2017 lows. This highlights the fact the households across the national are under different levels of pressure.

Tracking by age bands we find younger households are significantly less confident, compared with those aged 50-60 years.  But across the board, the general trend is lower.

Property ownership remains a large factor, with those renting still below those owning property. We also see an ongoing decline in property investor confidence, thanks to tighter underwriting standards, higher mortgage rates, and the reduction in interest only loans availability.

Looking at the scorecard, there was a 4% fall in households comfortable with their savings, as they are forced to raid them to cover ongoing expenses (and the low returns on deposit balances as the banks seek to build margin).  There was a rise of nearly 3% of households who were uncomfortable with the amount of debt they hold, reflecting higher mortgage rates, especially on investment loans and interest only loans, and concerns about future rate movements. Finally, more households reported their overall net worth has deteriorated as home prices came under pressure.

The disconnect is that while people can, in the main, get some work, their earned income is not rising as fast as costs. We also find more households relying of a larger mix of fragmented part-time jobs, which tend to be less predictable.  As a result, we expect the current trends to continue, as momentum in the housing sector ebbs.  There is no obvious circuit breaker available in the current low interest rate, low growth environment.

By way of background, these results are derived from our household surveys, averaged across Australia. We have 52,000 households in our sample at any one time. We include detailed questions covering various aspects of a household’s financial footprint. The index measures how households are feeling about their financial health. To calculate the index we ask questions which cover a number of different dimensions. We start by asking households how confident they are feeling about their job security, whether their real income has risen or fallen in the past year, their view on their costs of living over the same period, whether they have increased their loans and other outstanding debts including credit cards and whether they are saving more than last year. Finally we ask about their overall change in net worth over the past 12 months – by net worth we mean net assets less outstanding debts.

We will update the results again next month.

Household Finance Confidence Weakens Again

Digital Finance Analytics has released the August 2017 edition of our Household Finance Confidence index, which uses data from our 52,000 household surveys and Core Market Model to examine trends over time. Overall, households scored 98.6, compared with 99.3 last month, and this continues the drift below the neutral measure of 100.  This is an average score, and there are significant variations within our various segments.

Watch the video to learn more, or read the transcript below:

Younger households are overall less confident about their financial status, whilst those in the 50-60 years age bands are most confident. This is directly linked to the financial assets held, including property and other investments, and relative incomes. Households over 60 years track quite closely to the national averages.

For the first time in more than a year, households in Victoria are more confident than those in NSW, while there was little relative change across the other states. One of the main reasons for the change in NSW can be traced directly to the state of the Investment Property sector, where we see a significant fall in the number of households intending to purchase in NSW, and more intending to sell. One significant observation is the rising number of investors selling in Sydney to lock in capital growth, and seeking to buy in regional areas or interstate. Adelaide is a particular area of interest.

Consistent with our earlier analysis, a household’s property owing status has a significant impact on their relative financial confidence, with owner occupied households the most confident, ahead of  property investors and those renting. That said, low rental growth rates mean more investors are underwater on a cash flow basis, especially in Victoria, where more than half are not covering the borrowing costs of their investment mortgage from rental receipts (but are still hopeful of capital gains, and they can offset the losses thanks to tax breaks). Actually returns are much stronger in QLD and TAS.

Looking at the scorecard, job security remained about the same this month, but there was a 1.7% fall in those more comfortable with their savings and a rise of 2.5% of those less comfortable – thanks to lower interest rates on deposits as banks seek to build margin.  The debt burden remained a concern, with a small rise in those worried about meeting repayments on outstanding loans.  Incomes are still under pressure, with more saying their incomes in real terms have been devalued, down 1%, to 52% of households.  Costs of living continue to rise for 63% of households, and only 7% saw a fall. 65% of households said their overall  net worth rose again, thanks mainly, to home prices rising. Some in WA, QLD and WA reported a fall, directly due to house values continuing to slip.

Given the fact that the dynamics of the economy seem to be locked in place with lower income growth, rising costs of living, and the property market adjusting to the new regulatory environment, we expect confidence to continue to drift lower in the months ahead. There is no obvious circuit breaker available in the current low interest rate, low growth environment. The leading indicators suggest that the recent positive momentum in the property market may be short lived.

By way of background, these results are derived from our household surveys, averaged across Australia. We have 52,000 households in our sample at any one time. We include detailed questions covering various aspects of a household’s financial footprint. The index measures how households are feeling about their financial health. To calculate the index we ask questions which cover a number of different dimensions. We start by asking households how confident they are feeling about their job security, whether their real income has risen or fallen in the past year, their view on their costs of living over the same period, whether they have increased their loans and other outstanding debts including credit cards and whether they are saving more than last year. Finally we ask about their overall change in net worth over the past 12 months – by net worth we mean net assets less outstanding debts.

We will update the results again next month.

Household Finance Confidence Continues To Fall

Digital Finance Analytics has released the July results from our Household Finance Confidence Index, which shows a further fall, with momentum decaying.

The average score was 99.3, down from 99.8 last month and below the neutral setting. However, the average score masks significant differences across the dimensions of the survey results. For example, younger households are considerably more negative, compared with older groups.

This is strongly linked with property owning status, with those renting well below the neutral setting (and more younger households rent these days), whilst owner occupied home owners are significantly more positive. We also see a fall in the confidence of property investors, relative to owner occupied owners.

Across the states,  we see a small decline in confidence in NSW from a strong starting point, whilst VIC households were more confident in July.

The driver scorecard shows little change in job security expectations, but lower interest rates on deposits continue to hit savings. Households are more concerned about the level of debt held, as interest rate rises bite home. The impact of flat or falling incomes registers strongly, with more households saying, in real terms they are worse off. Costs of living are rising fast, with the changes in energy prices, child care costs and council rates all hitting hard. That said, the continued rises in home prices, especially in the eastern states meant that net worth for households in these states rose again, which was not the case in WA, NT or SA.

Sentiment in the property sector is clearly a major influence on how households are feeling about their finances, but the real dampening force is falling real incomes and rising costs. As a result, we still expect to see the index fall further as we move into spring, as more price hikes come through. In addition, the raft of investor mortgage rate repricing will hit, whilst rental returns remain muted.

By way of background, these results are derived from our household surveys, averaged across Australia. We have 52,000 households in our sample at any one time. We include detailed questions covering various aspects of a household’s financial footprint. The index measures how households are feeling about their financial health. To calculate the index we ask questions which cover a number of different dimensions. We start by asking households how confident they are feeling about their job security, whether their real income has risen or fallen in the past year, their view on their costs of living over the same period, whether they have increased their loans and other outstanding debts including credit cards and whether they are saving more than last year. Finally we ask about their overall change in net worth over the past 12 months – by net worth we mean net assets less outstanding debts.


Household Finance Confidence Breaks Down

Digital Finance Analytics has today released the Household Finance Confidence index to June 2017, and the news is not good. Overall the index has dropped below the neutral setting and appears to be trending lower. The current reading is 99.8% compared with 100.6 in May.

The fall is being driven by a confluence of issues, none new, but now writ large. Households are seeing the costs of living rising (especially power costs, child care costs and council rates), whilst household income remains depressed and is falling in real terms. Returns on deposits actually fell as well, so mortgage repricing is not being matched by better saving rates. The costs of mortgage repayments rose.

The most significant fall in confidence was in the property investor segment, where loan repricing has been more pronounced, whilst rental incomes are hardly growing. They are also concerned about slowing capital appreciation. However it is still true that property owners have their confidence buttressed relative to property inactive households who are more likely to be renting, and see no rise in their net worth.

Looking across the states, confidence is still highest in the booming states of NSW and VIC, though down a bit; whilst WA is recovering a little from lows earlier in the year.

Looking at the scorecard, households are more concerned about the amount of debt they hold, real incomes continue to fall and costs of living continue to rise. This despite job security not being a major concern. Take home pay however is.

We expect to see the index fall further as we move into spring, as more price hikes come though (e.g 20% uplift in electricity for many). The raft of mortgage rate repricing still has to work though and income growth will remain contained. Sentiment in the property sector is clearly a major influence on how households are felling about their finances, but the real dampening force is falling real incomes.

By way of background, these results are derived from our household surveys, averaged across Australia. We have 52,000 households in our sample at any one time. We include detailed questions covering various aspects of a household’s financial footprint. The index measures how households are feeling about their financial health. To calculate the index we ask questions which cover a number of different dimensions. We start by asking households how confident they are feeling about their job security, whether their real income has risen or fallen in the past year, their view on their costs of living over the same period, whether they have increased their loans and other outstanding debts including credit cards and whether they are saving more than last year. Finally we ask about their overall change in net worth over the past 12 months – by net worth we mean net assets less outstanding debts.


Household Financial Confidence Waned In May

The results from the latest Digital Finance Analytics Household Finance Confidence Index to end May 2017 is released today, and shows a lower overall score of 100.6, down from 101.5 last month. This is firmly in the neutral zone, but households with mortgages are feeling the pinch and the index is set to go lower in months ahead.

Both property investors and owner occupiers are more concerned about rising mortgage interest rates, and potentially falling property prices. There was less change in households who are property inactive, which shows how the dynamics of property is directly influencing confidence, but this group has a lower level of confidence to start with.

The biggest slide was in NSW, where the overall score is still the highest across the states, but is turning lower. Talk of lower prices, is hitting confidence. WA confidence is rising a little, but from a low baseline and there were small rises in QLD and SA.

Looking at the scorecard which drives the index, we see households have become a little more concerned about future job prospects, are less comfortable with savings returns, but significantly more concerned about the debt burden they are carrying in the context of falling real incomes, whilst costs of living continue to spiral higher. This despite net worth still rising for many.

Sentiment in the property sector is clearly a major influence on how households are felling about their finances, but the real dampening force is falling real incomes. This is unlikely to correct any time soon, so we expect continued weakness in the index as we go into winter.

By way of background, these results are derived from our household surveys, averaged across Australia. We have 52,000 households in our sample at any one time. We include detailed questions covering various aspects of a household’s financial footprint. The index measures how households are feeling about their financial health. To calculate the index we ask questions which cover a number of different dimensions. We start by asking households how confident they are feeling about their job security, whether their real income has risen or fallen in the past year, their view on their costs of living over the same period, whether they have increased their loans and other outstanding debts including credit cards and whether they are saving more than last year. Finally we ask about their overall change in net worth over the past 12 months – by net worth we mean net assets less outstanding debts.

Household Finance Security Wobbles Again In April

Today we release the latest monthly edition of our household finance confidence index for April 2017, which show a fall from 102.5 to 101.5, just above the neutral setting.

The index is drive from the results of our household surveys, and highlights some important movements, mostly related to the recent changes in the property market.

Property Investor levels of confidence weakened, thanks to rising mortgage interest rates and concerns about property prices and pre-budget speculation about changes to negative gearing. In fact owner occupier households are now more confident than investors. As usual households without property interests have a significantly lower level of confidence about their financial status.

The results by state shows that NSW leads the way, with households there still enjoying the glow of stronger employment and economic growth, to say nothing of high home prices. More people of course own property than not. VIC continues to weaken, costs of living appear to be accelerating there (especially child care and school fees, plus energy and council rates). Most other states saw a small rise, though from a position below the 100 neutral point. The divergence across the states is becoming more extreme.

Looking at the scorecards, whilst job security is about the same, households were less comfortable with their savings, and debt. Mortgage rate rises are working their way through, and many households with deposits in the bank are still seeing lower returns.

Falling real incomes are a strong factor in the mix, together with rising costs of living. these combined explain the rise in mortgage stress. Net worth is still improving thanks to home price appreciation, other than in WA, regional QLD and TAS.

By way of background, these results are derived from our household surveys, averaged across Australia. We have 52,000 households in our sample at any one time. We include detailed questions covering various aspects of a household’s financial footprint. The index measures how households are feeling about their financial health. To calculate the index we ask questions which cover a number of different dimensions. We start by asking households how confident they are feeling about their job security, whether their real income has risen or fallen in the past year, their view on their costs of living over the same period, whether they have increased their loans and other outstanding debts including credit cards and whether they are saving more than last year. Finally we ask about their overall change in net worth over the past 12 months – by net worth we mean net assets less outstanding debts.