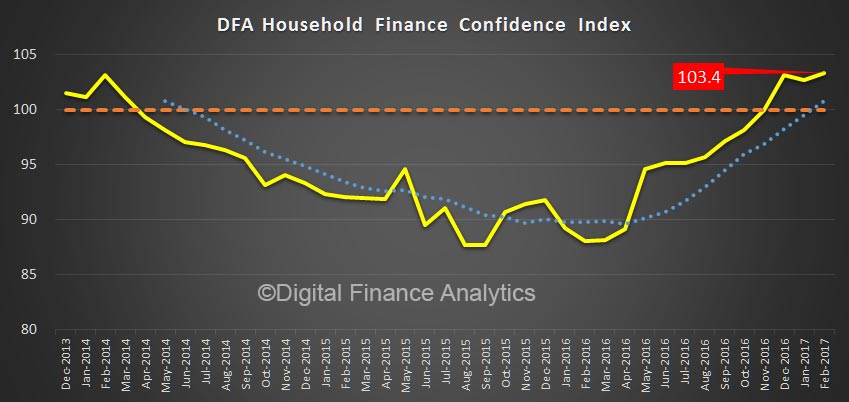
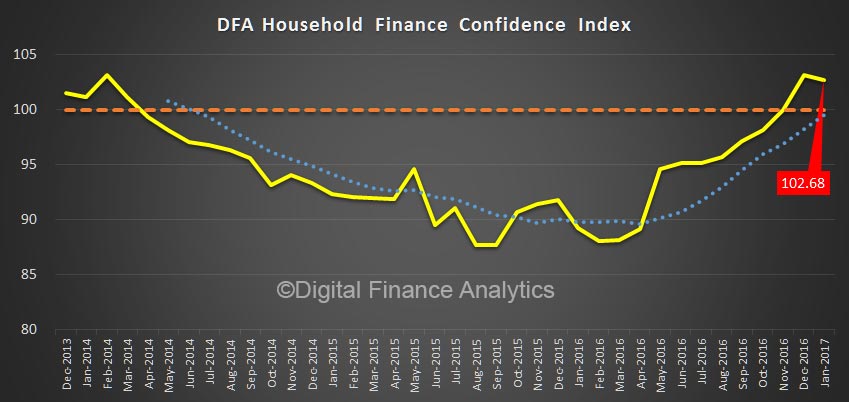
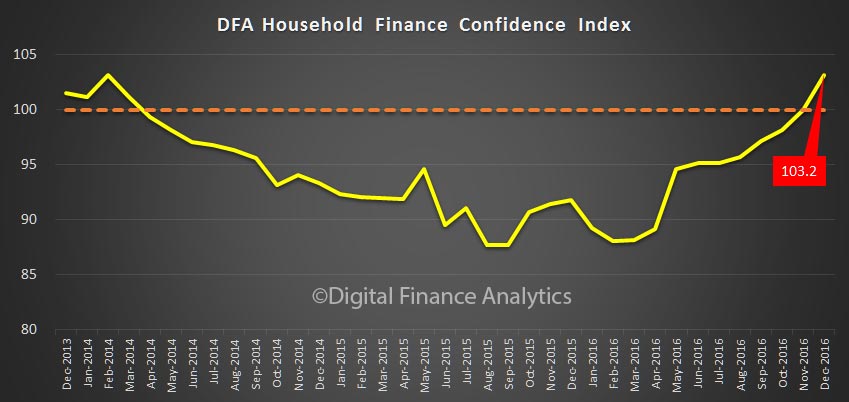
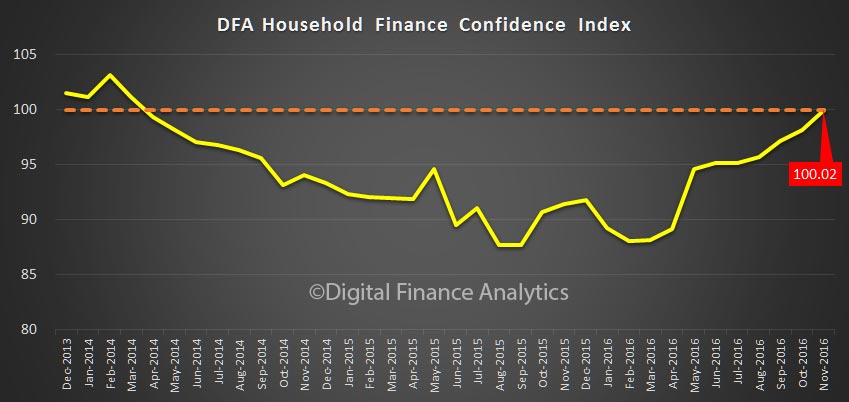
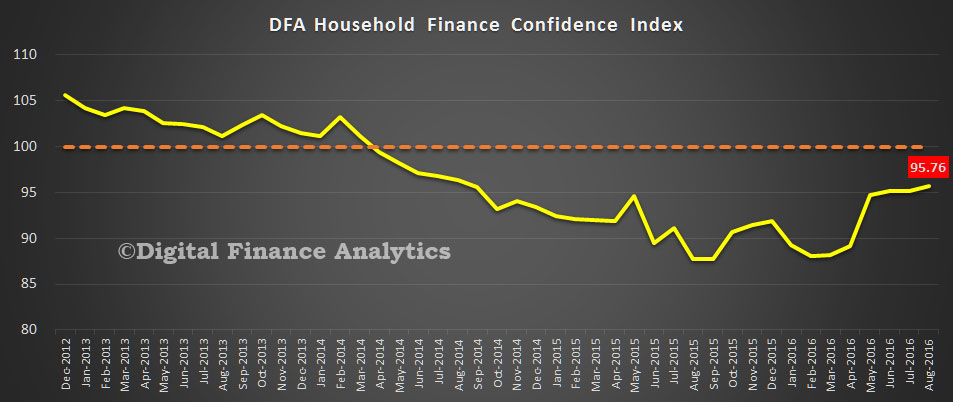
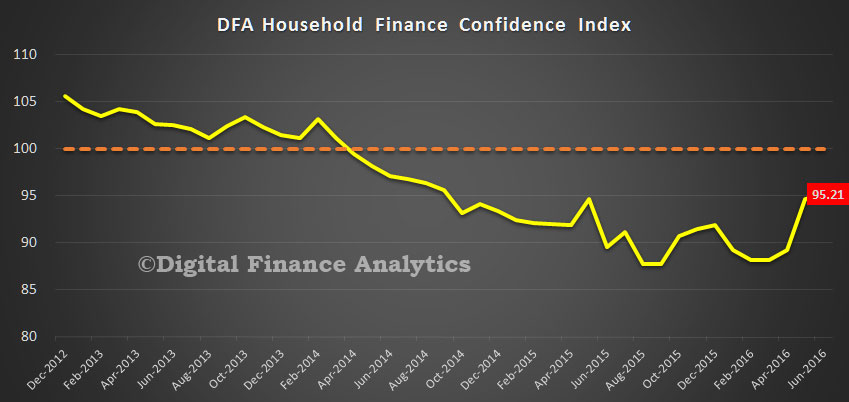
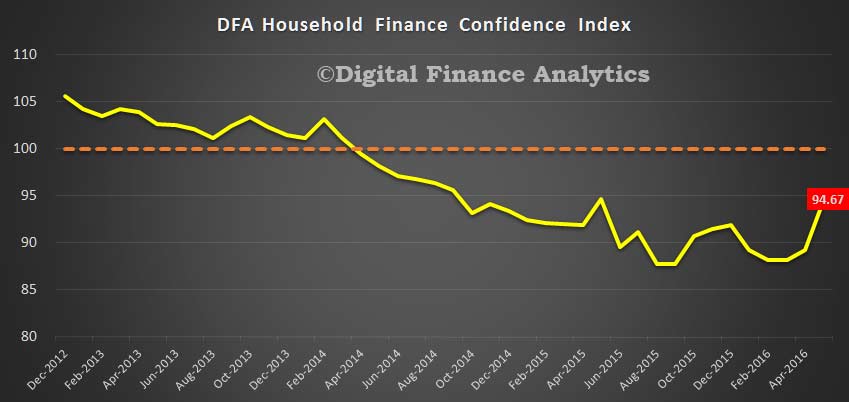
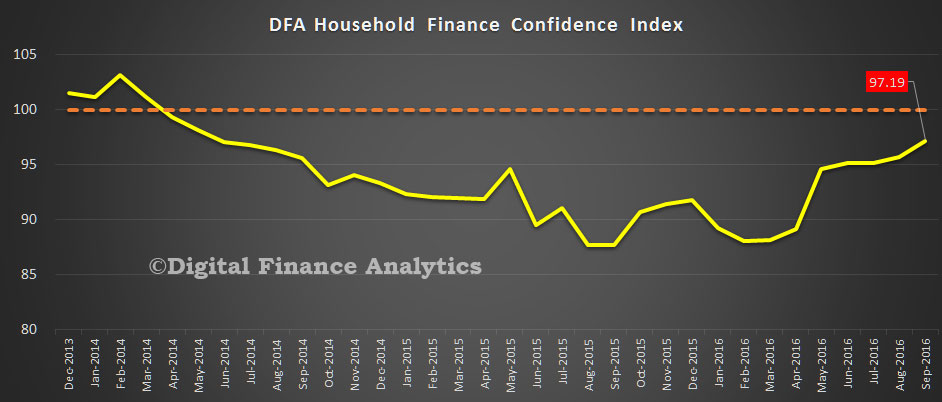
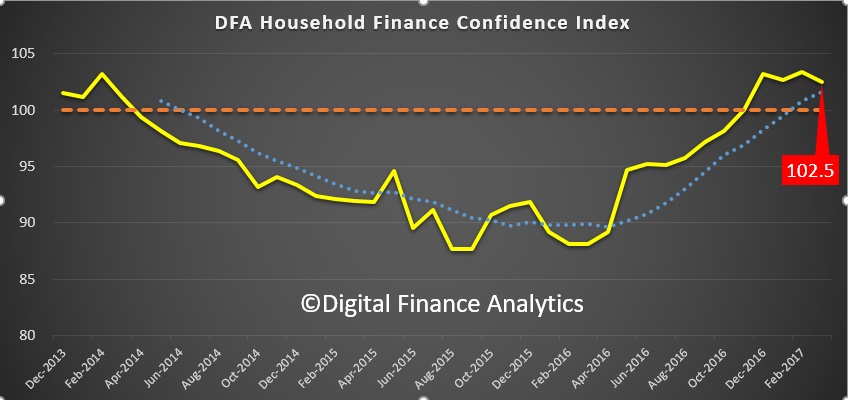
The latest edition of the Digital Finance Analytics Household Finance Confidence Index (FCI) to end September 2016 is released today. Using data from our household surveys we examine how households regard their overall financial position. The composite index rose from 95.8 in August to 97.2 in September, the highest reading for a couple of years, though still just below its 100 neutral setting. It is dragged down by households excluded from the property market.
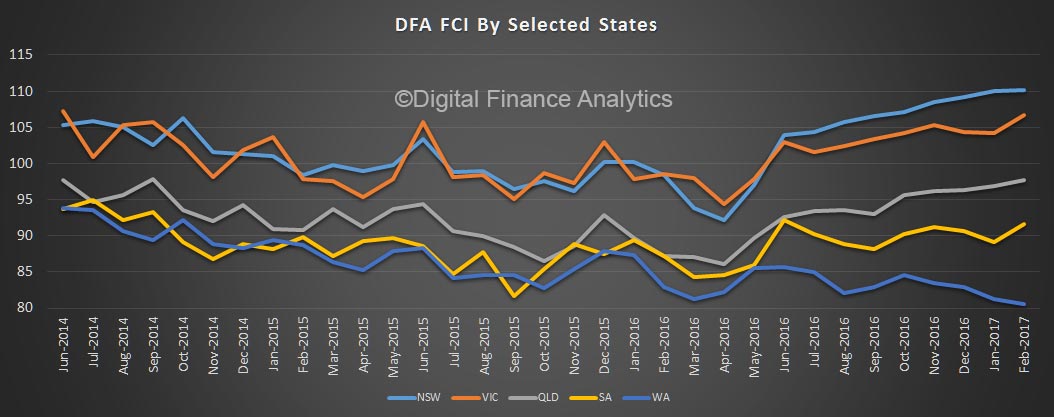
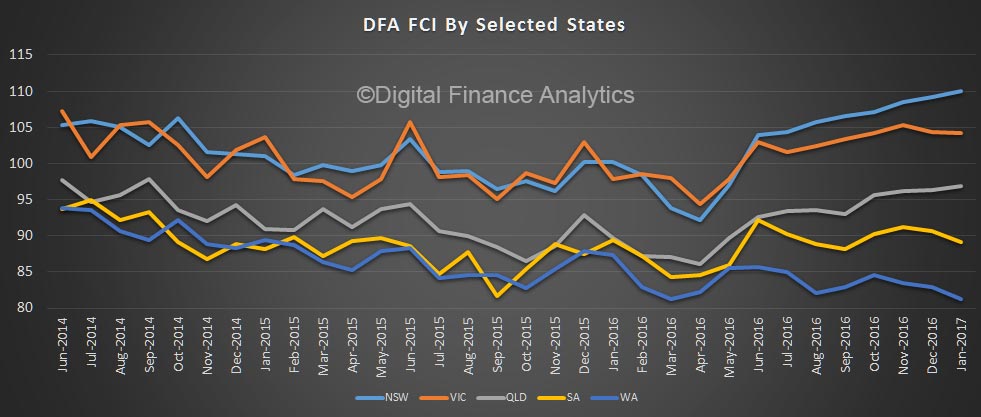
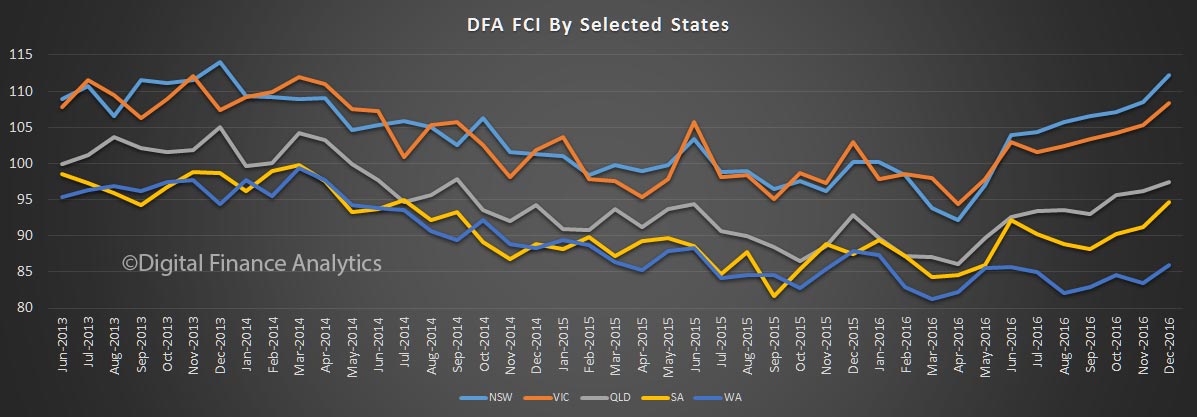
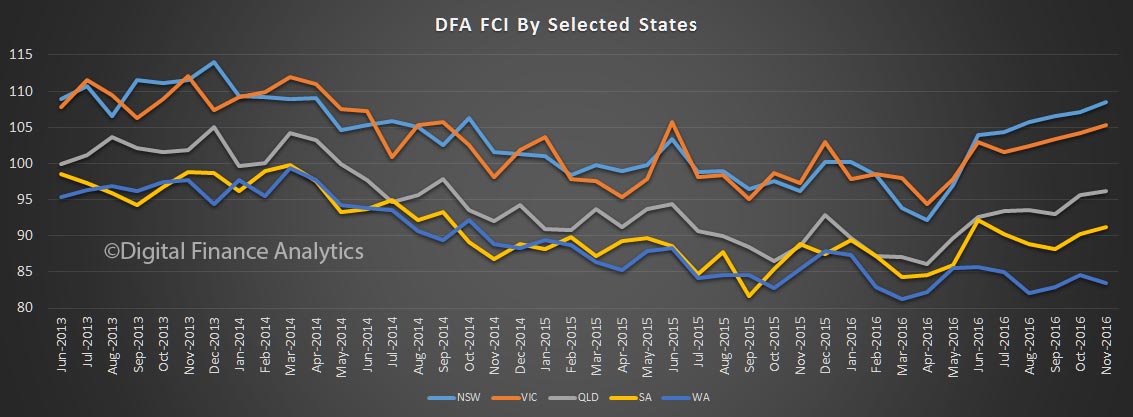
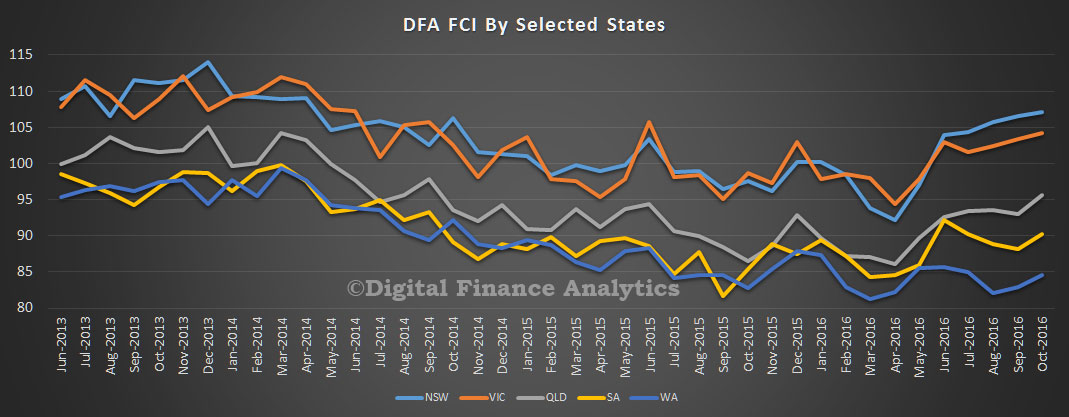
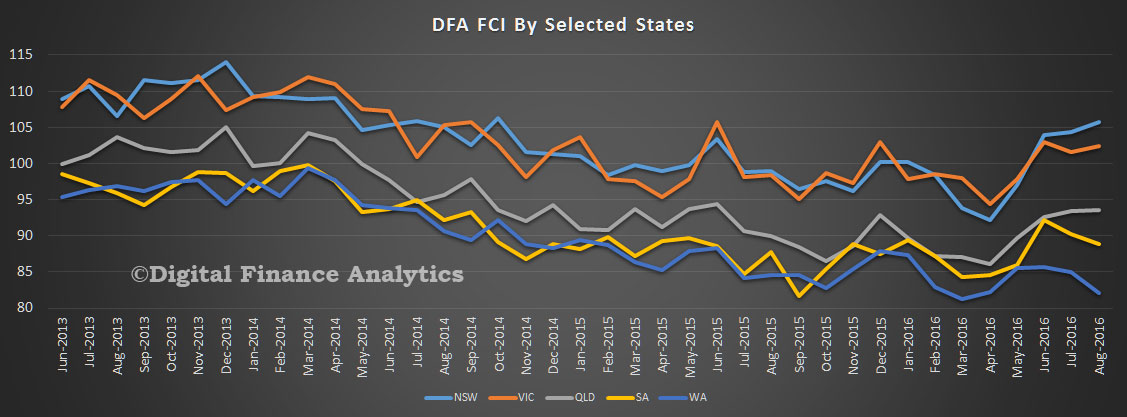
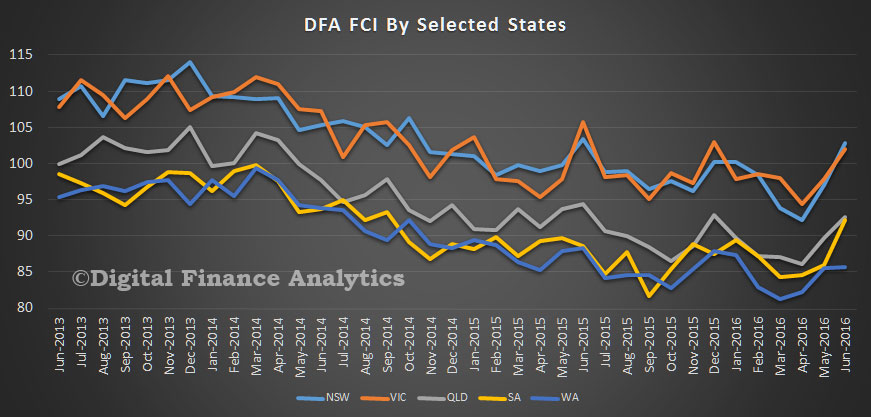
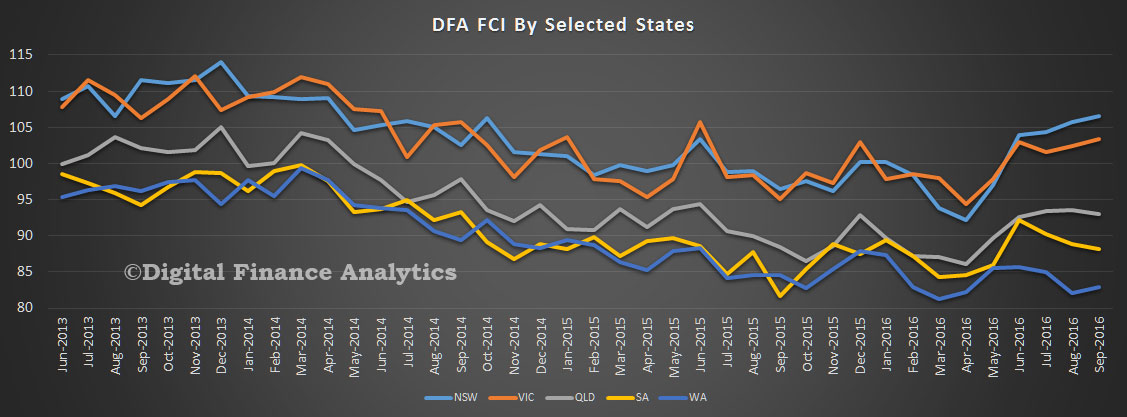
 This average national score masks some important differences. First, the score varies by state. Households in NSW and VIC are now above the neutral setting, thanks to improving job prospects, rising home prices, and lower interest rates on mortgages. With stock markets on the rise, the only negative indicator in these states is low returns on bank savings (which is encouraging more to look at investment property) and high debt. Costs of living, though rising, seem largely manageable.
There is a different story in WA and SA, where unemployment is a higher risk, property prices are muted, and debt remains high. QLD sits between the two extremes, with households in and around Brisbane mirroring the results in NSW, whilst regional QLD is mirroring WA; a state divided. In these states, costs of living are more of a concern.
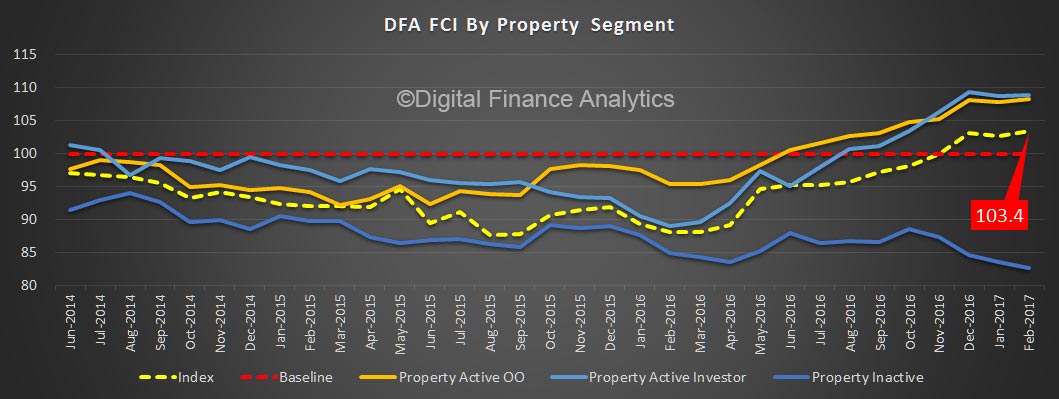
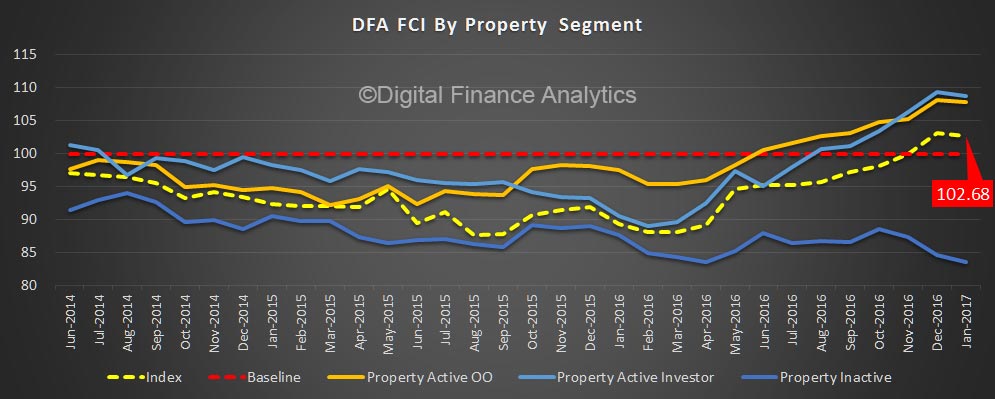
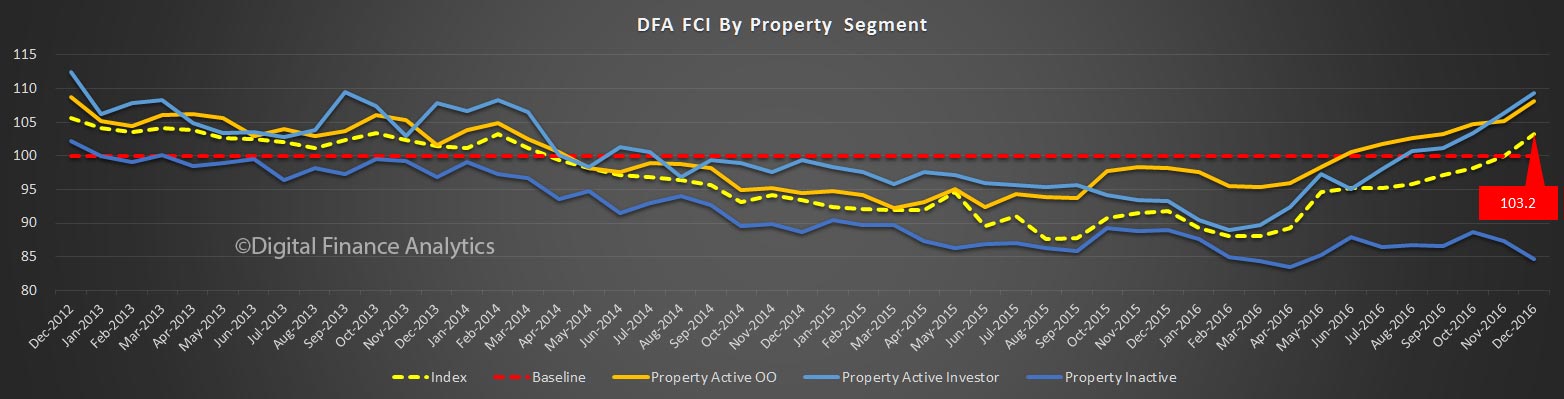
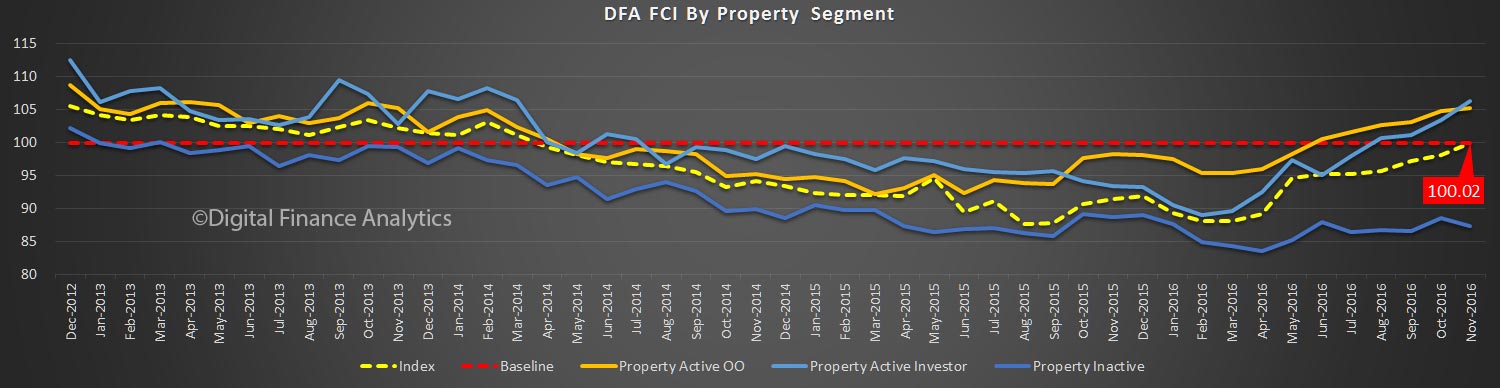
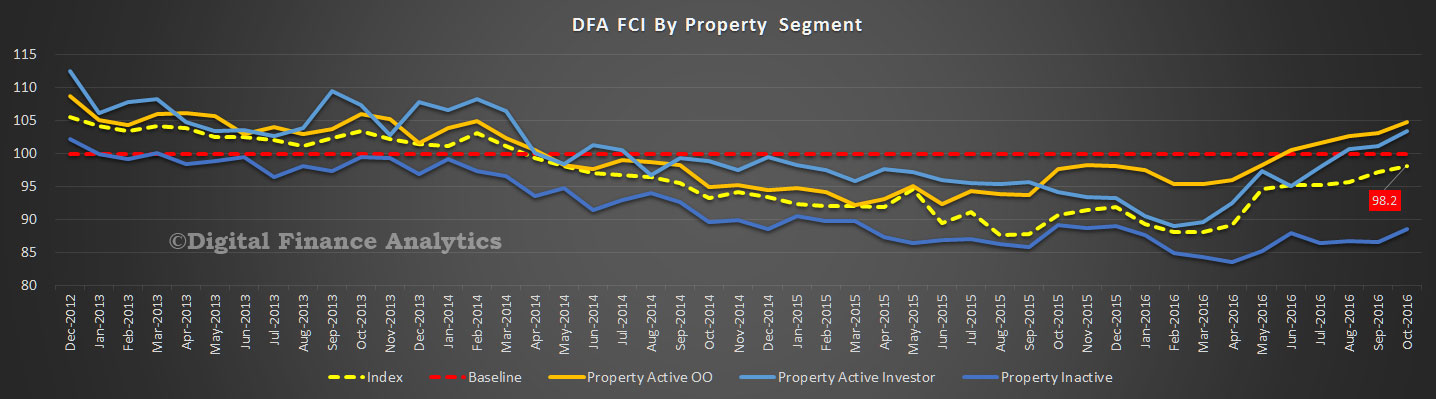
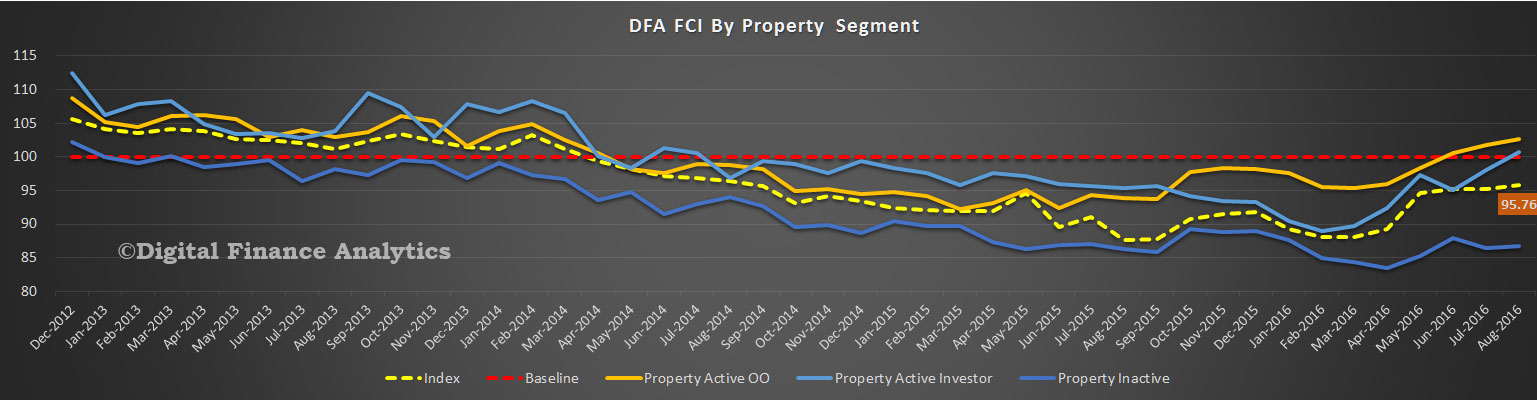
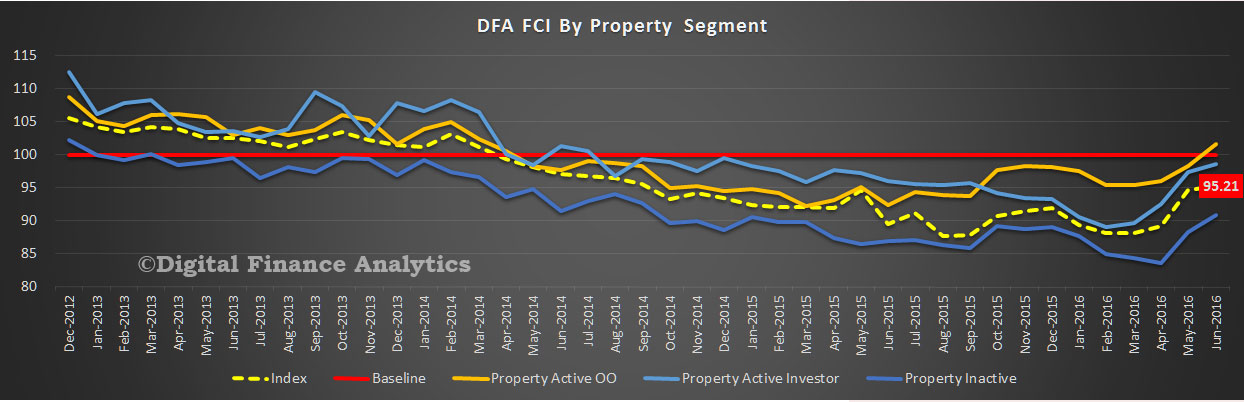
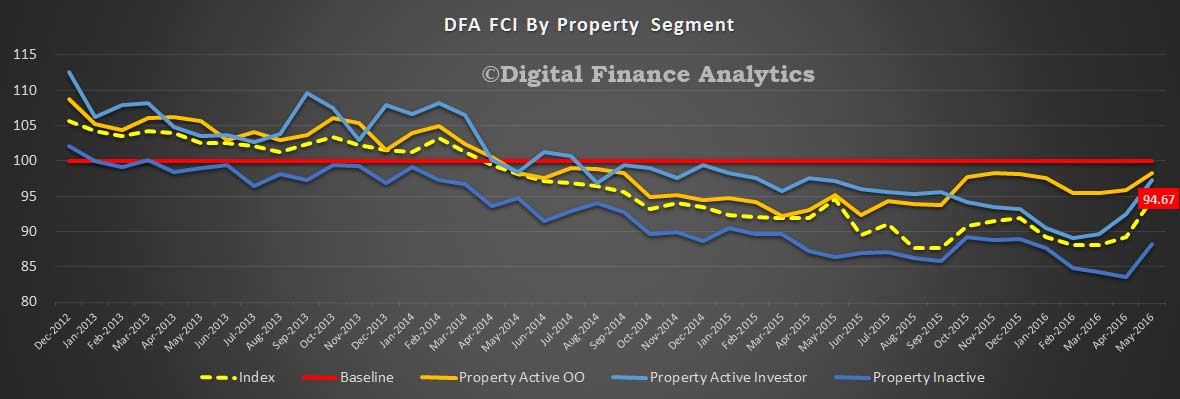
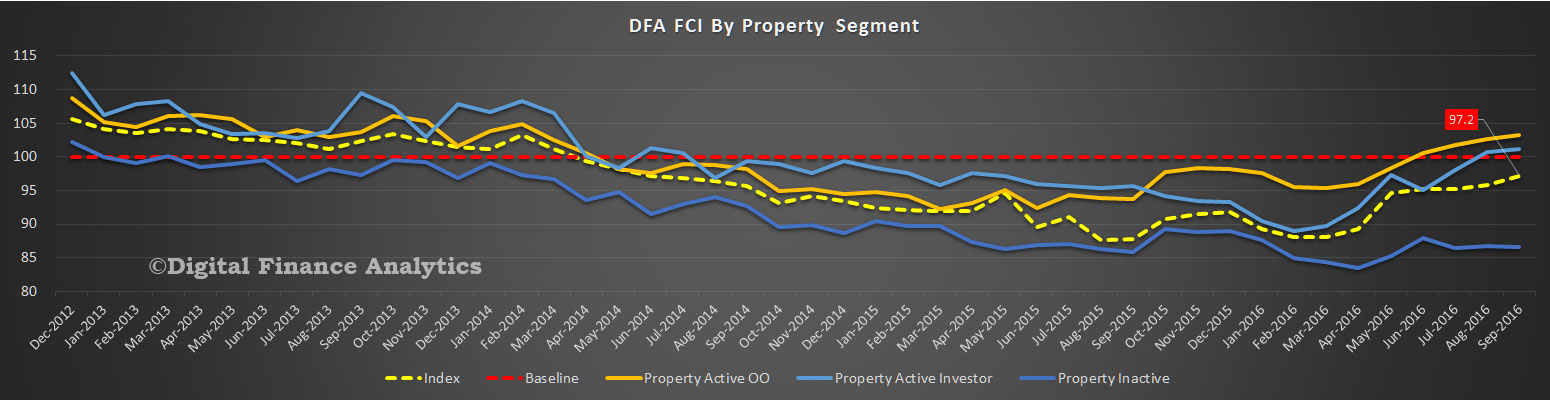
 Looking at the results by property owning segmentation, owner occupied home owners are the most positive about their financial position, thanks to the increasing wealth effect of rising home prices, in an ultra-low interest rate environment. Property investors are increasingly confident, thanks to better than expected capital values, lower interest rates and no disruption to capital gains or negative gearing policy. The only shadow on their horizon is flat rental incomes and poor tenant behaviour.
However, one quarter of households are property inactive – mainly in rental accommodation, or living with friends or family. They are excluded from the wealth effect of property. With incomes static, the costs of rent, alongside other costs of living, kept their scores much lower (and indeed take the national average below its neutral setting). Take property inactive households out of the equation, and the remaining groups would be well above the neutral setting. Your property owning status determines your wealth footprint – no wonder people aspire to get on the property ladder, at almost any cost!
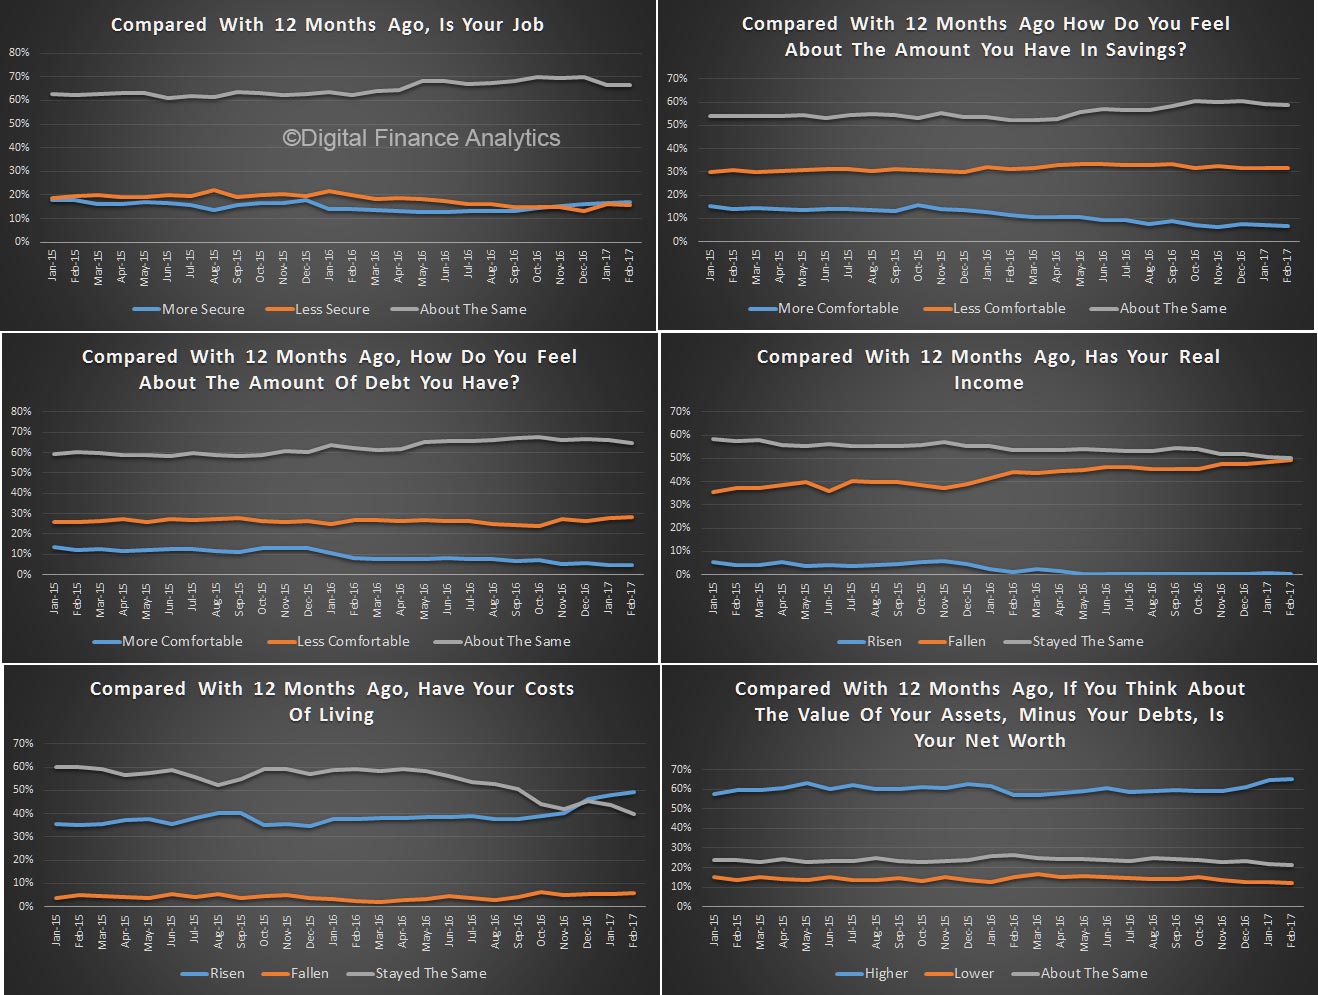
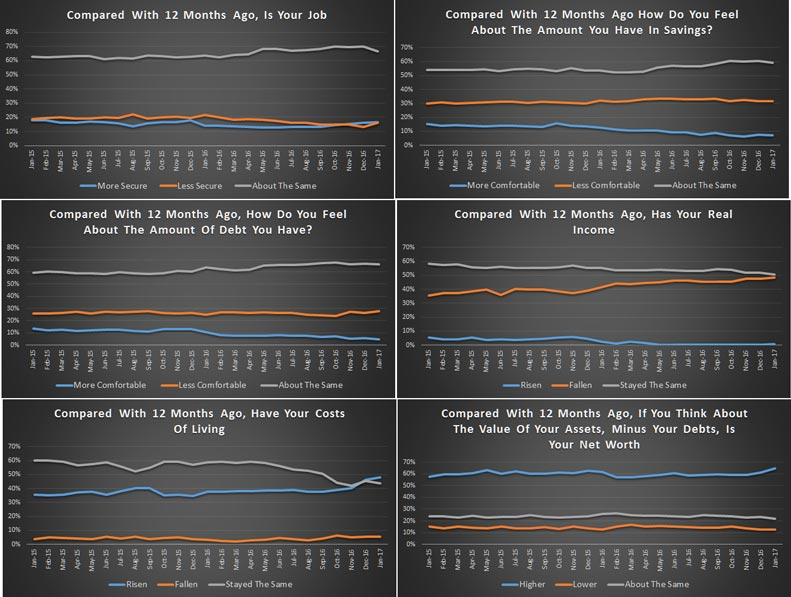
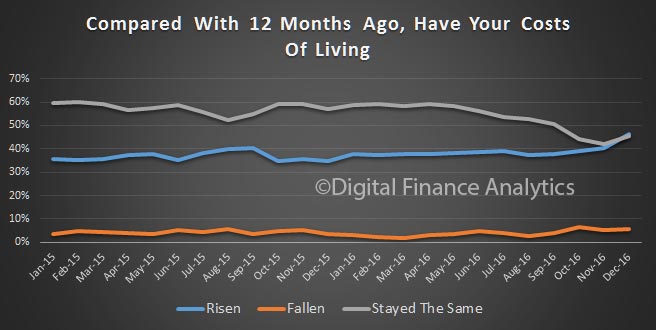
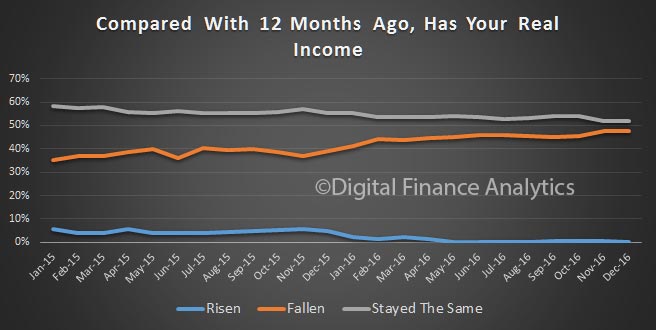
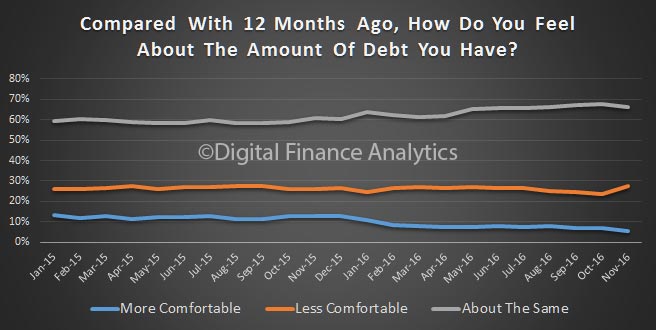
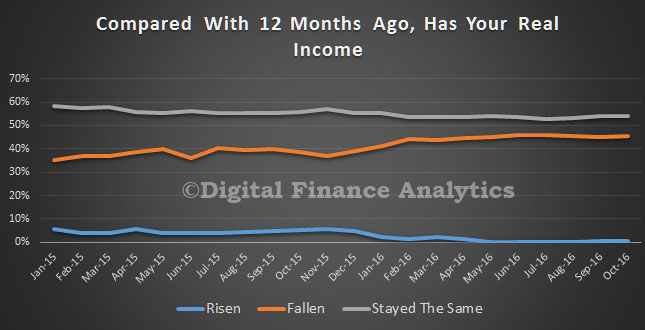
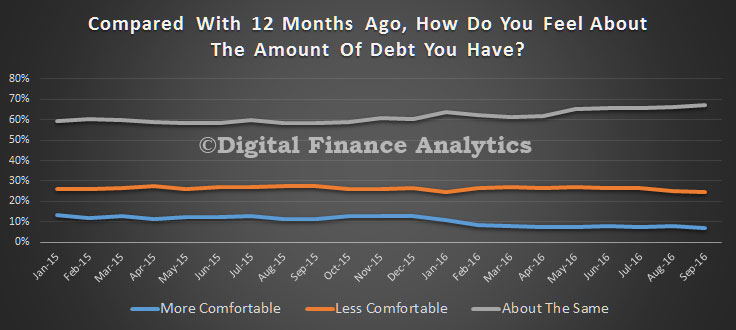
 Finally, we look at one of the specific dimensions in the survey. This month we look at debt exposure. Two thirds of borrowing households are as comfortable with the debts they hold as a year ago (bigger debts, but lower interest rates). Around 7% are more comfortable than a year ago, and 24% less comfortable, driven by finding it more difficult to service their debts in a low income growth, high cost growth environment. Remember, interest rates are very low at the moment, so this level of debt pressure remains a concern. If rates were to rise, pressure on these households would rise, fast.
 By way of background, these results are derived from our household surveys, averaged across Australia. We have 26,000 households in our sample at any one time. We include detailed questions covering various aspects of a household’s financial footprint. The index measures how households are feeling about their financial health. To calculate the index we ask questions which cover a number of different dimensions. We start by asking households how confident they are feeling about their job security, whether their real income has risen or fallen in the past year, their view on their costs of living over the same period, whether they have increased their loans and other outstanding debts including credit cards and whether they are saving more than last year. Finally we ask about their overall change in net worth over the past 12 months – by net worth we mean net assets less outstanding debts.

 Looking at the property segments, we find that whilst owner occupied households are a little more confident, property investor confidence fell, thanks to the recent noise about rising mortgage rates, possible changes to tax breaks and questions about future capital gains.
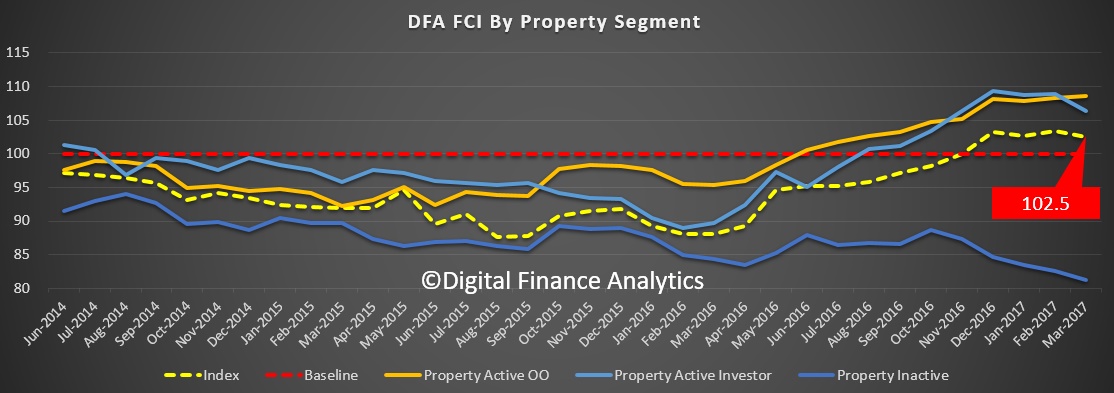 Looking across the states, confidence remains highest in NSW, but fell slightly in VIC. There were slight improvements in the other states.
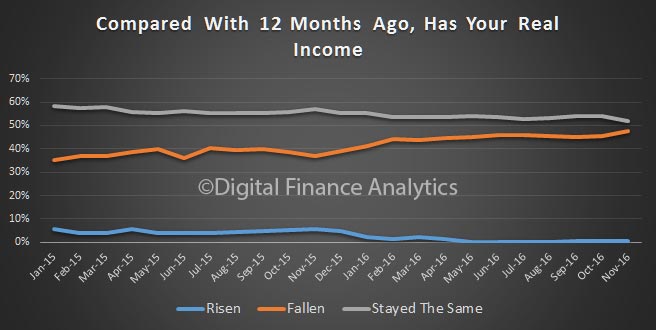
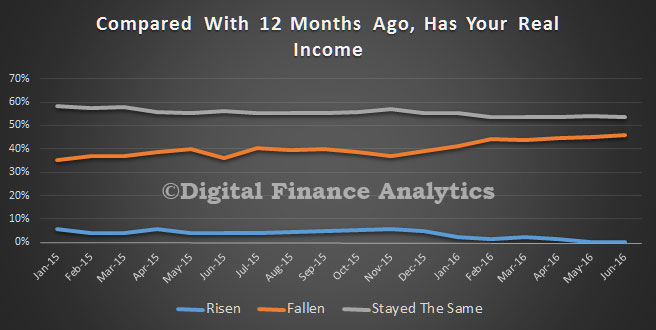
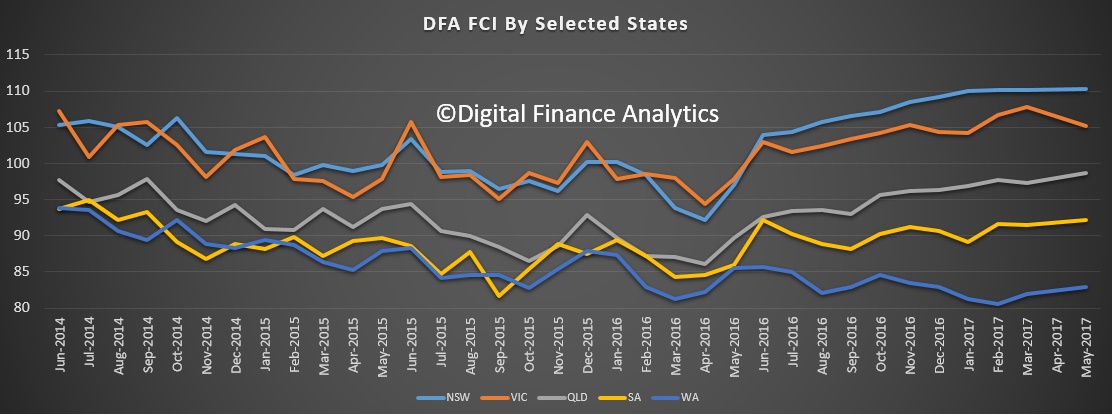 Here is the scorecard which drives the index. Most striking is the fall in real incomes and small rises in concerns about job security. As interest rates rise, more households are concerned about debt. Despite this, property owning households saw their net worth rise.
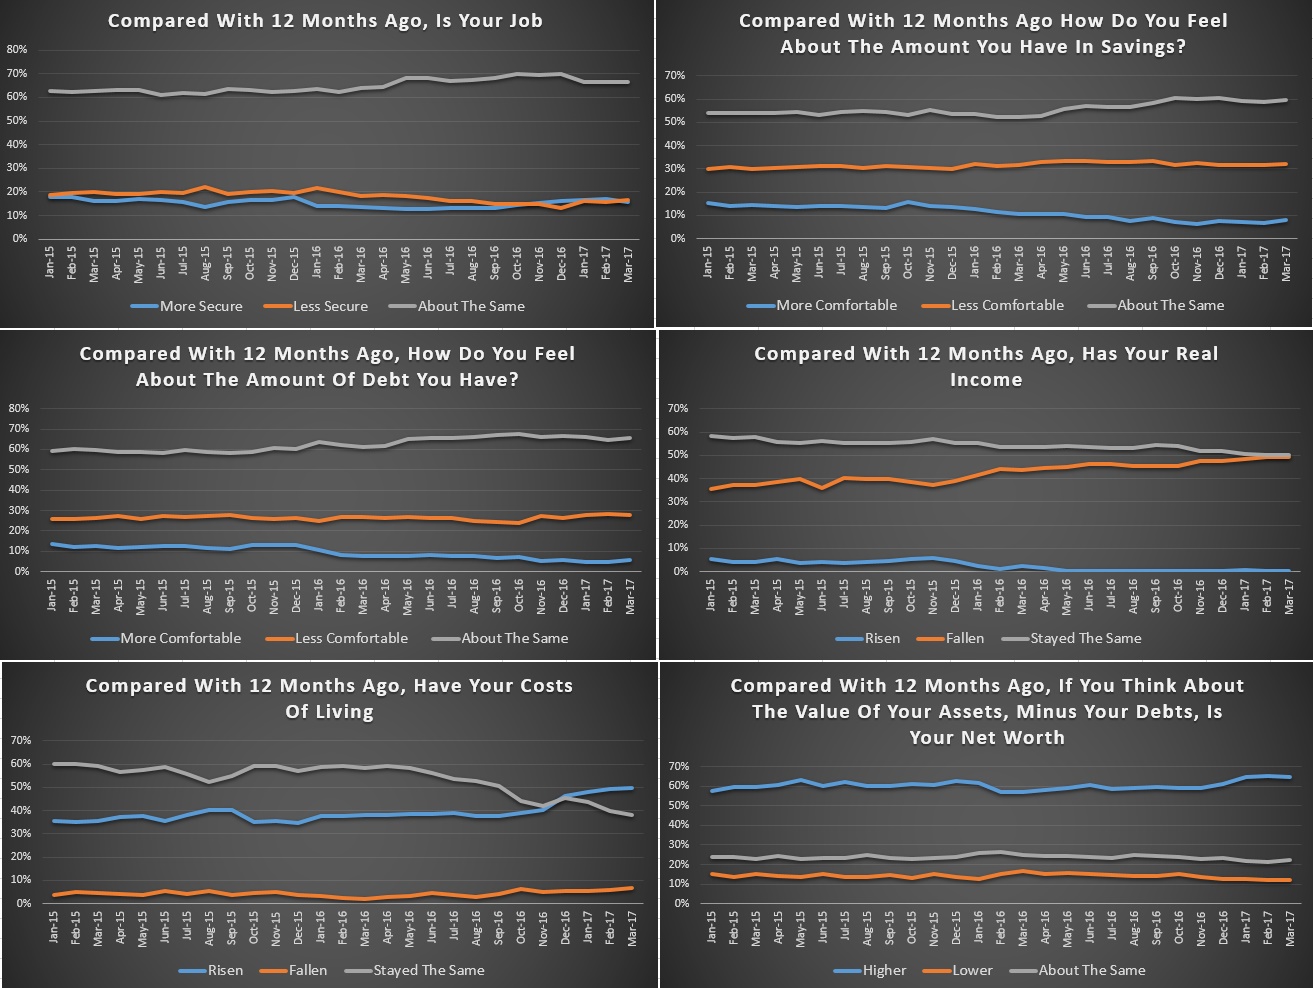 By way of background, these results are derived from our household surveys, averaged across Australia. We have 52,000 households in our sample at any one time. We include detailed questions covering various aspects of a household’s financial footprint. The index measures how households are feeling about their financial health. To calculate the index we ask questions which cover a number of different dimensions. We start by asking households how confident they are feeling about their job security, whether their real income has risen or fallen in the past year, their view on their costs of living over the same period, whether they have increased their loans and other outstanding debts including credit cards and whether they are saving more than last year. Finally we ask about their overall change in net worth over the past 12 months – by net worth we mean net assets less outstanding debts.