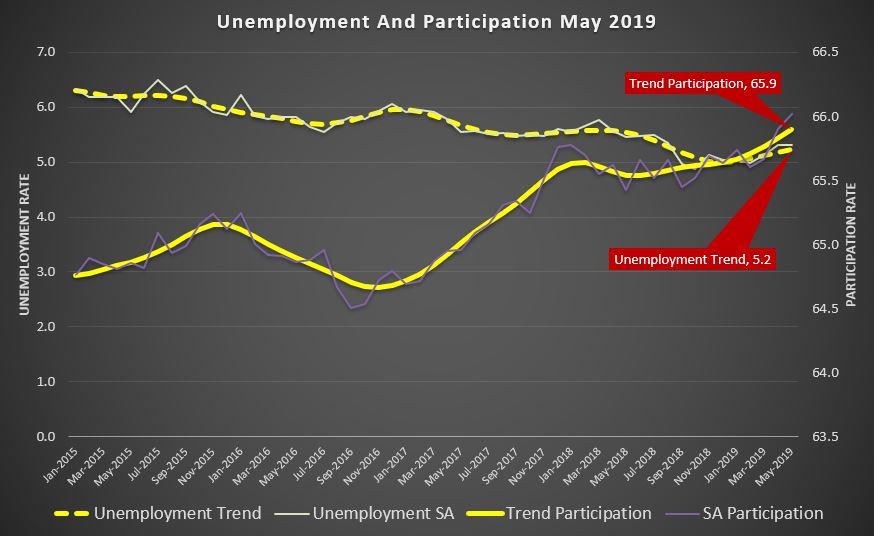
The trend unemployment rate remained steady at 5.1 per cent, for the third consecutive month. The seasonally adjusted unemployment rate remained steady at 5.2 per cent in May 2019 . But the moving parts are not so hot.
Underemployment was up, to 8.6%, while the total hours worked fell, -0.3%. There was a rise in jobs by 42,300, mainly part-time employment, which helps to explain the rising underemployment. But the results are muddied by ABS sample rotation AND temporary work associated with the election, so watch next month….
Australia’s trend participation rate increased to 65.9 per cent in May 2019, a new high, according to the latest information released by the Australian Bureau of Statistics (ABS).
ABS Chief Economist Bruce Hockman said: “Australia’s participation in the labour force continues to rise with the participation rate up 0.4 percentage points over the past year to an all-time high of 65.9 per cent.”
“The participation rate for people aged 15-64 also climbed to a record rate of 78.4 per cent, with a record 74.3 per cent of people in this age group employed,” Mr Hockman said.
The trend unemployment rate remained steady at 5.1 per cent, for the third consecutive month.
Employment and hours
In May 2019, trend monthly employment increased by around 28,000 persons. Both full-time and part-time employment increased by 14,000 persons.
Over the past year, trend employment increased by 333,000 persons (2.7 per cent) which was above the average annual growth over the past 20 years (2.0 per cent).
The trend monthly hours worked increased by 0.2 per cent in May 2019 and by 2.5 per cent over the past year. This was above the 20 year average year-on-year growth of 1.7 per cent.
Underemployment and underutilisation
The trend monthly underemployment rate rose slightly to 8.5 per cent in May, returning to the same level as May 2018. The trend underutilisation rate decreased by 0.3 percentage points over the year.
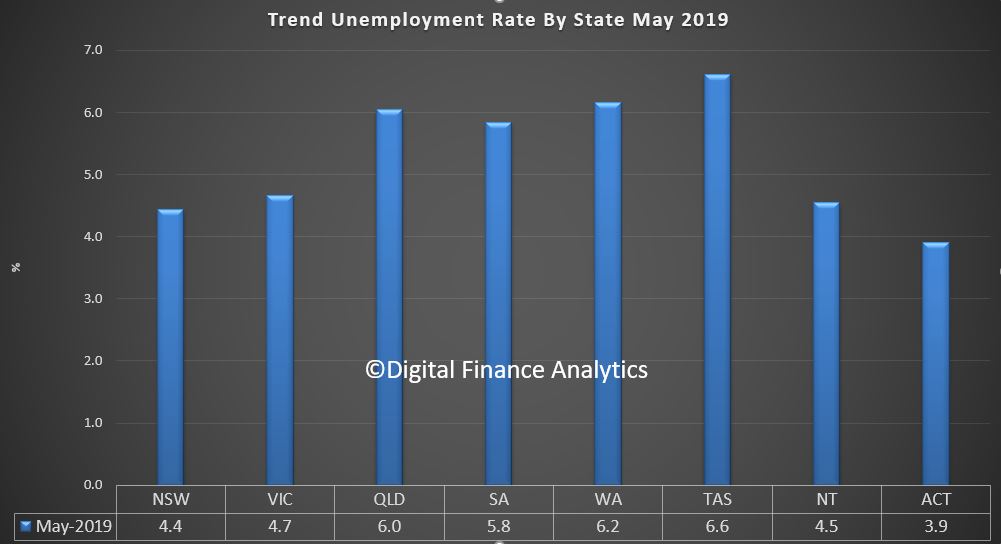
States and territories trend unemployment rate
The trend unemployment rate increased by 0.1 percentage points in the Australian Capital Territory, and remained steady in all other states and territories.
“Over the year, unemployment rates fell in New South Wales, Victoria, Queensland and Western Australia, and increased in South Australia, Tasmania, the Northern Territory and the Australian Capital Territory,” Mr Hockman said. Seasonally adjusted data
The seasonally adjusted unemployment rate remained steady at 5.2 per cent in May 2019, while the underemployment rate increased by less than 0.1 percentage points to 8.6 per cent. The seasonally adjusted participation rate increased by 0.1 percentage points to 66.0 per cent, and the number of persons employed increased by around 42,000.
The net movement of employed persons in both trend and seasonally adjusted terms is underpinned by around 300,000 people entering and leaving employment in the month.
The ABS has reported that Australia’s trend estimate of employment increased by 20,700 persons in March 2019, with:
the number of unemployed persons increasing by 3,000 persons;
the unemployment rate remaining steady at 5.0%;
the underemployment rate remaining steady at 8.2%;
the underutilisation rate remaining steady at 13.2%;
the participation rate remaining steady at 65.6%; and
the employment to population ratio remaining steady at 62.4%.
Over the past year, trend employment increased by 299,100 persons (or
2.4%), which was above the average annual growth rate over the past 20
years of 2.0%. Over the same 12 month period the trend employment to
population ratio, which is a measure of how employed the population
(aged 15 years and over) is, increased by 0.4 percentage points (pts) to
62.4%.
Trend employment increased by 20,700 persons between February and March
2019. This represents an increase of 0.16%, similar to the monthly
average growth rate over the past 20 years (0.17%), and less than the
monthly average growth rate over the past five years (0.22%).
Underpinning these net changes in employment is extensive dynamic
change, which occurs each month in the labour market. In recent months
there has been around 300,000 people entering and leaving employment.
There is also further dynamic change in the hours that people work,
which results in changes in the full-time and part-time composition of
employment.
Trend full-time employment increased by 18,000 persons between February
and March 2019, and part-time employment increased by 2,700 persons.
Compared to a year ago, there are 252,800 more persons employed
full-time and 46,300 more persons employed part-time. This compositional
shift led to a decrease in the part-time share of employment over the
past 12 months, from 31.7% to 31.3%.
The trend estimate of monthly hours worked in all jobs increased by 4.3
million hours (or 0.2%) in March 2019, to 1,776.8 million hours. Monthly
hours worked increased by 2.4% over the past year, equal to the
increase in employed persons (2.4%). The average hours worked per
employed person was 138.9 hours per month, or around 32.0 hours per
week.
The trend unemployment rate remained steady at 5.0% in March 2019. The
number of unemployed persons increased by 3,000 to 675,700 persons. Over
the past year, the trend unemployment rate decreased by 0.5 pts, with
the number of unemployed decreasing by 51,100 persons.
The trend participation rate remained steady at 65.6% in March 2019,
which was equal to March 2018 (65.6%). The female participation rate
remained steady at 60.6% and the male participation rate remained steady
at 70.9%.
The labour force includes the total number of employed and unemployed
persons. Over the past year, the labour force increased by 248,000
persons (1.9%). This rate of increase was above the rate of increase for
the total Civilian Population aged 15 years and over (360,500 persons,
or 1.8%).
The trend participation rate for 15-64 year olds, which controls (in
part) for the effects of an ageing population remained steady at 78.1%.
The gap between male and female participation rates in this age range is
less than 10 pts, at 82.8% and 73.6% respectively, continuing the long
term convergence of male and female participation.
The trend participation rate for 15-24 year olds (who are often referred
to as the “youth” group in the labour market) remained steady at 68.0%.
The unemployment rate for this group remained steady at 11.4% in March
2019 and decreased by 0.7% over the year.
The trend series smooths the more volatile seasonally adjusted estimates
and provide the best measure of the underlying behaviour of the labour
market.
SEASONALLY ADJUSTED ESTIMATES
Seasonally adjusted employment increased by 25,700 persons from February
to March 2019. The underlying composition of the net change was an
increase of 48,300 persons in full-time employment and a decrease of
22,600 persons in part-time employment. Since March 2018, full-time
employment increased by 289,800 persons, while part-time employment
increased by 14,900 persons.
Seasonally adjusted monthly hours worked in all jobs increased by 13.2
million hours (or 0.7%) in March 2019 to 1,785.4 million hours.
The seasonally adjusted employment to population remained steady at
62.3% in March 2019, and increased by 0.4 pts from the same time last
year.
GRAPH 1. EMPLOYMENT TO POPULATION RATIO, PERSONS, March 2009 to March 2019
The seasonally adjusted unemployment rate increased by 0.1 pts to 5.0%
in March 2019. The participation rate increased by 0.1 pts to 65.7%.
STATE AND TERRITORY ESTIMATES
TREND ESTIMATES
In March 2019, increases in trend employment were observed in all states
and territories except Western Australia (down 200 persons) and
Tasmania (down 100 persons). The largest increases were in Victoria (up
7,600 persons), followed by New South Wales (up 6,800 persons) and
Queensland (up 4,900 persons).
Over the past year, increases in employment were also observed in all
states except Tasmania (down 2,300 persons). Both territories recorded
falls with the Australian Capital Territory (down 1,600 persons) and
Northern Territory (down 4,800 persons). The largest increases were in
Victoria (up 127,500 persons), New South Wales (up 118,500 persons),
Queensland (up 36,100 persons). The highest annual employment growth
rates were in the Victoria at 3.9%, followed by New South Wales at 3.0%
and Queensland at 1.5%. For most states and territories, year-on-year
growth in trend employment was below their 20 year average, the
exceptions being New South Wales and Victoria.
The monthly trend unemployment rate increased by 0.1 pts in Tasmania
(6.5%) and the Australian Capital Territory (3.6%). It remained
unchanged in New South Wales (4.3%), Victoria (4.6%) and South Australia
(5.9%). It decreased by under 0.1 pts in Western Australia (6.1%) and
Queensland (5.9%), and fell 0.2 pts in the Northern Territory to 4.4%.
The monthly trend underemployment rate increased in the Northern
Territory (up 0.2 pts to 5.4%), Victoria (up 0.1 pts to 8.4%) and
Tasmania (up less than 0.1 pts to 10.1%). Decreases of up to 0.1 pts
were seen in New South Wales (7.5%), South Australia (8.9%), Queensland
(8.6%), Western Australia (8.9%) and the Australian Capital Territory
(5.9%).
Monthly trend participation rate decreases were observed in Northern
Territory (down 0.2 pts to 73.8%), Western Australia (down 0.1 pts to
67.8%) and Australian Capital Territory (down 0.1 pts to 69.2%). The
monthly trend participation rate increased less than 0.1 pts in New
South Wales (65.2%) and Victoria (66.1%). It remained unchanged in all
remaining states.
SEASONALLY ADJUSTED ESTIMATES
In seasonally adjusted terms, the largest increase in employment was in
Queensland (up 10,400 persons), followed by Victoria (up 10,000 persons)
and South Australia (up 8,500 persons). The largest decrease was in New
South Wales (down 2,600 persons) followed by Tasmania (down 1,800
persons).
The seasonally adjusted unemployment rate increased in Queensland (up
0.7 pts to 6.1%), South Australia (up 0.2 pts to 5.9%), Tasmania (up 0.2
pts to 6.7%), Western Australia (up 0.1 pts to 6.0%) and New South
Wales (up 0.1 pts to 4.3%). The only decrease in the unemployment rate
was observed in Victoria (down 0.1 pts to 4.6%).
The largest underemployment rate increase in seasonally adjusted terms
was seen in Queensland (up 0.9 pts to 8.9%) followed by South Australia
(up 0.4 pts to 8.8%), Western Australia (up 0.3 pts to 8.9%) and
Tasmania (up 0.2 pts to 9.9%). The only decrease was seen in New South
Wales (down 0.2 pts to 7.4%).
The largest increases in the seasonally adjusted participation rate were
in South Australia (up 0.7 pts to 63.2%) and Queensland (up 0.6 pts to
65.6%). The seasonally adjusted participation rate decreased in
Tasmania (down 0.4 pts to 60.3%), New South Wales (down 0.1 pts to
65.1%) and Victoria (down 0.1 pts to 66.0%).
Australia’s trend unemployment rate remained steady in February 2019 at 5.0 per cent, from a revised January 2019 figure, according to the latest information released by the Australian Bureau of Statistics (ABS).
But there are signs of changes ahead. Have we reached the floor?
ABS Chief Economist Bruce Hockman said: “The trend unemployment rate declined 0.5 percentage points over the year, from 5.5 per cent to 5.0 per cent. The pace of decline slowed in recent months, which was consistent with the slowdown seen in recent Job Vacancies and GDP numbers.” Employment and hours
In February 2019, trend monthly employment increased by 20,600 persons. Full-time employment increased by 12,300 persons and part-time employment increased by 8,200 persons.
Over the past year, trend employment increased by 290,700 persons (2.3 per cent) which was above the average annual growth over the past 20 years (2.0 per cent).
The trend monthly hours worked increased by 0.1 per cent in February 2019 and by 1.9 per cent over the past year. This was slightly above the 20 year average year-on-year growth of 1.7 per cent.
Underemployment and underutilisation
The trend monthly underemployment rate decreased by less than 0.1 percentage points to 8.1 per cent in February and by 0.4 percentage points over the year. The trend underutilisation rate decreased less than 0.1 percentage points to 13.1 per cent, and by 0.9 percentage points over the year.
States and territories trend unemployment rate
The trend unemployment rate increased in Tasmania, decreased in Queensland, and remained steady in all other states and territories. Seasonally adjusted data
The seasonally adjusted unemployment rate decreased 0.1 percentage point to 4.9 per cent in February 2019, while the participation rate fell 0.2 percentage points to 65.6 per cent. The seasonally adjusted number of persons employed increased by 4,600.
The net movement of employed in both trend and seasonally adjusted terms is underpinned by around 300,000 people entering and leaving employment in the month.
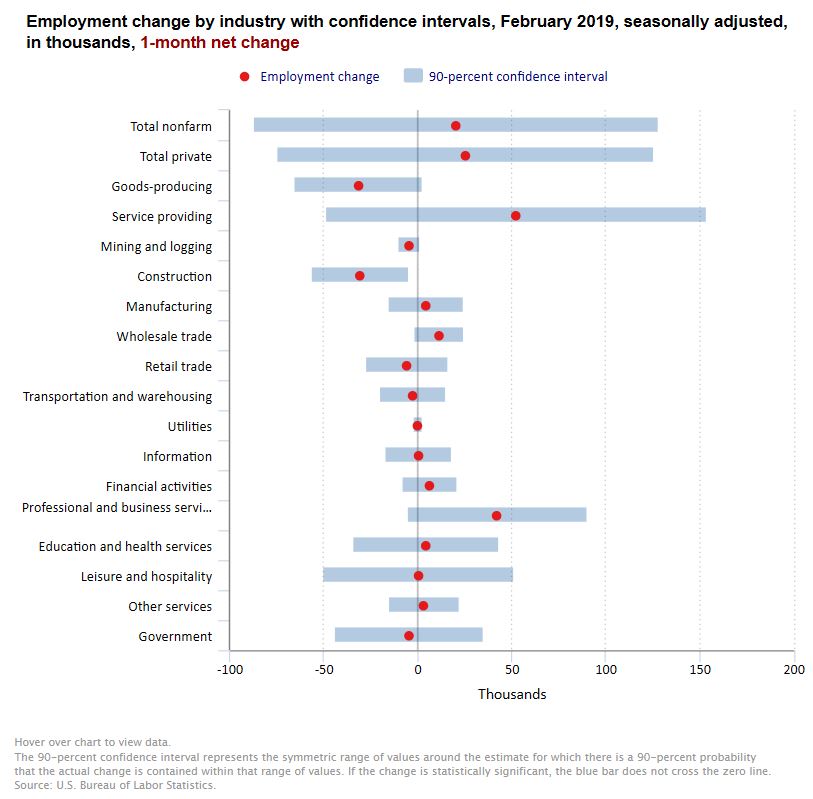
Total nonfarm payroll employment changed little in February (+20,000), and the unemployment rate declined to 3.8 percent, the U.S. Bureau of Labor Statistics reported. Employment in professional and business services, health care, and wholesale trade continued to trend up, while construction employment decreased.
The small rise in jobs was below expectations, but debate is raging as to whether this represents a glitch after the partial shutdown, or a sign of real weakness in the US economy. Either way, markets reacted negatively.
Household Survey Data
The unemployment rate declined by 0.2 percentage point to 3.8 percent in February, and the number of unemployed persons decreased by 300,000 to 6.2 million. Among the unemployed, the number of job losers and persons who completed temporary jobs (including people on temporary layoff) declined by 225,000. This decline reflects, in part, the return of federal workers who were furloughed in January due to the partial government shutdown.
Among the major worker groups, the unemployment rates for adult men (3.5 percent), Whites (3.3 percent), and Hispanics (4.3 percent) decreased in February. The jobless rates for adult women (3.4 percent), teenagers (13.4 percent), Blacks (7.0 percent), and Asians (3.1 percent) showed little or no change over the month.
In February, the number of long-term unemployed (those jobless for 27 weeks or more) was essentially unchanged at 1.3 million and accounted for 20.4 percent of the unemployed.
The labor force participation rate held at 63.2 percent in February and has changed little over the year. The employment-population ratio, at 60.7 percent, was unchanged over the month but was up by 0.3 percentage point over the year.
The number of persons employed part time for economic reasons (sometimes referred to as involuntary part-time workers) decreased by 837,000 to 4.3 million in February. This decline follows a sharp increase in January that may have resulted from the partial federal government shutdown. (Persons employed part time for economic reasons would have preferred full-time employment but were working part time because their hours had been reduced or they were unable to find full-time jobs.)
In February, 1.4 million persons were marginally attached to the labor force, a decrease of 178,000 from a year earlier. (Data are not seasonally adjusted.) These individuals were not in the labor force, wanted and were available for work, and had looked for a job sometime in the last 12 months. They were not counted as unemployed because they had not searched for work in the 4 weeks preceding the survey.
Among the marginally attached, there were 428,000 discouraged workers in February, little changed from a year earlier. (Data are not seasonally adjusted.) Discouraged workers are persons not currently looking for work because they believe no jobs are available for them. The remaining 1.0 million persons marginally attached to the labor force in February had not searched for work for reasons such as school attendance or family responsibilities.
Establishment Survey Data
Total nonfarm payroll employment was little changed in February (+20,000), after increasing by 311,000 in January. In 2018, job growth averaged 223,000 per month.
In February, employment continued to trend up in professional and business services, health care, and wholesale trade, while construction employment declined.
In February, employment in professional and business services continued to trend up (+42,000), in line with its average monthly gain over the prior 12 months.
Health care added 21,000 jobs in February and 361,000 jobs over the year. Employment in ambulatory health care services edged up over the month (+16,000).
In February, wholesale trade employment continued its upward trend (+11,000). The industry has added 95,000 jobs over the year, largely among durable goods wholesalers.
Employment in construction declined by 31,000 in February, partially offsetting an increase of 53,000 in January. In February, employment declined in heavy and civil engineering construction (-13,000). Over the year, construction has added 223,000 jobs.
Manufacturing employment changed little in February (+4,000), after increasing by an average of 22,000 per month over the prior 12 months.
In February, employment in leisure and hospitality was unchanged, after posting job gains of 89,000 and 65,000 in January and December, respectively. Over the year, leisure and hospitality has added 410,000 jobs.
Employment in other major industries, including mining, retail trade, transportation and warehousing, information, financial activities, and government, showed little or no change over the month.
The average workweek for all employees on private nonfarm payrolls decreased by 0.1 hour to 34.4 hours in February. In manufacturing, the average workweek declined 0.1 hour to 40.7 hours, while overtime was unchanged at 3.5 hours. The average workweek for production and nonsupervisory employees on private nonfarm payrolls fell by 0.2 hour to 33.6 hours.
In February, average hourly earnings for all employees on private nonfarm payrolls rose by 11 cents to $27.66, following a 2-cent gain in January. Over the year, average hourly earnings have increased by 3.4 percent. Average hourly earnings of private-sector production and nonsupervisory employees increased by 8 cents to $23.18 in February
The change in total nonfarm payroll employment for December was revised up from +222,000 to +227,000, and the change for January was revised up from +304,000 to +311,000. With these revisions, employment gains in December and January combined were 12,000 more than previously reported. (Monthly revisions result from additional reports received from businesses and government agencies since the last published estimates and from the recalculation of seasonal factors.) After revisions, job gains have averaged 186,000 per month over the last 3 months.
Australia’s trend unemployment rate remained steady in January 2019 at 5.1 per cent, from a revised December 2018 figure, according to the latest information released by the Australian Bureau of Statistics (ABS).
ABS Chief Economist Bruce Hockman said: “The unemployment rate has remained at 5.1 per cent for a second month, supported by strong participation in the labour force, at 65.7 per cent.” Employment and hours
In January 2019, trend monthly employment increased by 24,900 persons. Full-time employment increased by 16,800 persons and part-time employment increased by 8,100 persons.
Over the past year, trend employment increased by 295,500 persons (2.4 per cent) which was above the average annual growth over the past 20 years (2.0 per cent).
The trend employment to population ratio, which shows how employed the population is, rose to a 10 year high of 62.4 per cent.
“The 15-64 year old employment to population ratio reached a historical high of 74.1 per cent, with almost three of every four ‘working age’ Australians now employed”, Mr Hockman said.
The trend monthly hours worked increased by 0.1 per cent in January 2019 and by 1.6 per cent over the past year. This was slightly below the 20 year average year-on-year growth of 1.7 per cent.
The trend monthly underemployment rate remained steady at 8.3 per cent and decreased by 0.3 percentage points over the year. The trend underutilisation rate also remained steady at 13.3 per cent, and decreased by 0.7 percentage points over the past year.
States and territories
The trend unemployment rate increased in South Australia, Western Australia and Tasmania, decreased in New South Wales and Queensland, and remained steady in all other states and territories.
In January 2019, increases in trend employment were observed in most states and territories except Western Australia (down 1,700 persons),Tasmania (down 300 persons) and South Australia (down 200 persons). The largest increases were in New South Wales (up 11,200 persons), followed by Victoria (up 10,300 persons) and Queensland (up 3,500 persons).
Over the past year, increases in employment were observed in all states except Tasmania (down 1,400 persons). Both territories recorded falls in employment (the Northern Territory down 2,500 persons and the Australian Capital Territory down 2,300 persons). The largest increases were in New South Wales (up 133,900 persons), Victoria (up 118,800 persons) and Queensland (up 27,800 persons). The highest annual employment growth rates were in Victoria at 3.7%, followed by New South Wales at 3.4% and Queensland at 1.1%. New South Wales and Victoria were the only states to have a year-on-year growth rate in trend employment above their 20 year average. The monthly trend unemployment rate increased by 0.1 pts in Western Australia (6.6%) and Tasmania (6.2%). It increased by less than 0.1 pts in South Australia (6.0%) and the Northern Territory (5.0%). It remained unchanged in Victoria (4.5%) and the Australian Capital Territory (3.5%). It decreased by 0.1 pts in New South Wales (4.1%) and less than 0.1 pts in Queensland (6.1%).
The monthly trend underemployment rate increased in the Northern Territory (up 0.3 pts to 5.0%) and Victoria (up 0.1 pts to 8.2%). Decreases were seen in Tasmania (down 0.2 pts to 9.6%), Western Australia (down 0.1 pts to 9.2%) and the Australian Capital Territory (down 0.1 pts to 6.3%).
Increases to the trend participation rate were observed in the Northern Territory (up by 0.2 pts to 74.8%), South Australia (up by less than 0.1 pts to 62.8%), New South Wales (up by less than 0.1 pts to 65.1%) and Victoria (up by less than 0.1 pts to 65.9%). Decreases were observed in Tasmania (down 0.1 pts to 60.1%) and the Australian Capital Territory (down 0.1 pts to 69.6%). The monthly trend participation rate remained unchanged in Queensland (65.6%) and Western Australia (68.5%).
The ABS released the latest employment data for December, and reported a trend estimate of employment increased by 23,100 persons in December 2018, with:
the number of unemployed persons decreasing by 3,200 persons;
the unemployment rate remaining steady at 5.0%;
the participation rate remaining steady at 65.6%; and
the employment to population ratio remaining steady at 62.3%.
In fact they revised down last months data to get to the 5%, where it remained in December. This will temper any RBA response to the falling housing market in our view.
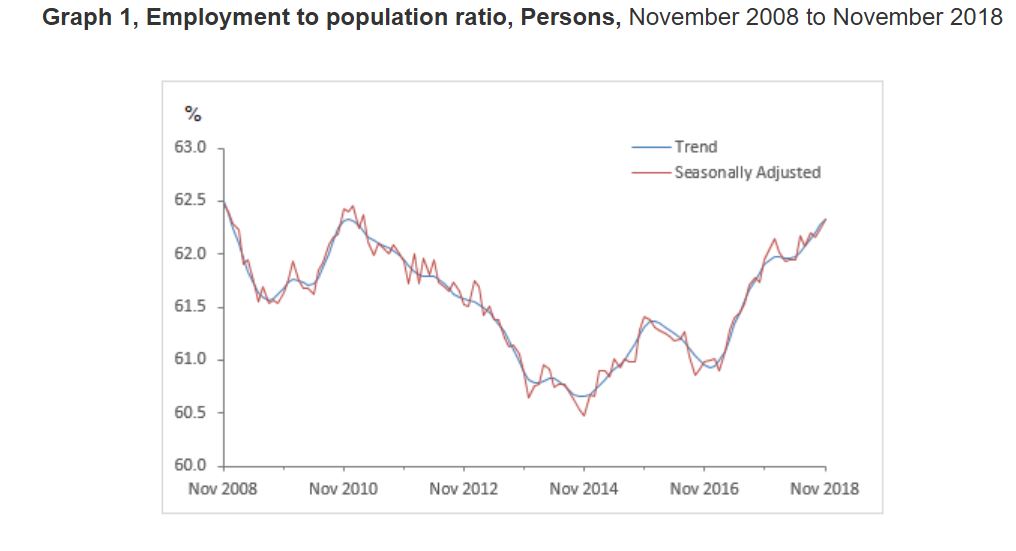
Graph 1, Employment to population ratio, Persons, December 2008 to December 2018
The monthly trend unemployment rate increased by 0.1 pts in Western Australia (6.4%) and the Northern Territory (5.0%). It remained unchanged in New South Wales (4.3%), Queensland (6.2%), South Australia (5.8%), Tasmania (5.8%) and the Australian Capital Territory (3.6%). It decreased 0.1 pts in Victoria (4.4%).
They say that over the past year, trend employment increased by 284,100 persons (or 2.3%), which was above the average annual growth rate over the past 20 years of 2.0%. Over the same 12 month period the trend employment to population ratio, which is a measure of how employed the population (aged 15 years and over) is, increased by 0.4 percentage points (pts) to 62.3%.
In monthly terms, trend employment increased by 23,100 persons between November and December 2018. This represents an increase of 0.18%, which was above the monthly average growth rate over the past 20 years of 0.16%.
Underpinning these net changes in employment is extensive dynamic change, which occurs each month in the labour market. In recent months there has generally been around 300,000 people entering and leaving employment in the month. There is also further dynamic change in the hours that people work, which results in changes in the full-time and part-time composition of employment.
In net terms, trend full-time employment increased by 11,800 persons between November and December 2018, and part-time employment increased by 11,200 persons. Compared to a year ago, there are 189,900 more persons employed full-time and 94,200 more persons employed part-time. This compositional shift led to an increase in the part-time share of employment over the past 12 months, from 31.5% to 31.6%.
The trend estimate of monthly hours worked in all jobs increased by 1.1 million hours (or 0.1%) in December 2018, to 1,759.9 million hours. Monthly hours worked increased by 1.5% over the past year, which was below the increase in employed persons (2.3%). The average hours worked per employed person was 138.5 hours per month, or around 31.9 hour per week.
The trend unemployment rate remained steady at 5.0% in December 2018. The number of unemployed persons decreased by 3,200 to 670,900 persons. Over the past year, the trend unemployment rate decreased by 0.5%, with the number of unemployed decreasing by 46,900 persons.
The trend participation rate remained steady at 65.6% in December 2018. The female participation rate increased to 60.5% and the male participation rate remained steady at 70.9%.
The labour force includes the total number of employed and unemployed persons. Over the past year, the labour force increased by 237,200 persons (1.8%). This rate of increase was above the rate of increase for the total Civilian Population aged 15 years and over (339,900 persons, or 1.7%).
The trend participation rate for 15-64 year olds, which controls (in part) for the effects of an ageing population remained steady at 78.0%. The gap between male and female participation rates in this age range is less than 10 pts, at 82.8% and 73.3% respectively, continuing the long term convergence of male and female participation.
The trend participation rate for 15-24 year olds (who are often referred to as the “youth” group in the labour market) remained steady at 67.9%. The unemployment rate for this group remained steady at 11.3% in December 2018 and decreased by 1.0 pts over the year.
The trend series smooths the more volatile seasonally adjusted estimates and provide the best measure of the underlying behaviour of the labour market.
SEASONALLY ADJUSTED ESTIMATES
Seasonally adjusted employment increased by 21,600 persons from November to December 2018. The underlying composition of the net change was a decrease of 3,000 persons in full-time employment and an increase of 24,600 persons in part-time employment. Since December 2017, full-time employment increased by 162,000 persons, while part-time employment increased by 106,600 persons.
Seasonally adjusted monthly hours worked in all jobs increased by 1.3 million hours (or 0.1%) in December to 1,758.9 million hours.
The seasonally adjusted employment to population increased by less than 0.1 pts to 62.4% in December 2018, and increased by 0.3 pts from the same time last year.
The seasonally adjusted unemployment rate decreased by 0.1 pts to
5.0% in December 2018. The participation rate decreased by less than
0.1 pts to 65.6%.
STATE AND TERRITORY ESTIMATES
TREND ESTIMATES
In December 2018, increases in trend employment were observed in the
majority of states and territories. The largest increases were in
Victoria (up 12,000 persons), followed by New South Wales (up 6,400
persons) and Queensland (up 6,000 persons). Employment fell in Western
Australia (down 500 persons), Tasmania (down 200 persons) and the
Australian Capital Territory (down 200 persons).
Over the past year, increases in employment were observed in all states
except Tasmania (down 300 persons). Both territories recorded falls in
employment (the Australian Capital Territory down 4,500 persons and the
Northern Territory down 3,200 persons). The largest increases were in
New South Wales (up 114,800 persons), Victoria (up 114,300 persons) and
Queensland (up 35,200 persons). The highest annual employment growth
rates were in Victoria at 3.5%, followed by New South Wales at 2.9% and
Queensland at 1.4%. New South Wales and Victoria were the only states to
have a year-on-year growth rate in trend employment above their 20 year
average.
The monthly trend unemployment rate increased by 0.1 pts in Western
Australia (6.4%) and the Northern Territory (5.0%). It remained
unchanged in New South Wales (4.3%), Queensland (6.2%), South Australia
(5.8%), Tasmania (5.8%) and the Australian Capital Territory (3.6%). It
decreased 0.1 pts in Victoria (4.4%).
The only increase in the trend participation rate was in Victoria (up
0.1 pts to 65.8%). Decreases were observed in Tasmania (down 0.2 pts to
60.2%), Australian Capital Territory (down 0.2 pts to 69.4%) and New
South Wales (down 0.1 pts to 64.8%). The monthly trend participation
rate remained unchanged in all remaining states and territories.
SEASONALLY ADJUSTED ESTIMATES
In seasonally adjusted terms, the largest increase in employment was in
Queensland (up 11,600 persons), followed by Victoria (up 10,500 persons)
and New South Wales (up 3,800 persons). The largest decrease was in
Western Australia (down 15,300 persons).
The seasonally adjusted unemployment rate increased in South Australia
(up 0.6 pts to 5.9%) and Tasmania (up 0.1 pts to 5.9%). The largest
decreases in the unemployment rate were observed in Victoria (down 0.4
pts to 4.2%), Queensland (down 0.2 pts to 6.1%) and Western Australia
(down 0.2 pts to 6.3%).
The largest increases in the seasonally adjusted participation rate were
in South Australia (up 0.4 pts to 62.7%) and Queensland (up 0.1 pts to
66.1%). The seasonally adjusted participation rate decreased in Western
Australia (down 1.0 pts to 68.0%) followed by Tasmania (down 0.4 pts to
60.0%) and Victoria (down 0.2 pts to 65.8%).
Australia’s trend unemployment rate fell from 5.2 per cent to 5.1 per cent in November 2018, according to the latest figures released by the Australian Bureau of Statistics (ABS).
The trend participation rate increased slightly to 65.7 per cent in
November 2018, and was 0.2 percentage points higher than in November
2017. The female participation rate rose to 60.5 per cent and the male
participation rate rose to 71.0 per cent.
ABS Chief Economist Bruce Hockman said:”The continued decrease in the trend unemployment rate to 5.1 per cent coincides with the highest trend participation rate ever.” Employment and hours
In November 2018, trend employment increased by 28,800 persons. Full-time employment increased by 19,300 persons and part-time employment increased by 9,500 persons.
Over the past year, trend employment increased by 295,700 persons (2.4 per cent) which was above the average year-on-year growth over the past 20 years (2.0 per cent).
The trend monthly hours worked increased by 0.2 per cent in November 2018 and by 1.9 per cent over the past year. This is slightly above the 20 year average year on year growth of 1.7 per cent.
The monthly trend underemployment rate increased by less than 0.1 percentage points to 8.4% and the monthly underutilisation rate remained steady at 13.5 per cent.
States and territories
This month, the trend unemployment rate decreased in New South Wales and the Australian Capital Territory, increased in Western Australia and the Northern Territory, and remained steady in all other states.
The monthly trend unemployment rate increased in the Northern Territory
(up 0.3 percentage points to 5.0 per cent) and Western Australia (up 0.1
percentage points to 6.3 per cent), and decreased in New South Wales
(down 0.1 percentage points to 4.4 per cent) and the Australian Capital
Territory (down 0.1 percentage points to 3.4 per cent). Victoria (4.6
per cent), Queensland (6.3 per cent), South Australia (5.6 per cent) and
Tasmania (5.8 per cent) all remained unchanged.
The monthly trend participation rate decreased in the Northern Territory (down 0.3 percentage points to 74.0 per cent), Tasmania (down 0.2 percentage points to 60.6 per cent), the Australian Capital Territory (down 0.1 percentage points to 70.0 per cent), New South Wales (down less than 0.1 percentage points to 64.9 per cent) and South Australia (down less than 0.1 percentage points to 62.4 per cent). The trend participation rate increased in Western Australia (up 0.1 percentage points to 68.9 percent) and Victoria (up less than 0.1 percentage points to 65.8 per cent). The monthly trend participation rate remained unchanged in Queensland (65.7 per cent). Seasonally adjusted data
The seasonally adjusted unemployment rate rose to 5.1 per cent in November 2018. The seasonally adjusted number of persons employed increased by 37,000 persons.
The net movement of employed in both trend and seasonally adjusted terms is underpinned by well over 300,000 people entering employment, and more than 300,000 leaving employment in the month.
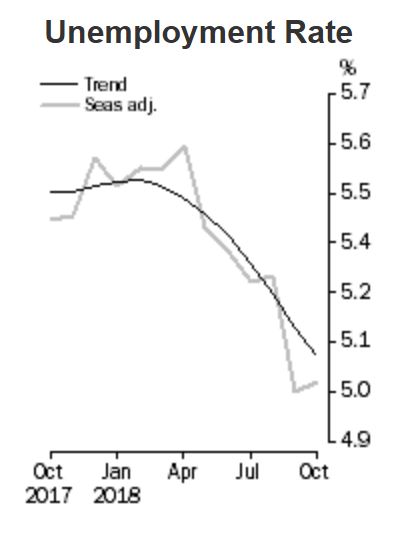
The trend unemployment rate fell from 5.2 per cent to 5.1 per cent in the month of October 2018, according to the latest figures released by the Australian Bureau of Statistics (ABS).
“Today’s fall in trend unemployment to 5.1 per cent marks the lowest unemployment rate since early 2012. This month is the 25th consecutive monthly increase in employed full-time persons with an average increase of 20,300 employed per month” said the Chief Economist for the ABS, Bruce Hockman.
Employment and hours
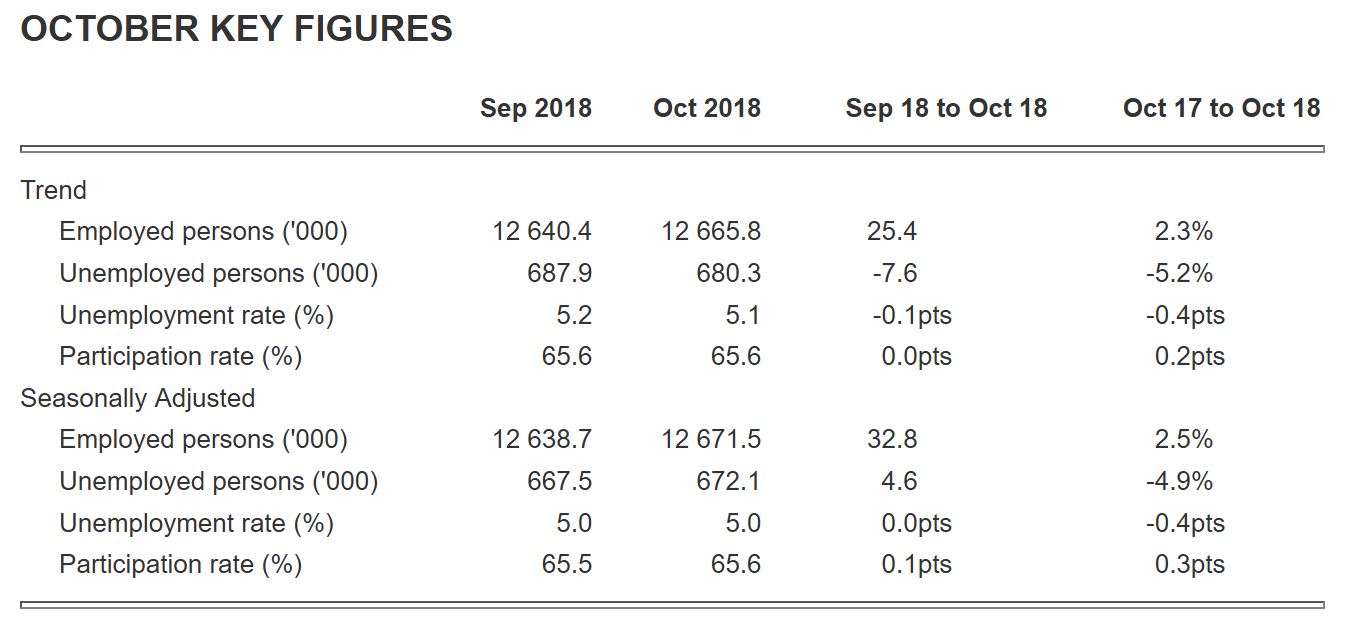
Trend employment increased by 25,400 persons in October 2018. Full-time employment increased by 22,900 persons and part-time employment by 2,500.
The trend underemployment rate remained steady at 8.3 per cent in October 2018 and the trend underutilisation rate decreased 0.1 percentage points to 13.4 per cent.
The trend participation rate remained steady at 65.6 per cent in October 2018.
Over the past year, trend employment increased by 285,900 persons or 2.3 per cent, which was above the average year-on-year growth over the past 20 years (2.0 per cent).
The trend monthly hours worked increased by 0.2 per cent in October 2018 and by 2.0 per cent over the past year.
States and territories
The states and territories with the strongest annual growth in trend employment were New South Wales (3.5 per cent) and Victoria (2.6 per cent).
“Of the 20,300 average monthly increase in employed full-time persons over the past 25 months, New South Wales contributed 35.9%, Victoria 30.5%, Queensland 16.5% and Western Australia 12.1%. The contribution of the other states and territories was largely flat” said Mr Hockman.
Seasonally adjusted data
The seasonally adjusted number of persons employed increased by around 32,800 persons in October 2018. The seasonally adjusted unemployment rate remained steady at 5.0 per cent and the labour force participation rate increased 0.1 percentage point to 65.6 per cent.
The net movement of employed in both trend and seasonally adjusted terms is underpinned by well over 300,000 people entering employment, and more than 300,000 leaving employment in the month
TREND ESTIMATES (MONTHLY CHANGE)
Employment increased 25,400 to 12,665,800.
Unemployment decreased 7,600 to 680,300.
Unemployment rate decreased by 0.1 pts to 5.1%.
Participation rate remained steady at 65.6%.
Monthly hours worked in all jobs increased 3.6 million hours (0.2%) to 1,761.8 million hours.
SEASONALLY ADJUSTED ESTIMATES (MONTHLY CHANGE)
Employment increased 32,800 to 12,671,500. Full-time employment increased 42,300 to 8,703,700 and part-time employment decreased 9,500 to 3,967,900.
Unemployment increased 4,600 to 672,100. The number of unemployed persons looking for full-time work decreased 5,200 to 445,400 and the number of unemployed persons only looking for part-time work increased 9,800 to 226,700.
Unemployment rate remained steady at 5.0%.
Participation rate increased by 0.1 pts to 65.6%.
Monthly hours worked in all jobs increased 6.1 million hours (0.3%) to 1,764.4 million hours.
LABOUR UNDERUTILISATION (MONTHLY CHANGE)
The monthly trend underemployment rate remained steady at 8.3 per cent. The monthly underutilisation rate decreased by 0.1 percentage points to 13.4 per cent.
The monthly seasonally adjusted underemployment rate remained steady at 8.3 per cent. The monthly underutilisation rate remained steady at 13.3 per cent.
The US Bureau of Labor Statistics released their October 2018 data overnight. It was another strong result, with the unemployment rate steady at 3.7% and 250,000 additional jobs added. Over the year, average hourly earnings have increased by 83 cents, or 3.1 percent. More evidence that the FED will continue its path of lifting rates.
The unemployment rate remained at 3.7 percent in October, and the number of unemployed persons was little changed at 6.1 million. Over the year, the unemployment rate and the number of unemployed persons declined by 0.4 percentage point and 449,000,respectively.
The number of long-term unemployed (those jobless for 27 weeks or more) was essentially unchanged at 1.4 million in October and accounted for 22.5 percent of the unemployed.
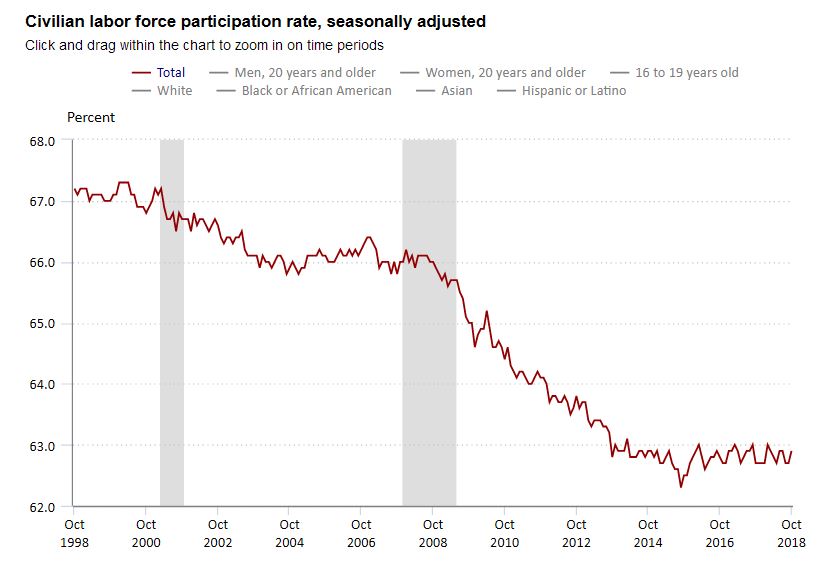
The labor force participation rate increased by 0.2 percentage point to 62.9 percent in October but has shown little change over the year. The employment-population ratio edged up by 0.2 percentage point to 60.6 percent in October and has increased by 0.4 percentage point over the year.
The number of persons employed part time for economic reasons (sometimes referred to as involuntary part-time workers) was essentially unchanged at 4.6 million in October. These individuals, who would have preferred full-time employment, were working part time because their hours had been reduced or they were unable to find full-time jobs.
In October, 1.5 million persons were marginally attached to the labor force, little changed from a year earlier. (Data are not seasonally adjusted.) These individuals were not in the labor force, wanted and were available for work, and had looked for a job sometime in the prior 12 months. They were not counted as unemployed because they had not searched for work in the 4 weeks preceding the survey.
Among the marginally attached, there were 506,000 discouraged workers in October, about unchanged from a year earlier. (Data are not seasonally adjusted.) Discouraged workers are persons not currently looking for work because they believe no jobs are available for them. The remaining 984,000 persons marginally attached to the labor force in October had not searched for work for reasons such as school attendance or family responsibilities.
Total nonfarm payroll employment increased by 250,000 in October, following an average monthly gain of 211,000 over the prior 12 months. In October, job growth occurred in health care, in manufacturing, in construction, and in transportation and warehousing.
Health care added 36,000 jobs in October. Within the industry, employment growth occurred in hospitals (+13,000) and in nursing and residential care facilities (+8,000). Employment in ambulatory health care services continued to trend up (+14,000). Over the past 12 months, health care employment grew by 323,000.
In October, employment in manufacturing increased by 32,000. Most of the increase occurred in durable goods manufacturing, with a gain in transportation equipment (+10,000). Manufacturing has added 296,000 jobs over the year, largely in durable goods industries.
Construction employment rose by 30,000 in October, with nearly half of the gain occurring among residential specialty trade contractors (+14,000). Over the year, construction has added 330,000 jobs.
Transportation and warehousing added 25,000 jobs in October. Within the industry, employment growth occurred in couriers and messengers (+8,000) and in warehousing and storage (+8,000). Over the year, employment in transportation and warehousing has increased by 184,000.
Employment in leisure and hospitality edged up in October (+42,000). Employment was unchanged in September, likely reflecting the impact of Hurricane Florence. The average gain for the 2 months combined (+21,000) was the same as the average monthly gain in the industry for the 12-month period prior to September.
In October, employment in professional and business services continued to trend up (+35,000). Over the year, the industry has added 516,000 jobs.
Employment in mining also continued to trend up over the month (+5,000). The industry has added 65,000 jobs over the year, with most of the gain in support activities for mining.
Employment in other major industries–including wholesale trade, retail trade, information, financial activities, and government–showed little change over the month.
The average workweek for all employees on private nonfarm payrolls increased by 0.1 hour to 34.5 hours in October. In manufacturing, the workweek edged down by 0.1 hour to 40.8 hours, and overtime was unchanged at 3.5 hours. The average workweek for production and nonsupervisory employees on private nonfarm payrolls, at 33.7 hours, was unchanged over the month.
In October, average hourly earnings for all employees on private nonfarm payrolls rose by 5 cents to $27.30. Over the year, average hourly earnings have increased by 83 cents, or 3.1 percent. Average hourly earnings of private-sector production and nonsupervisory employees increased by 7 cents to $22.89 in October.
The change in total nonfarm payroll employment for September was revised down from +134,000 to +118,000, and the change for August was revised up from +270,000 to +286,000. The downward revision in September offset the upward revision in August. (Monthly revisions result from additional reports received from businesses and government agencies since the last published estimates and from the recalculation of seasonal factors.) After revisions, job gains have averaged 218,000 over the past 3 months.
The trend unemployment rate remained steady at 5.2 per cent in the month of September 2018 after the August figure was revised down, according to the latest figures released by the Australian Bureau of Statistics (ABS).
The 5% seasonally adjusted result will get all the attention, but these are very volatile, so it is best to work with the trend data, which shows a fall, although participation remains steady. But underemployment remains higher than post the GFC.
“Today’s figures continue to show a gradual decrease in the trend unemployment rate that began in late 2014. The trend unemployment rate of 5.2 per cent is the lowest it has been since mid 2012.” said the Chief Economist for the ABS, Bruce Hockman.
Employment and hours
Trend employment increased by around 26,000 persons in September 2018 with full-time employment increasing by over 21,000 persons.
The trend participation rate remained steady at 65.6 per cent in September 2018.
Over the past year, trend employment increased by over 290,000 persons or 2.4 per cent, which was above the average year-on-year growth over the past 20 years (2.0 per cent).
The trend monthly hours worked increased by 0.2 per cent in September 2018 and by 1.8 per cent over the past year. States and territories
The states and territories with the strongest annual growth in trend employment were New South Wales (3.4 per cent) and Victoria (2.6 per cent). New South Wales and Victoria were the only states and territories to record year-on-year growth above their 20-year averages. Seasonally adjusted data The seasonally adjusted number of persons employed increased by around 5,600 persons in September 2018. The seasonally adjusted unemployment rate decreased to 5.0 per cent and the labour force participation rate decreased to 65.4 per cent.
The net movement of employed in both trend and seasonally adjusted terms is underpinned by well over 300,000 people entering employment, and more than 300,000 leaving employment in the month.
New underemployment data
The trend underemployment rate decreased to 8.3 per cent in September 2018 and the trend underutilisation rate decreased to 13.5 per cent.
As of September 2018, Australia’s trended underemployment rate (the proportion of underemployed to the total labour force) remained high in historical terms at 8.3%, but below the peak of 8.8% recorded in March 2017.
The underemployment rate has been increasing since it was first recorded in the February 1978 reference period. Over the last four years, the rate has seen minimal fluctuation, remaining between 8.3% and 8.8% in trend terms. The underemployment rate showed large increases over economic downturns – most notably during the early 1990s and the Global Financial Crisis (GFC) (refer to Graph 1).
Graph 1, Underemployment and unemployment rates trended, February 1978 to September 2018
a. The monthly data for part-time workers who want to work more hours, between April 2001 and June 2014, is modelled as data during this period was collected quarterly.