Federal Reserve Board orders JPMorgan Chase & Co. to pay $61.9 million civil money penalty

The US Federal Reserve Board on Thursday ordered JPMorgan Chase & Co. to pay a $61.9 million civil money penalty for unsafe and unsound practices related to the firm’s practice of hiring individuals referred by foreign officials and other clients in order to obtain improper business advantages for the firm.

fed-pic

In levying the fine on JPMorgan Chase, the Federal Reserve Board found that the firm’s Asia-Pacific investment bank operated an improper referral hiring program. The firm offered internships, trainings, and other employment opportunities to candidates who were referred by foreign government officials and existing or prospective commercial clients to obtain improper business advantages.

The Federal Reserve found that the firm did not have adequate enterprise-wide controls to ensure that referred candidates were appropriately vetted and hired in accordance with applicable anti-bribery laws and firm policies.

The Federal Reserve’s order requires JP Morgan Chase to enhance the effectiveness of senior management oversight and controls relating to the firm’s referral hiring practices and anti-bribery policies. The Federal Reserve is also requiring the firm to cooperate in its investigation of the individuals involved in the conduct underlying these enforcement actions and is prohibiting the organizations from re-employing or otherwise engaging individuals who were involved in unsafe and unsound conduct.

The Federal Reserve is imposing the fine and requiring the firm to modify its practices concurrently with actions by the U.S. Department of Justice and the Securities and Exchange Commission.

Put Rates UP to Lift Inflation – The Radical Reverse

Conventional wisdom is that to raise inflation, central banks must cut the cash rate – yet this approach is failing. So, is it time for a policy reversal – raise rates? This approach dubbed Neo-Fisherism might seem a radical idea but it could just be the most obvious solution to the low-inflation problem. This from the St. Louis Fed explains.

economics-pic

During the 2007-2009 global financial crisis, many central banks in the world, including the Federal Reserve, cut interest rates and resorted to various unconventional policies in order to fight financial market disruption, high unemployment, and low or negative economic growth. Now, in 2016, these central banks are typically experiencing inflation below their targets, and they seem powerless to correct the problem. Further unconventional monetary policy actions do not seem to help.

Neo-Fisherites argue that the solution to too-low inflation is obvious, and it may have been just as obvious to Irving Fisher, the early 20th century American economist and original Fisherite. The key Neo-Fisherian principle is that central banks can increase inflation by increasing their nominal interest rate targets—an idea that may seem radical at first blush, as central bankers typically believe that cutting interest rates increases inflation.

To see where Neo-Fisherian ideas come from, it helps to understand the roots of the science of modern central banking. Two key developments in central banking since the 1960s were the recognition that: (1) the responsibility for inflation lies with the central bank; and (2) the main instrument for monetary control for the central bank is a short-term (typically overnight) nominal interest rate. These developments were driven largely by monetarist ideas and by the experience with the implementation of those ideas by central banks in the 1970s and 1980s.

Monetarism is best-represented in the work of the economist Milton Friedman, who argued that “inflation is always and everywhere a monetary phenomenon” and that inflation can and should be managed through central bank control of the stock of money in circulation. Friedman reasoned that the best approach to inflation control is the adoption by the central bank of a constant money growth rule: He thought the central bank should choose some monetary aggregate—a measure of the total quantity of currency, accounts with commercial banks and other retail payments instruments (for example, M1)—and conduct monetary policy in such a way that this monetary aggregate grows at a constant rate forever. The higher the central bank’s desired rate of inflation, the higher should be this constant money growth rate.

During the 1970s and 1980s, many central banks, including the Fed, adopted money growth targets as a means for bringing down the relatively high rates of inflation at that time. Monetarist ideas were a key element of the policies adopted by Paul Volcker, chairman of the Fed’s Federal Open Market Committee (FOMC) from 1979 to 1987. He brought the inflation rate down from about 10 percent at the beginning of his term to 3.5 percent at the end through a reduction in the rate of growth in the money supply.

Though monetarist ideas were useful in bringing about a large reduction in the inflation rate, Friedman’s constant-money-growth prescription did not work as an approach to managing inflation on an ongoing basis. Beginning about 1980, the relationship between money growth and inflation became much more unstable, due in part to changes in financial regulation, technological changes in the banking industry and perhaps to monetarist monetary policy itself. This meant that using Friedman’s prescriptions to fine-tune policy to target inflation over the long term would not work.

As a result, most central banks, including the Fed, abandoned money-growth targeting in the 1980s. As an alternative, some central banks adopted explicit inflation targets, which have since become common. For example, the European Central Bank, the Bank of England, the Swedish Riksbank and the Bank of Japan have targets of 2 percent for the inflation rate. The U.S. is somewhat unusual in that Congress has specified a “dual mandate” for the Fed, which, since 2012, the Fed has interpreted as a 2 percent inflation target combined with the pursuit of “maximum employment.”

Conventional Practice

If a central bank is to move inflation toward its inflation target without reference to the growth rate in a measure of money, how is it supposed to proceed? Central banks control inflation indirectly by relying on an intermediate instrument—typically an overnight nominal interest rate. In the U.S., the FOMC sets a target for the overnight federal funds rate (fed funds rate) and sends a directive to the New York Federal Reserve Bank, which has the responsibility of reaching the target through intervention in financial markets.

Conventional central banking practice is to increase the nominal interest rate target when inflation is high relative to the inflation target and to decrease the target when inflation is low. The reasoning behind this practice is that increasing interest rates reduces spending, “cools” the economy and reduces inflation, while reducing interest rates increases spending, “heats up” the economy and increases inflation.

Neo-Fisherism

But what if central banks have inflation control wrong? A well-established empirical regularity, and a key component of essentially all mainstream macroeconomic theories, is the Fisher effect—a positive relationship between the nominal interest rate and inflation. The Fisher relationship, named for Irving Fisher, is readily discernible in the data.

This is a scatter plot of the inflation rate (the four-quarter percentage change in the personal consumption deflator—the Fed’s chosen measure of inflation) vs. the fed funds rate for the period 1954-2015. A positively sloped line would be the best fit to the points in the scatter plot, indicating that inflation tends to rise as the fed funds rate rises.

Many macroeconomists have interpreted the Fisher relation observed as involving causation running from inflation to the nominal interest rate (the usual market quote for the interest rate, not adjusted for inflation). Market interest rates are determined by the behavior of borrowers and lenders in credit markets, and these borrowers and lenders care about real rates of interest. For example, if I take out a car loan for one year at an interest rate of 10 percent, and I expect the inflation rate to be 2 percent over the next year, then I expect the real rate of interest that I will face on the car loan will be 10 percent – 2 percent = 8 percent. Since borrowers and lenders care about real rates of interest, we should expect that as inflation rises, nominal interest rates will rise as well. So, for example, if the typical market interest rate on car loans is 10 percent if the inflation rate is expected to be 2 percent, then we might expect that the market interest rate on car loans would be 12 percent if the inflation rate were expected to be 4 percent. If we apply this idea to all market interest rates, we should anticipate that, generally, higher inflation will cause nominal market interest rates to rise.

But, what if we turn this idea on its head, and we think of the causation running from the nominal interest rate targeted by the central bank to inflation? This, basically, is what Neo-Fisherism is all about. Neo-Fisherism says, consistent with what we see in, that if the central bank wants inflation to go up, it should increase its nominal interest rate target, rather than decrease it, as conventional central banking wisdom would dictate. If the central bank wants inflation to go down, then it should decrease the nominal interest rate target.

But how would this work? To simplify, think of a world in which there is perfect certainty and where everyone knows what future inflation will be. Then, the nominal interest rate R can be expressed as

R = r + π,

where r is the real (inflation-adjusted) rate of interest and π is future inflation. Then, suppose that the central bank increases the nominal interest rate R by raising its nominal interest rate target by 1 percent and uses its tools (intervention in financial markets) to sustain this forever. What happens? Typically, we think of central bank policy as affecting real economic activity—employment, unemployment, gross domestic product, for example—through its effects on the real interest rate r. But, as is widely accepted by macroeconomists, these effects dissipate in the long run. So, after a long period of time, the increase in the nominal interest rate will have no effect on r and will be reflected only in a one-for-one increase in the inflation rate, π. In other words, in the long run, the only effect of the nominal interest rate on inflation comes through the Fisher effect; so, if the nominal interest rate went up by 1 percent, so should the inflation rate—in the long run.

But, in the short run, it is widely accepted by macroeconomists (though there is some disagreement about the exact mechanism) that an increase in R will also increase r, which will have a negative effect on aggregate economic activity—unemployment will go up and gross domestic product will go down. This is what macroeconomists call a non-neutrality of money. But note that, if an increase in R results in an increase in r, the short-run response of inflation to the increase in R must be less than one-for-one.

However, if inflation is to go down when R goes up, the real interest rate r must increase more than one-for-one with an increase in R, that is, the non-neutrality of money in the short run must be very large.

To assess these issues thoroughly, we need a well-specified macroeconomic model. But essentially all mainstream macroeconomic models predict a response of the economy to an increase in the nominal interest rate as depicted below.

In this figure, time is on the horizontal axis, and the central bank acts to increase the nominal interest rate permanently, and in an unanticipated fashion, at time T. This results in an increase in the real interest rate r on impact. Inflation π increases gradually over time, and the real interest rate falls, with the inflation rate increasing by the same amount as the increase in R in the long run. This type of response holds even in mainstream New Keynesian models, which, it is widely believed, predict that a central bank wanting to increase inflation should lower its nominal interest rate target. However, as economist John Cochrane shows, the New Keynesian model implies that if the central bank carries out the policy we have described—a permanent increase of 1 percent in the central bank’s nominal interest rate target—then the inflation rate will increase, even in the short run.

The Low-Inflation Policy Trap

What could go wrong if central bankers do not recognize the importance of the Fisher effect and instead conform to conventional central banking wisdom? Conventional wisdom is embodied in the Taylor rule, first proposed by John Taylor in 1993.5 Taylor’s idea is that optimal central bank behavior can be written down in the form of a rule that includes a positive response of the central bank’s nominal interest rate target to an increase in inflation.

But the Taylor rule does not seem to make sense in terms of what we see. Taylor appears to have thought, in line with conventional central banking wisdom, that increasing the nominal interest rate will make the inflation rate go down, not up. Further, Taylor advocated a specific aggressive response of the nominal interest rate target to the inflation rate, sometimes called the Taylor principle. This principle is that the nominal interest rate should increase more than one-for-one with an increase in the inflation rate.

So, what happens in a world that is Neo-Fisherian (the inflationary process works as above, but central bankers behave as if they live in Taylor’s world? Macroeconomic theory predicts that a Taylor-principle central banker will almost inevitably arrive at the “zero lower bound.” What does that mean?

Until recently, macroeconomists argued that short-term nominal interest rates could not go below zero because, if interest rates were negative, people would prefer to hold cash, which has a nominal interest rate equal to zero. According to this logic, the lower bound on the nominal interest rate is zero. It turns out that, if the central bank follows the Taylor principle, then this implies that the central bank will see inflation falling and will respond to this by reducing the nominal interest rate. Then, because of the Fisher effect, this actually leads to lower inflation, causing further reductions in the nominal interest rate by the central bank and further decreases in inflation, etc. Ultimately, the central bank sets a nominal interest rate of zero, and there are no forces that will increase inflation. Effectively, the central bank becomes stuck in a low-inflation policy trap and cannot get out—unless it becomes Neo-Fisherian.

But maybe this is only theory. Surely, central banks would not get stuck in this fashion in reality, misunderstanding what is going on, right? Unfortunately, not. The primary example is the Bank of Japan. Since 1995, this central bank has seen an average inflation rate of about zero, having kept its nominal interest rate target at levels close to zero over those 21 years. The Bank of Japan has an inflation target of 2 percent and wants inflation to be higher, but seems unable to achieve what it wants.

Over the past several years, membership in the low-inflation-policy-trap club of central banks has been increasing. This club includes the European Central Bank, whose key nominal interest rate is –0.34 percent and inflation rate is –0.22 percent; the Swedish Riksbank, with key nominal interest rate of –0.50 percent and inflation rate of 0.79 percent; the Danish central bank, with key nominal interest rate of –0.23 percent and inflation rate of 0 percent; the Swiss National Bank, with key nominal interest rate of –0.73 percent and inflation rate of –0.35 percent; and the Bank of England, with key nominal interest rate of 0.47 percent and inflation rate of 0.30 percent. Each of these central banks has been missing its inflation target on the low side, in some cases for a considerable period of time.7 The Fed could be included in this group, too, as the fed funds rate was targeted at 0-0.25 percent for about seven years, until Dec. 16, 2015, when the target range was increased to 0.25-0.50 percent. The Fed has missed its 2 percent inflation target on the low side for about four years now.

How a Trapped Central Bank Behaves

Abandoning the Taylor principle and embracing Neo-Fisherism seems a difficult step for central banks. What they typically do on encountering low inflation and low nominal interest rates is engage in unconventional monetary policy. Indeed, unconventional policy has become commonplace enough to become respectably conventional.

Unconventional monetary policy takes three forms in practice. First, central banks can push market nominal interest rates below zero (relaxing the zero lower bound) by paying negative interest on reserves at the central bank—charging a fee on such accounts, as has been done by the Bank of Japan, the Swiss National Bank, the Danish central bank and the Swedish Riksbank. Second, there can be so-called quantitative easing, or QE—the large-scale purchase of long-maturity assets (government debt and private assets, such as mortgage-backed securities) by a central bank. Such programs have been an important element of monetary policy in the U.S., Switzerland and Japan, for example, in the years after the financial crisis (2007-2009). Third, central banks can engage in forward guidance—promises concerning what they will do in the future. Typically, these are promises that interest rates will stay low in the future, in the hope that this will increase inflation. But will any of these unconventional policies actually work to increase the inflation rate? Neo-Fisherism suggests not.

First, given the Fisher effect, a negative nominal interest rate will only make the inflation rate lower, as has happened in Switzerland, where nominal interest rates have been negative for some time and there is deflation—negative inflation. Second, some theory indicates that QE either does not work at all or acts to make inflation lower. This is consistent with what we have seen in Japan, where an extensive QE program in place for two years has not yielded higher inflation. Third, forward guidance, which promises more of the same unconventional policies and continued low interest rates if the low-inflation problem persists, will only prolong the problem.

Conclusion

Among the major central banks in the world, the Fed stands out as the only one that is pursuing a policy of increases in its nominal interest rate target. This policy, referred to as “normalization,” was initiated in December 2015. Normalization, however, is projected to take place slowly and is not motivated explicitly by Neo-Fisherian ideas, though James Bullard, president of the Federal Reserve Bank of St. Louis, has shown interest.

What is the risk associated with Neo-Fisherian denial—a failure to take account of the Fisher relation in formulating monetary policy? Neo-Fisherian denial will tend to produce inflation lower than central banks’ inflation targets and nominal interest rates that are at central banks’ effective lower bounds—the low-inflation policy trap. But what of it? There are no good reasons to think that, for example, 0 percent inflation is worse than 2 percent inflation, as long as inflation remains predictable. But “permazero” damages the hard-won credibility of central banks if they claim to be able to produce 2 percent inflation consistently, yet fail to do so. As well, a central bank stuck in a low-inflation policy trap with a zero nominal interest rate has no tools to use, other than unconventional ones, if a recession unfolds. In such circumstances, a central bank that is concerned with stabilization—in the case of the Fed, concerned with fulfilling its “maximum employment” mandate—cannot cut interest rates. And we know that a central bank stuck in a low-inflation trap and wedded to conventional wisdom resorts to unconventional monetary policies, which are potentially ineffective and still poorly understood.

US Consumer Credit Growth Strong

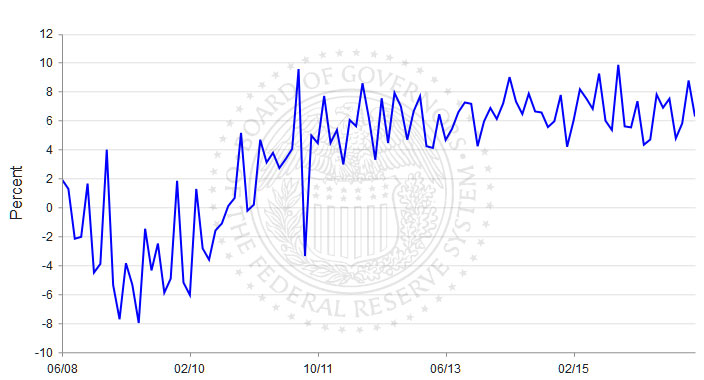
The latest data from the US Federal Reserve shows that consumer credit increased at a seasonally adjusted annual rate of 7 percent during the third quarter. Revolving credit increased at an annual rate of 5-1/4 percent, while nonrevolving credit increased at an annual rate of 7-1/2 percent. In September, consumer credit increased at an annual rate of 6-1/4 percent.

consumer-credit-oct-2106-usFurther evidence supporting a rate rise in December?

US Rate Rise 70% Likely In December

Fed Vice Chairman Stanley Fischer spoke at the 17th Jacques Polak Annual Research Conference, sponsored by the International Monetary Fund, Washington, D.C. He discussed the US Economic Outlook, and labor market conditions and said the markets put a probability of above 70 percent on the rate being increased in December.

USA-Economy-Pic

With today’s data in the news, I will first say a few words about labor market conditions before moving on to discuss the economic outlook and monetary policy.

The labor market has, by and large, had a pretty good year. Including this morning’s release for October, payrolls have increased an average of 181,000 per month this year, a slower pace than last year but enough to keep the unemployment rate flat at about 5 percent. The unchanged unemployment rate reflects a positive, though perhaps transitory, development–mainly a pickup in labor force participation. The rise in participation may reflect the effects of the modest pickup in wages we are now seeing, with the rate of increase in the employment cost index having risen from an annual rate of about 2 percent last year to 2-1/4 percent so far this year.

Over the course of the past two years, a variety of negative shocks have affected the U.S. economy, but employment has resumed robust growth after each temporary slowdown: This recovery has been and continues to be powerful in terms of one of our two main targets–employment–and it is my view that the labor market is close to full employment.

It is nonetheless interesting to ask what level of payroll gains would maintain an unemployment rate of roughly 5 percent. Unsurprisingly, the level of payroll gains consistent with an unchanged unemployment rate is highly dependent on developments in labor force participation. If labor force participation was to remain flat, job gains in the range of 125,000 to 175,000 would likely be needed to prevent unemployment from creeping up. However, if labor force participation was to decline, as might be expected given demographic trends, the neutral rate of payroll gains would be lower. If we assumed a downward trend in participation of about 0.3 percentage point per year, in line with estimates of the likely drag from demographics, job gains in the range of 65,000 to 115,000 would likely be sufficient to maintain full employment.

Last week we received some encouraging news on output growth. After a slow first half, real gross domestic product (GDP) increased almost 3 percent in the third quarter. However, the details were a little less exciting than the headline number. Household spending growth slowed, and residential investment declined. Business investment in equipment fell for the fourth consecutive quarter. A surge in exports supported growth; however, much of the increase was in shipments of soybeans, while exports of other goods remained tepid. Growth was also supported by a buildup in inventories, breaking a streak of five quarters in which inventories contributed negatively to growth, the longest such run in more than 50 years. Overall, I expect GDP growth to continue at a moderate pace, supported by household spending, renewed business investment, and the waning effects of past dollar appreciation on export growth.

I will now turn to inflation. Headline PCE (personal consumption expenditures) inflation has moved up this year, with the 12-month change reaching 1.2 percent in September. As the transitory effects of the earlier fall in oil prices and rise in the dollar fade, PCE inflation can be expected to rise further toward our 2 percent target, supported by higher core PCE inflation, which ran at a 1.7 percent pace in September.

As you know, earlier this week, we decided to keep the target range for the federal funds rate at 1/4 to 1/2 percent. As was noted in the Federal Open Market Committee’s statement, our assessment is that the most recent data have further strengthened the case for increasing the target range for the federal funds rate. The markets put a probability of above 70 percent on the rate being increased in December.

So far I’ve been discussing our near-term economic prospects. But the more interesting and important questions relate to the next few years rather than the next few months. They relate in large part to the secular stagnation arguments that were laid out yesterday in Larry Summers’ Mundell-Fleming lecture–in particular the behavior of the rate of productivity growth. The statement that the problem we face is largely one of demand–and we do face that problem–seems to imply either that productivity growth is called forth by aggregate demand, or a Say’s Law of productivity growth, namely that productivity growth produces its own demand.

That is not an issue that can be answered purely by theorizing. Rather, it will be answered by the behavior of output and inflation as we approach and perhaps to some extent exceed our employment and inflation targets.


Higher GDP Growth in the Long Run Requires Higher Productivity Growth

From The St. Louis Fed Blog.

Real gross domestic product (GDP) growth in the U.S. has been relatively slow since the recession ended in June 2009. It has averaged about 2 percent over the past seven years, compared with roughly 3 percent to 4 percent in the three previous expansions. At this point, the slower growth during the current recovery can no longer be attributed to cyclical factors that resulted from the recession—rather, it likely reflects a trend.


source: tradingeconomics.com

A common topic of discussion among observers of the U.S. economy is how to return to a higher growth rate for the U.S. economy. The pace of growth is important because it has implications for the nation’s standard of living. For instance, at an annual growth rate of 1 percent, a country’s standard of living would double roughly every 70 years; at 2 percent it would double every 35 years; at 7 percent it would double every 10 years.

While some might want to turn to monetary policy as the tool for increasing the GDP growth trend, monetary policy cannot permanently alter the long-run growth rate. Leading theories say that monetary policy can have only temporary effects on economic growth and that, ultimately, it would have no effect on economic growth because money is neutral in the medium term and the long term. Monetary policy can only pull some growth forward (e.g., when the economy is in recession) in exchange for less growth in the future. This process allows for a smoother growth rate across time—so-called “stabilization policy”—but there would be no additional output produced overall.

One of the most important drivers of increased real GDP growth in the long run is growth in productivity. In recent years, average labor productivity growth in the U.S. has been very slow. For the total economy, it grew only 0.4 percent on average from the second quarter of 2013 to the first quarter of 2016, whereas it grew 2.3 percent on average from the first quarter of 1995 to the fourth quarter of 2005.

What influences productivity over time? The literature on the fundamentals of economic growth tends to focus on three factors. One is the pace of technological development. Productivity improves as new general purpose technologies are introduced and diffuse through the whole economy. Classic examples are the automobile and electricity. The second factor is human capital. The workforce receives better training and a higher level of knowledge over time, both of which help make workers more productive and improve growth over the medium and long run. The third factor is productive public capital. The idea is that government would provide certain types of public capital that would not otherwise be provided by the private sector, such as roads, bridges and airports. This type of public capital can improve private-sector productivity and, therefore, may lead to faster growth.

The U.S. experienced faster productivity growth in the not-too-distant past. If we could return to the productivity growth rates experienced in the late 1990s, the U.S. economy would likely see better outcomes overall. As a nation, we need to think about what kinds of public policies are needed to encourage higher productivity growth—and, in turn, higher real GDP growth—over the next five to 10 years. The above considerations suggest the following might help: encouraging investment in new technologies, improving the diffusion of technology, investing in human capital so that workers’ skillsets match what the economy needs, and investing in public capital that has productive uses for the private sector. These are all beyond the scope of monetary policy.

The Problem With Low Interest Rates

Low interest rates have a profound impact on economies, and households. It is important to understand what is driving the ultra-low rates, and the implications for future growth. The Fed’s Vice Chairman Stanley Fischer  says lower growth, demographic changes, weak investment and global developments all are responsible for driving rates lower for longer.

However, we think there is a missing link. The factors discussed are driving incomes lower for many, making the prospect of debt repayment just a distant dream. Excessive debt was not discussed. It should be.

USA-Economy-Pic

There are at least three reasons why we should be concerned about such low interest rates. First, and most worrying, is the possibility that low long-term interest rates are a signal that the economy’s long-run growth prospects are dim. Later, I will go into more detail on the link between economic growth and interest rates. One theme that will emerge is that depressed long-term growth prospects put sustained downward pressure on interest rates. To the extent that low long-term interest rates tell us that the outlook for economic growth is poor, all of us should be very concerned, for–as we all know–economic growth lies at the heart of our nation’s, and the world’s, future prosperity.

A second concern is that low interest rates make the economy more vulnerable to adverse shocks that can put it in a recession. That is the problem of what used to be called the zero lower bound on interest rates. In light of several countries currently operating with negative interest rates, we now refer not to the zero lower bound, but to the effective lower bound, a number that is close to zero but negative. Operating close to the effective lower bound limits the room for central banks to combat recessions using their conventional interest rate tool–that is, by cutting the policy interest rate. And while unconventional monetary policies–such as asset purchases, balance sheet policies, and forward guidance–can provide additional accommodation, it is reasonable to think these alternatives are not perfect substitutes for conventional policy. The limitation on monetary policy imposed by low trend interest rates could therefore lead to longer and deeper recessions when the economy is hit by negative shocks.

And the third concern is that low interest rates may also threaten financial stability as some investors reach for yield and compressed net interest margins make it harder for some financial institutions to build up capital buffers. I should say that while this is a reason for concern and bears continual monitoring, the evidence so far does not suggest a heightened threat of financial instability in the post-financial-crisis United States stemming from ultralow interest rates. However, I note that a year ago the Fed did issue warnings–successful warnings–about the dangers of excessive leveraged lending, and concerns about financial stability are clearly on the minds of some members of the Federal Open Market Committee, FOMC.

Those are three powerful reasons to prefer interest rates that are higher than current rates. But, of course, Fed interest rates are kept very low at the moment because of the need to maintain aggregate demand at levels that will support the attainment of our dual policy goals of maximum sustainable employment and price stability, defined as the rate of inflation in the price level of personal consumption expenditures (or PCE) being at our target level of 2 percent.

That the actual federal funds rate has to be so low for the Fed to meet its objectives suggests that the equilibrium interest rate–that is, the federal funds rate that will prevail in the longer run, once cyclical and other transitory factors have played out–has fallen. Let me turn now to my main focus, namely an assessment of why the equilibrium interest rate is so low.

To frame this discussion, it is useful to think about the real interest rate as the price that equilibrates the economy’s supply of saving with the economy’s demand for investment. To explain why interest rates are low, we look for factors that are boosting saving, depressing investment, or both. For those of you lucky enough to remember the economics you learned many years ago, we are looking at a point that is on the IS curve–the investment-equals-saving curve. And because we are considering the long-run equilibrium interest rate, we are looking at the interest rate that equilibrates investment and saving when the economy is at full employment, as it is assumed to be in the long run.

I will look at four major forces that have affected the balance between saving and investment in recent years and then consider some that may be amenable to the influence of economic policy.

The economy’s growth prospects must be at the top of the list. Among the factors affecting economic growth, gains in productivity and growth of the labor force are particularly important. Second, an increase in the average age of the population is likely pushing up household saving in the U.S. economy. Third, investment has been weak in recent years, especially given the low levels of interest rates. Fourth and finally, developments abroad, notably a slowing in the trend pace of foreign economic growth, may be affecting U.S. interest rates.

To assess the empirical importance of these factors in explaining low long-run equilibrium interest rates, I will rely heavily on simulations that the Board of Governors’ staff have run with one of our main econometric models, the FRB/US model. This model, which is used extensively in policy analyses at the Fed, has many advantages, including its firm empirical grounding, and the fact that it is detailed enough to make it possible to consider a wide range of factors within its structure.

Going through the four major forces I just mentioned, I will look first at the effect that slower trend economic growth, both on account of the decline in productivity growth as well as lower labor force growth, may be having on interest rates. Starting with productivity, gains in labor productivity have been meager in recent years. One broad measure of business-sector productivity has risen only 1-1/4 percent per year over the past 10 years in the United States and only 1/2 percent, on average, over the past 5 years. By contrast, over the 30 years from 1976 to 2005, productivity rose a bit more than 2 percent per year. Although the jury is still out on what is behind the latest slowdown in productivity gains, prominent scholars such as Robert Gordon and John Fernald suggest that smaller increases in productivity are the result of a slowdown in innovation that is likely to persist for some time.

Lower long-run trend productivity growth, and thus lower trend output growth, affects the balance between saving and investment through a variety of channels. A slower pace of innovation means that there will be fewer profitable opportunities in which to invest, which will tend to push down investment demand. Lower productivity growth also reduces the future income prospects of households, lowering their consumption spending today and boosting their demand for savings. Thus, slower productivity growth implies both lower investment and higher savings, both of which tend to push down interest rates.

In addition to a slower pace of innovation, it is also likely that demographic changes will weigh on U.S. economic growth in the years ahead, as they have in the recent past. In particular, a rising fraction of the population is entering retirement. According to some estimates, the effects of this population aging will trim about 1/4 percentage point from labor force growth in coming years.

Lower trend increases in productivity and slower labor force growth imply lower overall economic growth in the years ahead. This view is consistent with the most recent Summary of Economic Projections of the FOMC, in which the median value for the rate of growth in real gross domestic product (GDP) in the longer run is just 1-3/4 percent, compared with an average growth rate from 1990 to 2005 of around 3 percent.

We can use simulations of the FRB/US model to infer the consequences of such a slowdown in longer-run GDP growth for the equilibrium federal funds rate. Those simulations suggest that the slowdown to the 1-3/4 percent pace anticipated in the Summary of Economic Projections would eventually trim about 120 basis points from the longer-run equilibrium federal funds rate.

Let me move now to the second major development on my list. In addition to its effects on labor force growth, the aging of the population is likely to boost aggregate household saving. This increase is because the ranks of those approaching retirement in the United States (and in other advanced economies) are growing, and that group typically has above-average saving rates.9 One recent study by Federal Reserve economists suggests that population aging–through its effects on saving–could be pushing down the longer-run equilibrium federal funds rate relative to its level in the 1980s by as much as 75 basis points.

In addition to slower growth and demographic changes, a third factor that may be pushing down interest rates in the United States is weak investment. Analysis with the FRB/US model suggests that, given how low interest rates have been in recent years, investment should have been considerably higher in the past couple of years. According to the model, this shortfall in investment has depressed the long-run equilibrium federal funds rate by about 60 basis points.

Investment may be low for a number of reasons. One is that greater perceived uncertainty could also make firms more hesitant to invest. Another possibility is that the economy is simply less capital intensive than it was in earlier decades.

Fourth on my list are developments abroad: Many of the factors depressing U.S. interest rates have also been working to lower foreign interest rates. To take just one example, many advanced foreign economies face a slowdown in longer-term growth prospects that is similar to that in the United States, with similar implications for equilibrium interest rates in the longer run. In the FRB/US model, lower interest rates abroad put upward pressure on the foreign exchange value of the dollar and thus lower net exports. FRB/US simulations suggest that a reduction in the equilibrium federal funds rate of about 30 basis points would be required to offset the effects in the United States of a reduction in foreign growth prospects similar to what we have seen in the United States.

Employment, Capacity Utilization and Business Cycles

From the St. Louis Fed On The Economy Blog.

Two measures commonly used to gauge the country’s economic activity have started to move in opposite directions, according to an Economic Synopses essay.

Economist Ana Maria Santacreu examined these two measures:

  • The capacity utilization rate, which is the percentage of resources used by corporations and factories to produce finished goods
  • The fraction of the labor force currently employed, which is measured as 100 percent minus the unemployment rate

Santacreu noted that companies typically use around 80 percent of their available productive capacity (measured by the capacity utilization rate). This number is higher during economic expansions and lower during recessions. She noted: “Indeed, during the most recent recession, U.S. capacity utilization dropped below 67 percent, the lowest point since the late 1960s.”

The figure below plots the two measures at quarterly intervals from 1967 through the first quarter of 2016.

As the figure shows, employment as a fraction of the labor force tends to move in a similar fashion to the capacity utilization rate. Santacreu noted that the correlation between the two measures was 0.90 for the period 1967:Q1 through 1990:Q1.

However, the correlation became less pronounced during the early 1990s economic crisis and the early 2000s dot-com bubble. Santacreu wrote: “During both episodes, capacity utilization dropped before employment did and began recovering earlier. That is, industrial activity was booming while employment was still low. This phenomenon is known as a jobless recovery.”

Following the Great Recession, these two measures didn’t follow the same pattern as in the previous two recessions. Both measures dropped initially, but employment has been recovering quickly since 2009, while capacity utilization recovered initially but began falling again in 2015.

Why the Divergence?

Santacreu noted that there are several potential reasons why unemployment took longer to recover following the recessions of the early 1990s and early 2000s:

  • Firms may have postponed hiring to be sure the recovery was strong.
  • Firms may have purchased new equipment instead of hiring additional workers.
  • Workers may have had to switch industries, which may have lengthened the time it took to fill positions.

Santacreu wrote: “This is important in comparing capacity utilization and employment as measures of economic activity. Capacity seems to be mainly affected by cyclical factors. Employment, however, is also affected by a structural factor that makes it adjust more slowly than industrial capacity adjusts to recessions and recoveries.”

Regarding the recent divergence, Santacreu noted that two factors may be at play:

  • The unemployment rate may have decreased initially because some displaced workers became discouraged and simply dropped out of the labor force.
  • More recently, new jobs have been created, bringing the U.S. closer to full employment.

Santacreu concluded: “Capacity utilization and employment tend to comove along the business cycle. However, they may drift apart when labor markets are less flexible or there are structural changes in the economy.”

Additional Resources

Door Still Open For Fed Rate Cut

Fed Vice Chairman Stanley Fischer spoke at the 31st Annual Group of Thirty International Banking Seminar, Washington, D.C. on the U.S. Economy and Monetary Policy.

After running through the current numbers, he turned to the monetary policy outlook. The labor market seems to be the key.

USA-Economy-Pic

As you know, at our September meeting, the FOMC decided to keep the target range for the federal funds rate at 1/4 to 1/2 percent. As we noted in the statement, the recent pickup in economic growth and continued progress in the labor market have strengthened the case for an increase in the federal funds rate.3 Indeed, in our individual economic projections prepared in advance of the September meeting, nearly all FOMC participants anticipated an increase in the target range for the federal funds rate by the end of this year. Moreover, as economic growth has picked up and some of the earlier concerns about the global outlook have receded, the Committee judged the risks to the U.S. economic outlook to be roughly balanced.

Given that generally positive view of the economic outlook, one might ask, why did we not raise the federal funds rate at our September meeting? Our decision was a close call, and leaving the target range for the federal funds rate unchanged did not reflect a lack of confidence in the economy. Conditions in the labor market are strengthening, and we expect that to continue. And while inflation remains low, we expect it to rise to our 2 percent objective over time. But with labor market slack being taken up at a somewhat slower pace than in previous years, scope for some further improvement in the labor market remaining, and inflation continuing to run below our 2 percent target, we chose to wait for further evidence of continued progress toward our objectives.

As we noted in our statement, we continue to expect that the evolution of the economy will warrant some gradual increases in the federal funds rate over time to achieve and maintain our objectives. That assessment is based on our view that the neutral nominal federal funds rate–that is, the interest rate that is neither expansionary nor contractionary and keeps the economy operating on an even keel–is currently low by historical standards. With the federal funds rate modestly below the neutral rate, the current stance of monetary policy should be viewed as modestly accommodative, which is appropriate to foster further progress toward our objectives. But since monetary policy is only modestly accommodative, there appears little risk of falling behind the curve in the near future, and gradual increases in the federal funds rate will likely be sufficient to get monetary policy to a neutral stance over the next few years.

This view is consistent with the projections of appropriate monetary policy prepared by FOMC participants in connection with our September meeting. The median projection for the federal funds rate rises only gradually to 1.1 percent at the end of next year, 1.9 percent at the end of 2018, and 2.6 percent by the end of 2019. Most participants also marked down their estimate of the longer-run normal federal funds rate, with the median now at 2.9 percent.

However, as we have noted on many previous occasions, policy is not on a preset course. The economic outlook is inherently uncertain, and our assessment of the appropriate path for the federal funds rate will change in response to changes to the economic outlook and associated risks.

Blockchain: Implications for Payments, Clearing, and Settlement

A speech by Fed Governor Lael Brainard “Distributed Ledger Technology: Implications for Payments, Clearing, and Settlement” contains a number of interesting use cases, discussed in their blockchain working party.

Small-Chain-Picture

Let me briefly mention a few of the use cases that we have explored in our discussions with industry stakeholders in order to illustrate the potential of distributed ledger technologies to improve payments, clearing, and settlement, as well as the considerations that are important to us in our assessment of benefits and risks.

In cross-border payments and trade finance, significantly faster processing and reduced costs relative to the long and opaque intermediation chains associated with current methods of correspondent banking are promising potential benefits of the technology. Reducing intermediation steps in cross-border payments may help decrease time, costs, and counterparty risks and may materially diminish opacity, for instance by enabling small businesses or households remitting payments across borders to see the associated transfer costs and processing times up front.

In trade finance, where document-intensive processes are not fully automated, distributed ledger technology may be able to reduce significant costs and speed up processing associated with issuing and tracking letters of credit and associated documents. To see the full potential of this technology realized for cross-border payments, it will be important to identify and track identities associated with the transactions, which in itself may be facilitated by the use of distributed ledgers, depending on their design.

In securities markets, the industry is exploring activities ranging from the issuance of securities on a distributed ledger, to the clearing and settlement of trades, to tracking and administering corporate actions.

For securities clearing and settlement in particular, the potential shift to one master record shared “simultaneously” among users of a distributed ledger-based system could be compelling. Sharing one immutable record may have the potential to reduce or even eliminate the need for the reconciliation of multiple records linked to a single trade among and between dealers and other organizations.

In concept, such technology could lead to greater transparency, reduced costs, and faster settlement. Likewise, distributed ledgers may improve collateral management by improving the tracking of ownership and transactions. Nonetheless, as is frequently true in the complex arena of payments, clearing, and settlement, we can also expect that practical details covering a host of technical, business, and market issues will have an important role in determining how new technologies ultimately perform.

For commodities and derivatives, there are projects to streamline some of the more antiquated corners of the markets. In markets that are heavily paper-based and lack any central means for coordination, distributed ledger technology could potentially be leveraged to provide coordination that facilitates exchange, clearing, and settlement of obligations.

A related development is the potential coupling of distributed ledger protocols with self-execution and possibly self-enforcement of contractual clauses, using so-called “smart contracts.” To take a familiar example, for a corporate bond with a specified par value, tenor, and coupon payment stream, a smart contract would automatically execute payments on the specified schedule to the assigned owner over the life of the bond. Although the idea of automating certain aspects of contracts is not new, and banks do some of this today, the potential introduction of smart contracts does raise several issues for consideration. For example, what is the legal status of a smart contract, which is written in code? Would consumers and businesses rely on smart contracts to perform certain services traditionally done by their banks or other intermediaries? Could the widespread automated interaction of multiple counterparties lead to any unwanted dynamics for financial markets? These and other considerations will be important factors in determining the extent of the application of smart contracts.

Regardless of the application, much of the industry is at a “proof of concept” stage of development. These proofs of concept are often simple, experimental uses of the technology on a small scale that help stakeholders understand the potential and limitations of the technology for a specific purpose, which in turn typically lead to refinements and more developed proofs of concept. As such, many potential applications are in their infancy, and the industry may still be several years away from an application that is ready to be fully implemented. Even so, the industry seems to be making announcements daily on new proofs of concept and progress that may lead to pilots, so that timeline could accelerate. In some cases, there have been announcements the technology will be used within the next year or two in actual production environments. The initial relatively simple proofs of concept must be followed by much more complex demonstrations in real-world situations before these technologies can be safely deployed in today’s highly interconnected, synchronized, and far-reaching financial markets.

Although many private and inward-facing projects are being explored, the industry has also recognized the need to collaborate at early stages of development. An important positive development is that industry participants are actively engaging with each other to look for common approaches. Some groups are creating standards that facilitate common platforms to enable greater interoperability of often proprietary applications that are built on them and interoperate through application program interfaces, or APIs.

In coming months and years, innovators, investors, and financial practitioners will no doubt make important strides in addressing key challenges such as adopting common standards, achieving interoperability between and among legacy systems and evolving distributed ledgers, improving scalability and computational throughput, and improving cryptographic security. These are positive developments that we will monitor closely.

US Consumer Credit Stronger

The latest consumer credit data from the federal reserve, including provisional data for August 2016 shows rise to a seasonally adjusted annual rate of 8-1/2 percent. Revolving credit increased at an annual rate of 7 percent, while nonrevolving credit increased at an annual rate of 9 percent.

us-credit-aug The data set covers most credit extended to individuals, excluding loans secured by real estate. The percent changes are adjusted to exclude the effect of such breaks. In addition, percent changes are at a simple annual rate and are calculated from unrounded data.

Nonrevolving includes motor vehicle loans and all other loans not included in revolving credit, such as loans for mobile homes, education, boats, trailers, or vacations. These loans may be secured or unsecured.

Here is the longer term trend. Shaded area is the great recession. We see similar growth rates over the past couple of years, highlighting credit growth higher than inflation or income. Further evidence of the growing household debt.

chart