Chief Economist for the ABS, Bruce Hockman, said: “The economy has continued to grow and picked up through the year, however the rate of growth remains below the long run average.”
Domestic demand remained subdued with 0.1 per cent growth in the December quarter. A pick up in household discretionary spending and continued increases in the provision of government services was dampened by falls in dwelling and private business investment.
Falls in dwelling investment continued, declining 3.4 per cent during the quarter, the sixth consecutive fall. This fall was consistent with the decline in construction industry value added, falling 2.3 per cent. The housing market recovery is evident in the increase in ownership transfer costs, rising 12.3 per cent during the quarter to be up 6.5 per cent through the year.
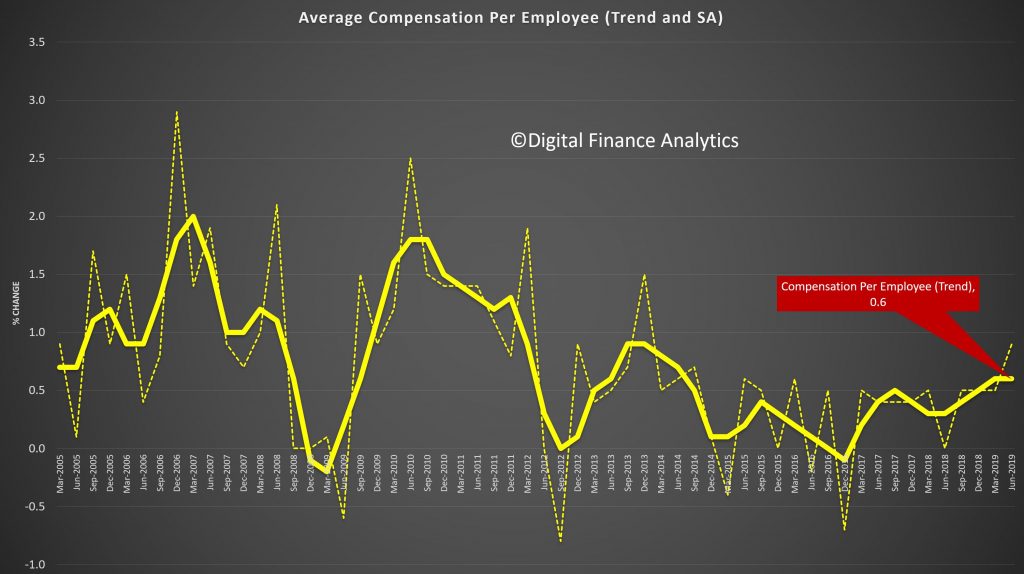
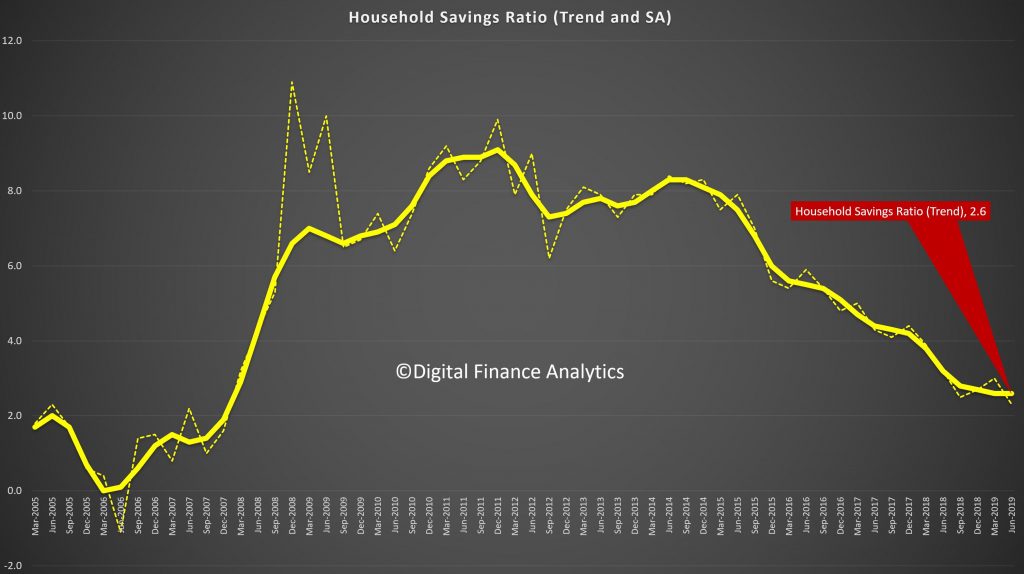
Household income remained steady with compensation of employees recording its twelfth consecutive rise, increasing 1.0 per cent during the quarter. This reflects a rise in the number of wage and salary earners as well as a steady increase in the wage rate. Non-life insurance claims contributed to household income reflecting increased claims attributed to natural disaster occurrences in the quarter. The household saving to income ratio was 3.6 per cent, driven by the subdued consumption coupled with steady increases in wages and a boost in insurance claims.
The Mining industry provided additional strength to the economy, with growth in production volumes of 1.6 per cent, strengthening through the year to 7.3 per cent. This was reflected in the growth in mining exports and inventories.
Falling prices for key export commodities impacted the terms of trade in the December quarter, which fell 5.3 per cent. This reduced nominal GDP, which fell 0.3 per cent, as lower coal, iron ore and gas prices contributed to more subdued company profits. Mining profits declined 2.6 per cent for the quarter.
Real net national disposable income declined 0.9 per cent. “Fluctuations in commodity prices have significant effects on the Australian economy in terms of export revenues and real income,” added Mr Hockman.
But the real question is, does the GDP really tell us anything useful? I discuss the GDP question with American in OZ Salvatore Babones, Associate Professor, University of Sydney.
The good news is our economy was performing better than had been thought in the lead-up to the bushfires and coronavirus. Via The Conversation.
Updated figures in Wednesday’s national
accounts show the economy grew 0.6% in the three months to September,
rather than the 0.4% previously reported, and a healthier-than-expected 0.5% in the three months to December.
Combined, these figures pushed annual
economic growth up above 2% to 2.2% for the first time in a year in
which it had been below 2% for the longest period since the global
financial crisis.
Not to put too fine a point on it, it looks as if we were actually experiencing the the “gentle turning point” repeatedly promised by Reserve Bank Governor Philip Lowe.
As Lowe put it during the second half of last year:
After having been through a soft patch, a gentle turning point has been
reached. While we are not expecting a return to strong economic growth in the near term, we are expecting growth to pick up.
The figures show the economy began (gently) picking up after the Reserve Bank began cutting rates in June. Counting this week’s latest interest rate cut, it has cut four times.
But the coronavirus and the bushfires have consigned the turning point to history.
Negative growth now possible
Not for a minute does Treasurer Josh Frydenberg believe the economy continued to improve this quarter, the March quarter.
Reminded that the support package
promised by the prime minister will come too late for the three months
to March, and reminded that many businesses haren’t been able to trade
much, Frydenberg was asked to assess the risk the economy might now be
going backwards, a state of affairs that if it continued long enough
would be a recession.
He replied that the Treasury believes the
bushfires alone will shave 0.2 points from growth in the March quarter.
Added to that will be the risk from the spread of the coronavirus, which
he believes will be “substantial”.
Tonight (Wednesday) Frydenberg and
Treasury officials will take part in a phone hookup with other members
of the International Monetary Fund to discuss developments including
interest rate cuts in both Australia and the United States.
Treasury update on Thursday
The Treasury will finalise its estimate of
the impact of the coronavirus on March-quarter GDP later in the evening
and report it to a Senate estimates hearing beginning at 9am Thursday.
It means we will know the likely impact at about the same time as the treasurer.
To support retirees hurt by four near-consecutive rate cuts, the treasurer is considering cutting the deeming rate
– the rate investments are deemed to have earned for the purposes of
the pension income test. It’ll be the second deeming rate cut in the
space of a year and will make it easier for retirees earning very little
to remain on the pension.
The focus of the support package will
business investment, which slid an unexpected 1.1% in the final three
months of the year and 3.4% over the course of the year in defiance of
budget forecasts it would climb.
Standard of living slipping
Although not ruling out support for
householders, Frydenberg said mortgage holders had done well out of the
past four rate cuts. Households with A$400,000 mortgages could soon be
paying $3,000 less per year than they had in June.
Living standards, as measured by the
Reserve Bank’s preferred measure, real net national disposable income
per capita, went backwards in the December quarter, slipping 1.3%. Over
the year, it climbed just 1.2%.
Household spending recovered somewhat,
climbing 0.4% in real terms in the December quarter after inching ahead
only 0.1% in the September quarter.
Throughout the year to December, real
household spending grew 1.2% at a time when Australia’s population grew
1.5%. This means the consumption of goods and services per person went
backwards.
Government spending provided substantial
support. Over the year to December public spending on infrastructure
grew 4.1% in real terms.
Deputy Prime Minister Michael McCormack
said on Wednesday he would try and boost that by asking state and local
governments to bring forward whatever projects they could, to start work
in the next three to six months.
Recurrent government spending grew 5%.
Author: Peter Martin, Visiting Fellow, Crawford School of Public Policy, Australian National University
According to a Moody’s report, just out, the near-term credit implications for Australia and the states are limited given a likely contained economic impact and the availability of ample fiscal buffers.
Taking into account both the direct costs and indirect loss of revenue, Moody’s estimate that the cost of the bushfires will reduce Australia’s general government’s fiscal balance overall by around 0.1% of GDP per year in the next two fiscal years.
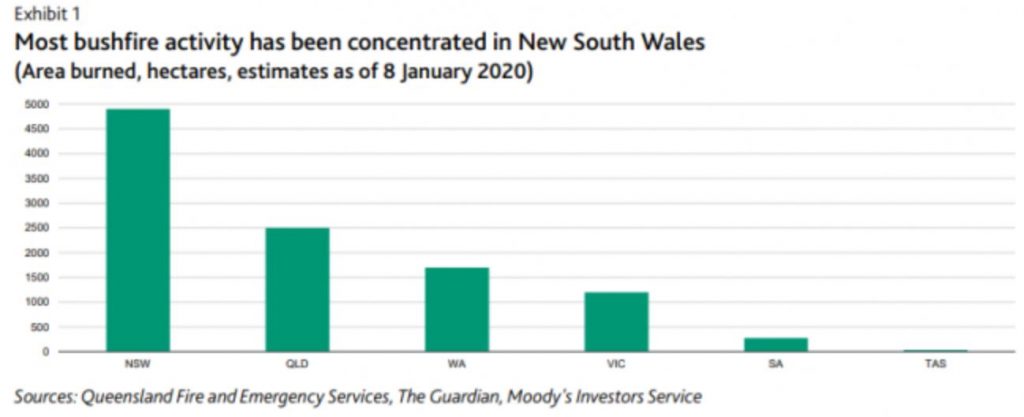
The bushfires are mainly concentrated in rural areas, predominantly in national parkland. As a result, the economic cost has been limited, says Moody’s, who revised their forecast for 2020 GDP growth to 2.1% from 2.3% in 2020.
Although fires have burnt across the country, they say the bushfires have been concentrated in NSW, covering an area more than six times larger than that affected by the 2018 Californian fires, for an economy that is seven times smaller than that of California. Predictions by the Australian Bureau of Meteorology indicate that the fires are likely to continue and could even intensify over the coming months.
The Commonwealth government bears some of the direct containment and repair costs – such as for the deployment of military resources for firefighting – as well as the ultimate costs through transfers to the states. The government also incurs some expenditure on relief for affected areas, with AU$2 billion already announced to support affected farmers and businesses. Moreover, Commonwealth tax revenue from affected areas will be hit by temporarily weaker economic activity.
In 2020, reconstruction will boost economic activity, partially offsetting the initial losses from the areas which are being rebuilt.
Over the longer term, if bushfires of this severity were to become more frequent, they would expect tourism and investment, especially in rural areas, to be affected:
…over time, increasingly frequent and severe natural disasters related to climate change are likely to result in rising and recurring costs for Australia’s general and local governments, which will test their capacity – currently strong – to mitigate these costs
Courtesy of Nucleus Wealth’s Damien Klassen. Damien runs the investment side of Nucleus, selecting stocks suggested by analysts and implementing the asset allocation
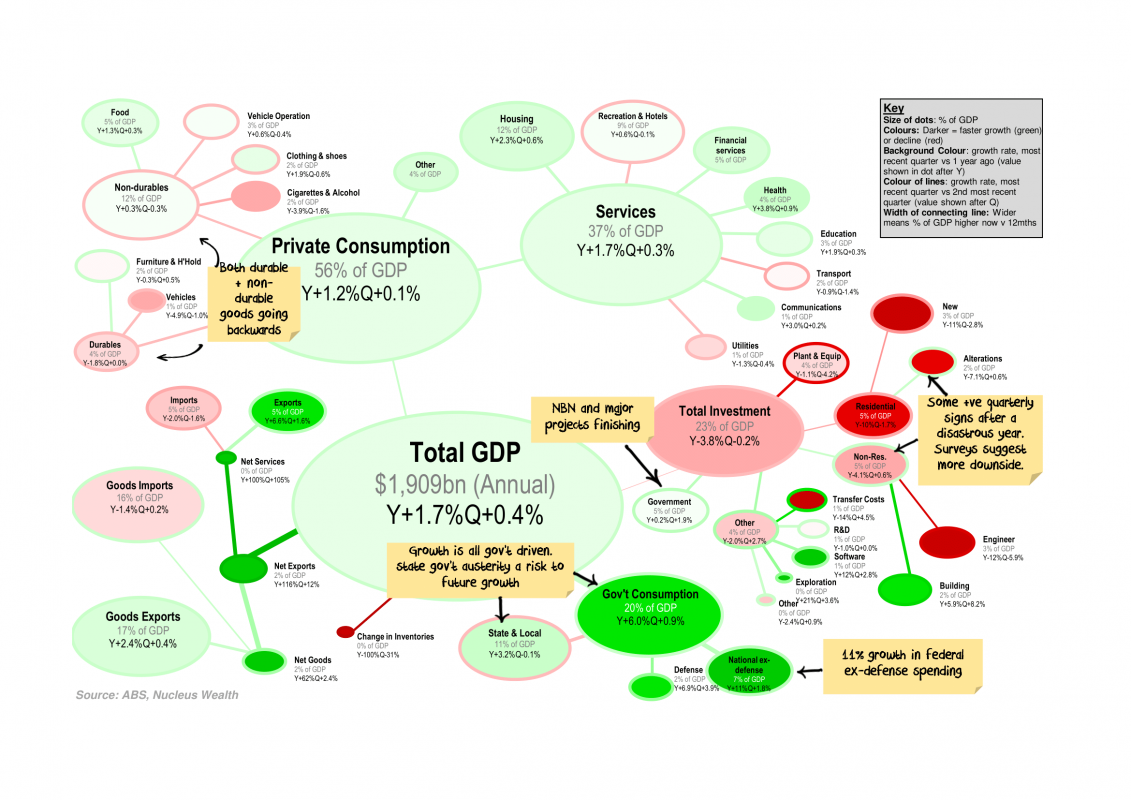
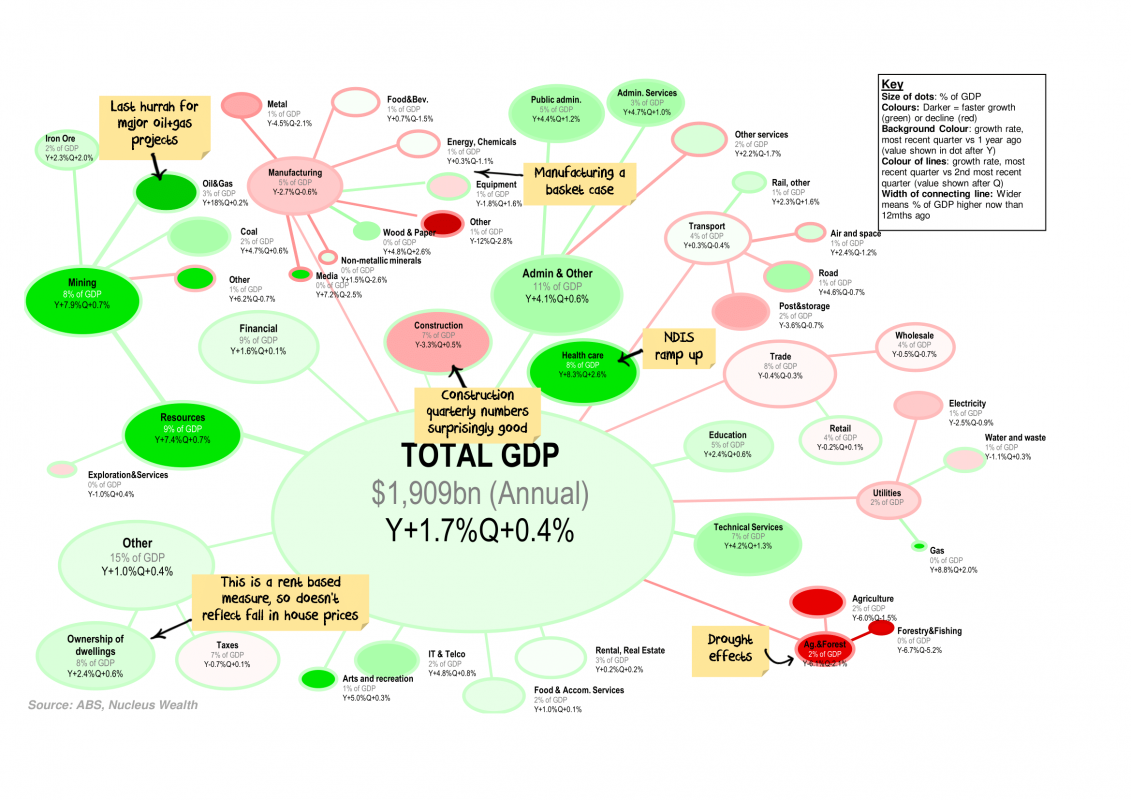
Every quarter I like to look at the changes in Australian GDP
and which categories are responsible for the growth / decline. Each
bubble represents a category of GDP proportionate to its size, colours
represent the growth rate.
Click the charts for a large version and commentary:
Federal Government spending (+11% for non-defence, 7% for defence over the year) the only thing keeping GDP above zero.
Investment
growth was not good, but I was expecting worse. Possibly there are
green shoots, but capex surveys and investment forward indicators
suggest there is still more downside.
State & Local
government spending has turned negative – with a low number of property
transactions this is likely to remain a feature
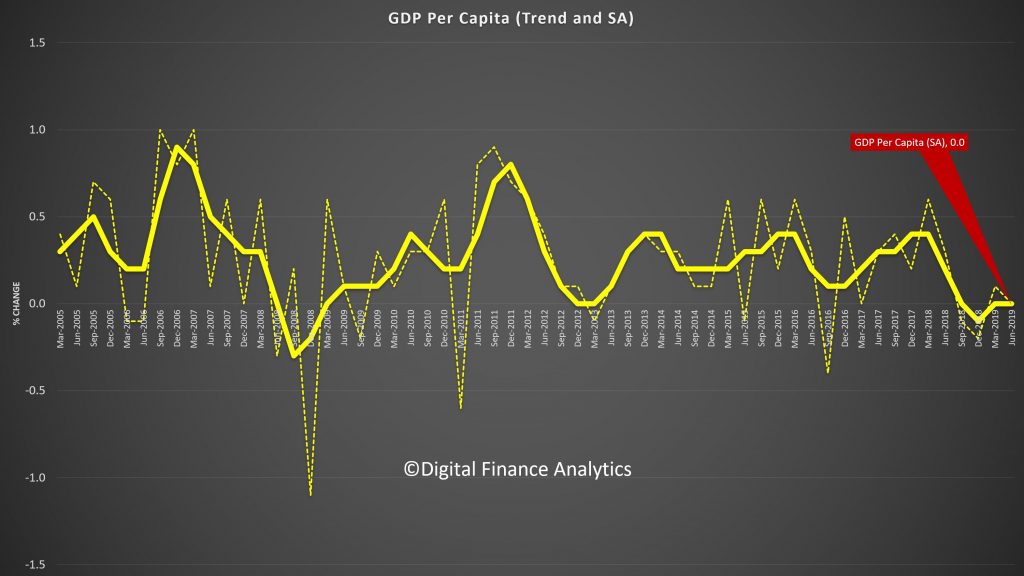
We look at the latest ABS national accounts data. We called it right! Household consumption continues to die as the savings ratio slides and GDP per capital sits at zero.
The largest quarterly goods and services surplus on record at $19.9 billion and a narrowing net income deficit to $13.9 billion, contributed to Australia recording a seasonally adjusted $5.9 billion current account surplus for the June quarter 2019, according to latest information released by the Australian Bureau of Statistics (ABS). This is Australia’s first current account surplus since the June quarter 1975.
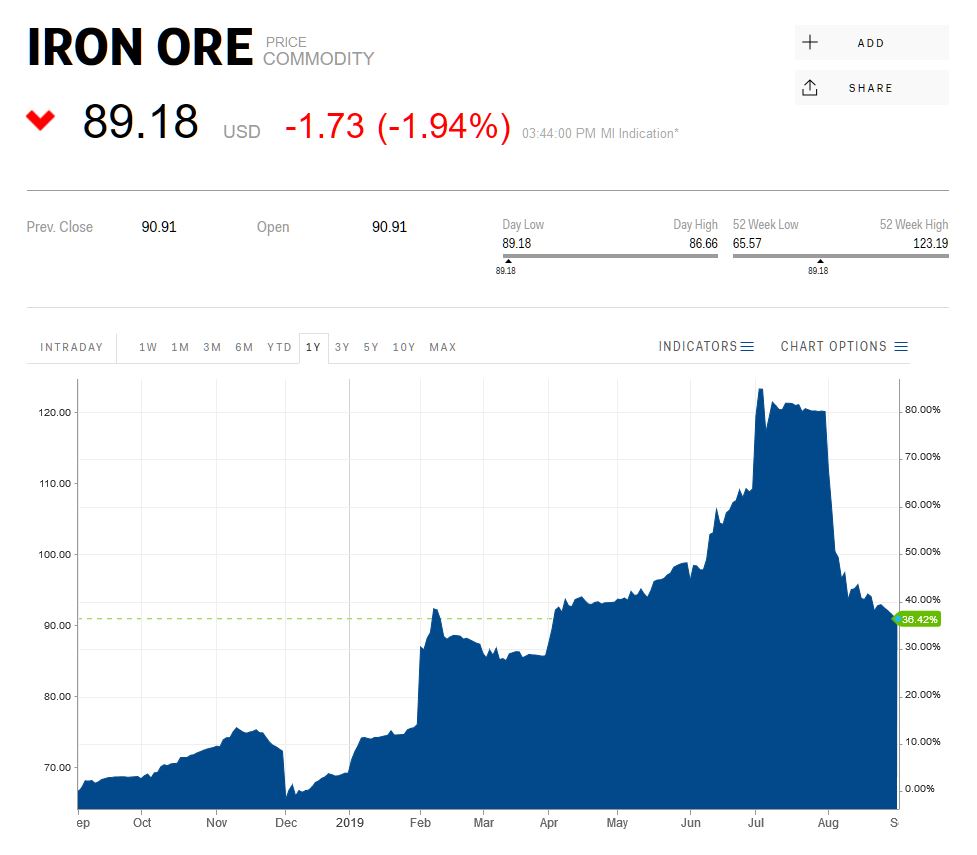
This is thanks to the high iron ore price, which of course has now dropped back significantly. The RBA’s expectation of a 0.8% GDP number tomorrow still seems far fetched, but we might just escape a negative quarter…
The ABS shows this quite clearly.
ABS Chief Economist Bruce Hockman said: “Six consecutive quarters of goods and services surpluses, broadly commodity driven, have laid the foundation for our first current account surplus in 44 years.
“The surplus is both a price and volume story. Similar to the March quarter 2019, continued global supply interruptions have maintained high iron ore prices into the June quarter, boosting our export receipts to record levels.
“Export volumes for the key bulk commodities of liquid natural gas, coal and iron ore were up, while volumes fell across several import categories resulting in an increased June quarter trade surplus.”
Contribution to Gross Domestic Product In seasonally adjusted chain volume terms, the balance on goods and services surplus increased $2.7 billion, widening the surplus to $6.4 billion. The rising exports and falling imports resulted in an expected contribution of 0.6 percentage points to growth in the June quarter 2019 Gross Domestic Product.
International Investment Position Australia’s net international investment position was a liability of $1,001.6 billion at 30 June 2019, an increase of $9.2 billion on the revised 31 March 2019 position of $992.3 billion.
Australia’s net foreign debt liability position increased $19.4 billion to $1,143.5 billion. Australia’s net foreign equity asset position increased $10.2 billion to $141.9 billion at 30 June 2019.
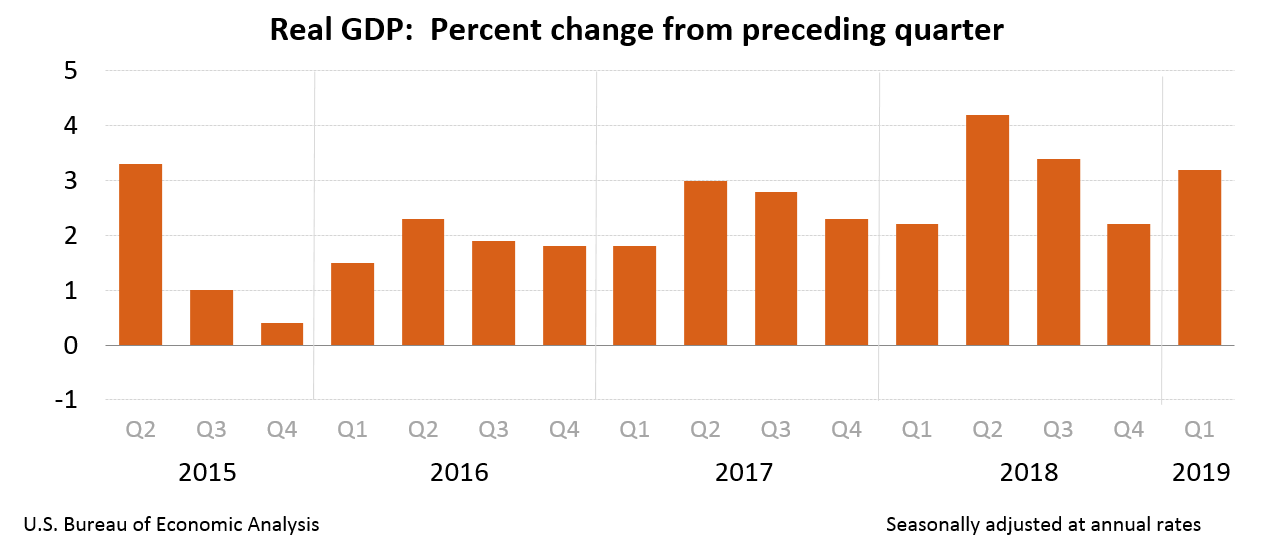
The latest data from the bea shows a GDP provisional estimate significantly above expectations, which may suggest the FED will not have to be as patient as they signalled recently. Perhaps expectations of a future recession are overblown?
Real gross domestic product (GDP) increased at an annual rate of 3.2 percent in the first quarter of 2019, according to the “advance” estimate released by the Bureau of Economic Analysis. In the fourth quarter of 2018, real GDP increased 2.2 percent.
The Bureau’s first-quarter advance estimate released today is based on source data that are incomplete or subject to further revision by the source agency. The “second” estimate for the first quarter, based on more complete data, will be released on May 30, 2019.
The increase in real GDP in the first quarter reflected positive contributions from personal consumption expenditures (PCE), private inventory investment, exports, state and local government spending, and nonresidential fixed investment. Imports, which are a subtraction in the calculation of GDP, decreased. These contributions were partly offset by a decrease in residential investment.
The acceleration in real GDP growth in the first quarter reflected an
upturn in state and local government spending, accelerations in private
inventory investment and in exports, and a smaller decrease in
residential investment. These movements were partly offset by
decelerations in PCE and nonresidential fixed investment, and a downturn
in federal government spending. Imports, which are a subtraction in the
calculation of GDP, turned down.
Current dollar GDP increased 3.8 percent, or $197.6 billion, in the first quarter to a level of $21.06 trillion. In the fourth quarter, current-dollar GDP increased 4.1 percent, or $206.9 billion.
The price index for gross domestic purchases
increased 0.8 percent in the first quarter, compared with an increase of
1.7 percent in the fourth quarter (table 4). The PCE price index
increased 0.6 percent, compared with an increase of 1.5 percent.
Excluding food and energy prices, the PCE price index increased 1.3
percent, compared with an increase of 1.8 percent.
Personal Income
Current-dollar personal income increased $147.2
billion in the first quarter, compared with an increase of $229.0
billion in the fourth quarter. The deceleration reflected downturns in
personal interest income, personal dividend income, and proprietors’
income that were partly offset by an acceleration in personal current
transfer receipts.
Disposable personal income increased $116.0 billion,
or 3.0 percent, in the first quarter, compared with an increase of
$222.9 billion, or 5.8 percent, in the fourth quarter. Real disposable personal income increased 2.4 percent, compared with an increase of 4.3 percent.
Personal saving was $1.11 trillion in the first quarter, compared with $1.07 trillion in the fourth quarter. The personal saving rate
— personal saving as a percentage of disposable personal income — was
7.0 percent in the first quarter, compared with 6.8 percent in the
fourth quarter.
Australia’s big little economic lie was laid bare on Wednesday.
National accounts figures show that the Australian economy grew by just 0.2%
in the last quarter of 2018. This disappointing result was below market
expectations and official forecasts of 0.6%. It put annual growth for
the year at just 2.3%.
But the shocking revelation was that Gross Domestic Product per
person (a more relevant measure of living standards) actually slipped in
the December quarter by 0.2%, on the back of a fall of 0.1% in the
September quarter.
These are the first back-to-back quarters of negative GDP per capita growth in 13 years – since 2006.
We’re going backwards, for the first time in 13 years
The reason this is significant is that the Australian convention
around what constitutes a recession is two back-to-back quarters of
negative GDP growth.
Since more people in the economy mechanically increases overall GDP,
you might think that measuring things on a per-person basis gives a
better sense of whether we are better off or worse off.
And you would be right. Why then, do we talk so much about overall GDP?
One answer is that in a lot of advanced economies there isn’t very
much population growth, so overall GDP is a good enough measure.
Population growth hides it
The more insidious answer in Australia is that, for a long time, our high population growth, fed by a high immigration rate, has masked a much less rosy picture of how we are doing. And neither side of politics has wanted to admit it.
At 1.6% a year, Australia’s population growth is roughly double the
OECD average, which is perhaps why we hear politicians say things like
“Australia continues to grow faster than all of the G7 nations except
the United States,” as Treasurer Josh Frydenberg did this week.
The good news is that standard economic theory tells us that in the
long run, immigration has very little impact on GDP per capita in either
direction, unless it drives a shift in the population’s mix of skills.
But in the short term, it depresses GDP per capita because fixed
capital such as buildings and machines has to be shared between more
workers.
The business lobby doesn’t want us to focus on that because
population provides more customers as well as more workers, allowing
them to grow without growing domestic market share or exports.
Governments don’t want us to focus on it because adjusting for
population growth makes GDP growth look small or, as at present,
negative. Also, the tax revenue from the population growth is factored
into the official budget forecasts – but the extra social spending
needed isn’t always factored in.
Pro tip: watch for population growth as a fudge factor generating a return to surplus in next month’s budget.
There’s a better way of getting at the truth
That said, GDP itself – per capita or not – is not a great measure of
the standard of living. That’s why in 2001, the Bureau of Statistics
began also reporting real net national disposable income.
It is a measure with advantages over GDP. As the bureau points out,
it takes account of changes in the prices of our exports relative to the
prices of our imports – our terms of trade. If the prices of our
exports were increasing much faster than the prices of our imports (as
happened during the mining booms), our standard of living would climb
and real net national disposable income would reflect it, where as gross
domestic product would not, although it would reflect increased income
from increased export volumes.
To get at living standards per person, which is what we are really
interested in, the bureau also publishes real net national disposable
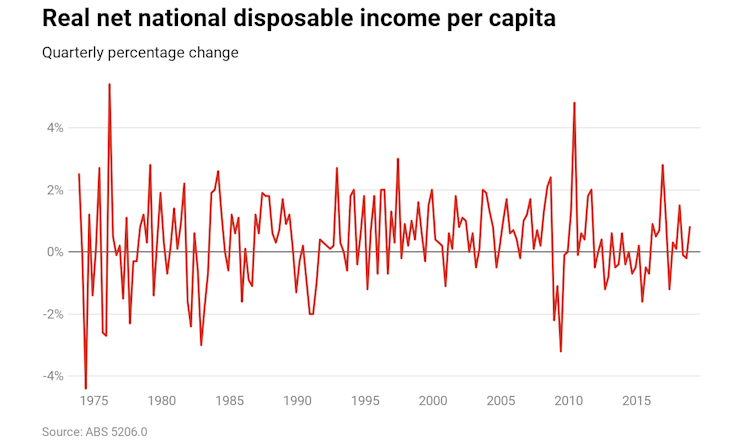
income per capita.
The graph shows that so far the growth rate of real net national
disposable income per capita hasn’t changed much, and that it has been
negative for far fewer quarters than in the Coalition’s first term in
office.
It bounces around with changes in the prices of imports and exports,
and is generally climbing less than when export prices were really high.
A year of two halves?
The treasurer painted 2018 as a “year of two halves”.
The first half was great – the annualised GDP growth rate (what it
would have been had it continued all year) was a very impressive 3.8%.
The second half was just 1%.
I’m not sure the change was that clear cut. As I wrote last September, there have been troubling signs for some time, despite the solid headline growth.
Household savings have been plummeting, real wage growth has been
stagnant, housing prices have been falling in Sydney and Melbourne.
Together they put significant pressure on household spending, which
accounts for about 60% of GDP.
Those concerns are now mainstream. Good news on export prices has
rescued tax receipts for the time being, and will probably also rescue
real net national disposable income per capita.
But the fundamentals of the Australian economy are looking somewhat
weak. Like the US and other advanced economies, we are living in an era
of secular stagnation – a protracted period of much lower growth than we
had come to expect.
And until we do something to tackle it, such as a major government investment in physical and social infrastructure, we will continue to face anaemic wage growth, shaky consumer confidence, and mediocre economic growth per person.
Author: Richard Holden, Professor of Economics, UNSW
The Australian economy grew 0.2 per cent in seasonally adjusted chain volume terms in the December quarter 2018, according to figures released by the Australian Bureau of Statistics (ABS) today. But the heavy lifting was done by Government, leading to a 2.3% annual result. In seasonally adjusted terms we had two quarter falls in GDP per capita, so we are technically in recession on a per capital basis.
Actually the December data provided no major surprises as both the headline GDP and behaviour of consumers were broadly as anticipated. This is also true on housing, investment and public demand.
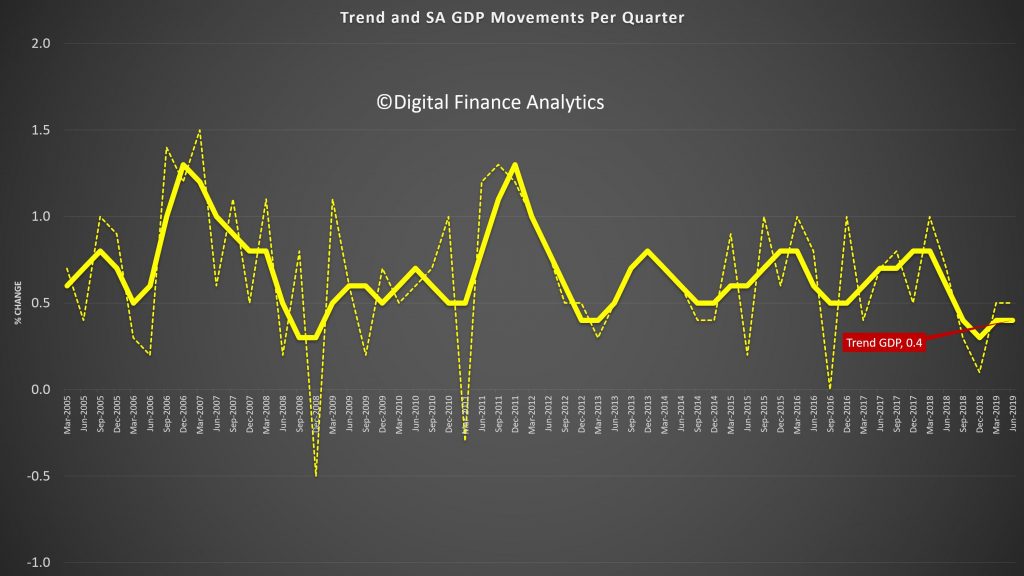
The trend data shows a fall in GDP, GDP per capital and in the savings ratio. Expect significant fiscal stimulus in the budget, and more after the election. This is an economy running of just a few cylinders.
New home building activity fell by 3.6 per cent during the final quarter of 2018 while home renovation activity declined by 3.1 per cent. Despite the softening at the end of 2018, activity was still higher than in the same quarter a year earlier.
Here is the ABS summary:
AUSTRALIAN ECONOMY GREW BY 0.2%
Australia’s gross domestic product (GDP) grew by 0.2% in the December quarter 2018, following a 0.3% rise in the September quarter. The Australian economy grew 2.3% through the year.
Government final consumption expenditure rose 1.8% in the December quarter 2018 and remains strong through the year at 5.6%. National non-defence (4.2%) was the main contributor to growth in the quarter, due to increases in social benefits to households from continued government spending on disability, health and aged care services. State and local government expenditure increased 1.1% driven by rises in non-employee expenses.
GOVERNMENT FINAL CONSUMPTION EXPENDITURE, Volume measures: Seasonally adjusted
SUSTAINED GROWTH IN INVESTMENT BY GENERAL GOVERNMENT
General government gross fixed capital formation increased 2.7% this quarter. The rise was driven by state and local general government (6.3%), with continued strength due to public infrastructure investment. This was offset by national general government, which fell 5.7% following defence purchases in the September quarter. Through the year general government gross fixed capital formation has risen 9.0%, again reflecting the high number of public infrastructure projects occurring across the country.
GENERAL GOVERNMENT GROSS FIXED CAPITAL FORMATION, Volume measures: Seasonally adjusted
BUILD UP IN INVENTORIES
Inventories held by business increased $685m in the December quarter 2018.
CHANGE IN INVENTORIES – Selected industries, Volume measures: Seasonally adjusted
GROWTH IN HOUSEHOLD CONSUMPTION SLOWS
Household final consumption expenditure increased 0.4% in the December quarter 2018, with through the year growth moderating to 2.0%. The growth in household consumption was driven by spending on health, clothing and footwear, and hotels, cafes and restaurants. There were falls in household spending for electricity, gas and other fuel, purchases of vehicles and furnishings and household equipment.
HOUSEHOLD FINAL CONSUMPTION EXPENDITURE, Volume measures: Seasonally adjusted
BROAD BASED GROWTH IN COMPENSATION OF EMPLOYEES
Compensation of Employee (COE) increased 0.9% in December quarter 2018 due to strength from both the private and public sector. Through the year COE increased 4.3% and with growth above its five year December average of 3.4% growth.
COMPENSATION OF EMPLOYEES, Current prices: Seasonally adjusted
HOUSEHOLD SAVING RATIO INCREASED MARGINALLY
The household saving ratio rose to 2.5% in the December quarter 2018. This slight pick up was due to modest growth in household disposable income alongside lower growth in household spending. The growth in gross disposable income was due to continued growth in compensation of employees as well as an increase in insurance claims received by households.
HOUSEHOLD SAVING RATIO, Current prices: Seasonally adjusted
Chief Economist for the ABS, Bruce Hockman, said: “Growth in the economy was subdued, reflecting soft household spending and a decline in dwelling investment. The approvals for dwelling construction indicate that the decline in dwelling investment will continue.”
Household spending grew by 0.4 per cent, reflecting a continuation of modest spending in recent quarters. Investment in dwellings fell 3.4 per cent.
Falls in private investment dampened growth in the quarter. This was consistent with the decline in construction industry value added, falling 1.9 per cent. Services industries supporting construction activity detracted from growth with professional scientific and technical services industry value added declining for the first time in three years. Mining investment fell in the quarter as significant projects transitioned from the construction to the production phase. This is reflected in oil and gas production, which grew 7.7 per cent.
Public demand sustained growth in the quarter. Public investment remained at high levels with State and Local government growth of 6.3 per cent reflecting continued work on a number of large infrastructure projects. Government final consumption expenditure grew 1.8 per cent, with ongoing expenditure in health, aged care and disability services. This investment translates to ongoing strength from the healthcare industry, which remains the largest contributor to economic growth.
Mr Hockman said “As the economy transitions out of the mining boom, investment has remained strong with major public works driving growth around Australia.”