
Please consider supporting our work via Patreon
Please share this post to help to spread the word about the state of things….

/
RSS Feed
Digital Finance Analytics (DFA) Blog
"Intelligent Insight"

Edwin Almeida, our property market insider discusses the factors which have led to poor urban planning, and the impact this is having on the property market, and households.
Please consider supporting our work via Patreon
Please share this post to help to spread the word about the state of things….
A number of our followers have asked about the parallels we might draw between Ireland a decade ago and Australia now.
 In this edition Economist John Adams and I discuss what happened in the Irish crash, together with Sean Quinn who was there at the time. Specifically we look at how the banks were bailed out, and consider what would happen here in a similar scenario. There are lessons to be learnt, and questions to be asked.
WARNING: this video pulls no punches!
The John Adams And Martin North DFA Page:
Please consider supporting our work via Patreon ;
Please share this post to help to spread the word about the state of things….
We look at the winners and the losers in the property market
Please consider supporting our work via Patreon
Please share this post to help to spread the word about the state of things….
The latest edition of our weekly finance and property news digest with a distinctively Australian flavour.
Please consider supporting our work via Patreon ;
Please share this post to help to spread the word about the state of things….
We discuss why prices will fall further.
Please consider supporting our work via Patreon
Please share this post to help to spread the word about the state of things….
More at: https://wp.me/p45cap-7wk
We discuss the latest official home price data
It’s official, prices are sliding in the major centres. The data from the ABS charting home price movements confirms what what we already knew. In addition, the number of property transfers are significantly down and the the total value of Australia’s 10 million residential dwellings decreased $22.5 billion to $6.9 trillion. This is just the start, in our view.
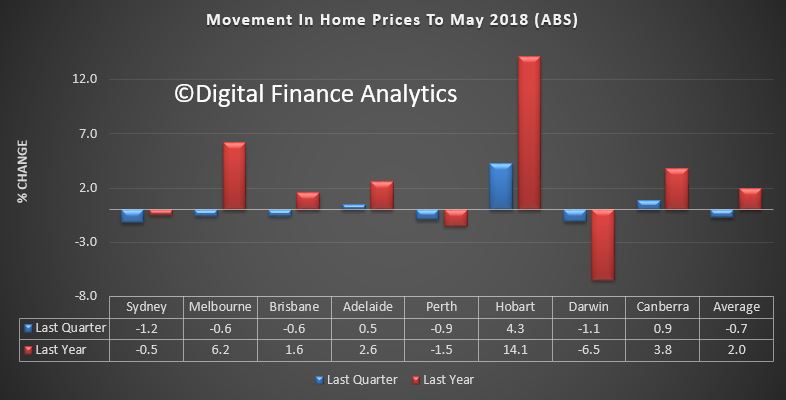
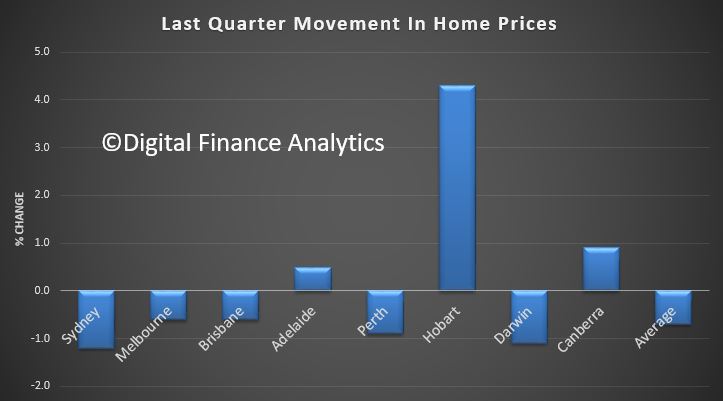
Residential property prices fell 0.7 per cent in the March quarter 2018, according to figures released today by the Australian Bureau of Statistics (ABS).
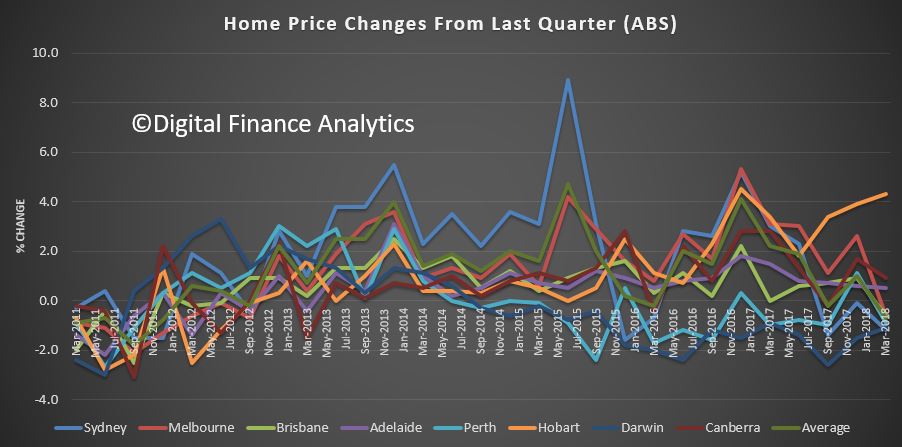
ABS Chief Economist Bruce Hockman said Australia’s two largest cities led the fall: “Sydney recorded the third consecutive quarter of falling property prices (-1.2 per cent) and the first annual price fall (-0.5 per cent) since the March quarter 2012, while Melbourne property prices fell 0.6 per cent, the first quarterly price fall since September quarter 2012.”
“Regulatory changes and tighter lending conditions have continued to affect investors, who are more active in the Sydney and Melbourne property markets. These cities have seen strong price growth over recent years particularly in detached dwellings.”
Through the year growth in residential property prices continued to moderate (2.0 per cent) in the March quarter 2018. Most capital cities have shown declines in annual growth rates since September quarter 2017, except Hobart (+14.1 per cent), which has continued to see strong rises in residential property prices.
“Positive economic conditions in Hobart, such as, solid jobs growth, rising employment, and an increase in net interstate migration, are underpinning demand for property,” Mr Hockman said. “Hobart has continued to experience consistently tight housing supply, which is leading to a strong rise in residential property prices.”
Also, the number of property transfers are down, nationally by 29% on the last quarter, 31% in Sydney and 42% in Melbourne to March 2018. While we tend to see a drop in the first quarter because of the holiday period, these falls are unprecedented, and mirrors the falls in auction values we discussed recently.
![]()
The total value of Australia’s 10 million residential dwellings decreased $22.5 billion to $6.9 trillion. The mean price of dwellings in Australia is now $687,700.
The ABS released their home price data series to December 2017 today. Sydney prices fell over the past quarter, along with Darwin. Other centres saw a rise, but the rotation is in hand.
The price index for residential properties for the weighted average of the eight capital cities rose 1.0% in the December quarter 2017. The index rose 5.0% through the year to the December quarter 2017.
The capital city residential property price indexes rose in Melbourne (+2.6%), Perth (+1.1%), Brisbane (+0.9%), Hobart (+3.9%), Canberra (+1.7%) and Adelaide (+0.6%) and fell in Sydney (-0.1%) and Darwin (-1.5%).
Annually, residential property prices rose in Hobart (+13.1%), Melbourne (+10.2%), Canberra (+5.7%), Sydney (+3.8%), Adelaide (+3.6%) and Brisbane (+2.1%) and fell in Darwin (-6.3%) and Perth (-1.7%).

The total value of residential dwellings in Australia was $6,869,006.7m at the end of the December quarter 2017, rising $92,858.9m over the quarter.
The mean price of residential dwellings rose $6,500 to $686,700 and the number of residential dwellings rose by 40,400 to 10,003,100 in the December quarter 2017.
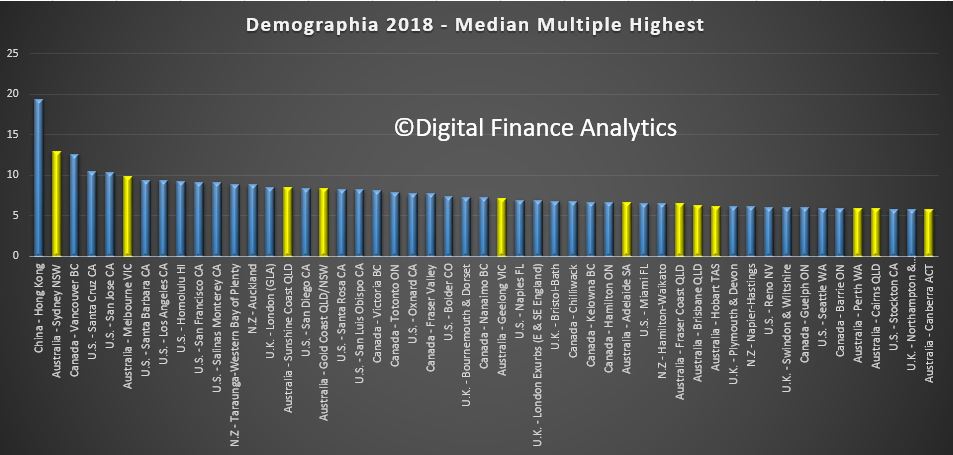
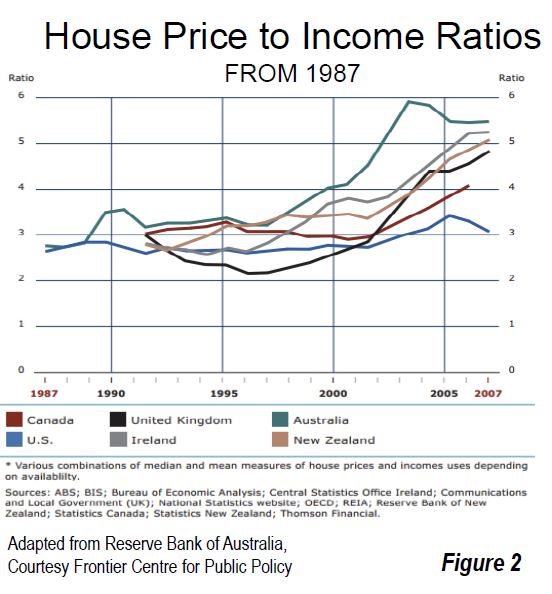
The latest 14th edition of the Annual Demographia International Housing Affordability Survey: 2018, using 3Q 2017 data continues to demonstrate the fact that we have major issue in Australia. There are no affordable or moderately affordable markets in Australia. NONE!
The major markets of Australia (6.6), New Zealand (8.8) and China (19.4) are severely unaffordable. By international standards houses are big in both Australia and New Zealand but relatively unaffordable.
Using a standard methodology across geographies, the study benchmarks affordability of middle income housing, using an index on average prices and incomes – formally, Median Multiple: Median house price divided by median household income.
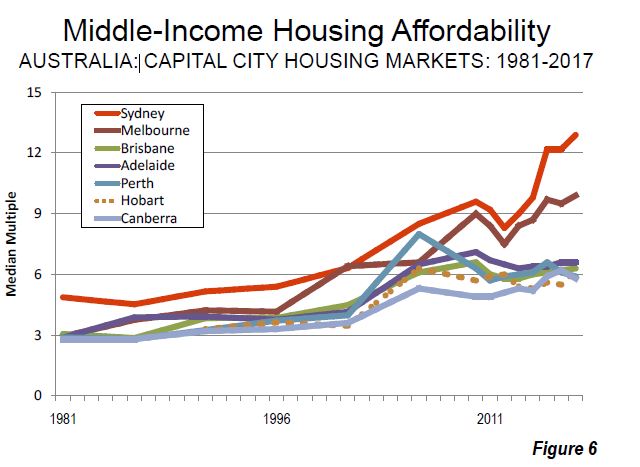
Sydney is second worst in terms of affordability after Hong Kong, with Melbourne, Sunshine Coats, Gold Coast, Geelong, Adelaide, Brisbane, Hobart, Perth, Cains and Canberra all near the top of the list. [Click on the graphic to see it larger].
 In recent decades, house prices have escalated far above household incomes in many parts of the world. In some metropolitan markets house prices have doubled, tripled or even quadrupled relative to household incomes. Typically, the housing markets rated “severely unaffordable” have more
restrictive land use policy, usually “urban containment.”
Sydney is again Australia’s least affordable market, with a Median Multiple of 12.9, and ranks second worst overall, trailing Hong Kong. Sydney’s housing affordability has worsened by the equivalent of 6.6 years in pre-tax median household income since 2001. This is a more than doubling of the Median Multiple. In contrast, Sydney’s housing affordability worsen less than one-fourth as much between 1981 and 2001.
At 12.9 Sydney’s Median Multiple is the poorest major housing affordability ever recorded by the Survey outside Hong Kong. Additionally, the UBS Global Real Estate Bubble Index rates Sydney as having the world’s fourth worst housing bubble risk (tied with Vancouver).
Melbourne has a Median Multiple of 9.9 and is the fifth least affordable major housing market internationally. Only Hong Kong, Sydney, Vancouver, and San Jose are less affordable than Melbourne. Melbourne’s Median Multiple has deteriorated from 6.3 in 2001 and under 3.0 in the early 1980s. Just since 2001, median house prices have increased the equivalent of more than three years in pre-tax median household income.
Adelaide has a severely unaffordable 6.6 Median Multiple and is the 16th least affordable of the 92 major markets. Brisbane has a Median Multiple is 6.2 and is ranked 18th least affordable, while Perth, with a Median Multiple of 5.9 is the 21st least affordable major housing market in Australia.
 The report argues that:
The key to both housing affordability and an affordable standard of living is a competitive market that produces housing (including the cost of associated land) at production costs, including competitive profit margins.
None of that currently exists in Australia, with land prices sky high, linked to lack of supply (strange given the size of the country!) as well as the financialisation of property and the massive investment sector.
In contrast with well functioning housing markets, virtually all the severely unaffordable major housing markets covered in the Demographia International Housing Affordability Survey have restrictive land use regulation, overwhelmingly urban containment. A typical strategy for limiting or prohibiting new housing on the urban fringe an “urban growth boundary,” (UGB) which leads to (and is intended to lead to) an abrupt gap in land values.
Australia is perhaps the least densely populated major country in the world, but state governments there have contrived to drive land prices in major urban areas to very high levels, with the result that in that country housing in major state capitals has become severely unaffordable.
Further evidence of a fall in home prices in Sydney, as lending restrictions begin to bite, and property investors lose confidence in never-ending growth. So now the question becomes – is this a temporary fall, or does it mark the start of something more sustained? Frankly, I can give you reasons for further falls, but it is hard to argue for any improvement anytime soon. Melbourne momentum is also weakening, but is about 6 months behind Sydney.
The Residential Property Price Index (RPPI) for Sydney fell 1.4 per cent in the September quarter 2017 following positive growth over the last five quarters, according to figures released today by the Australian Bureau of Statistics (ABS).
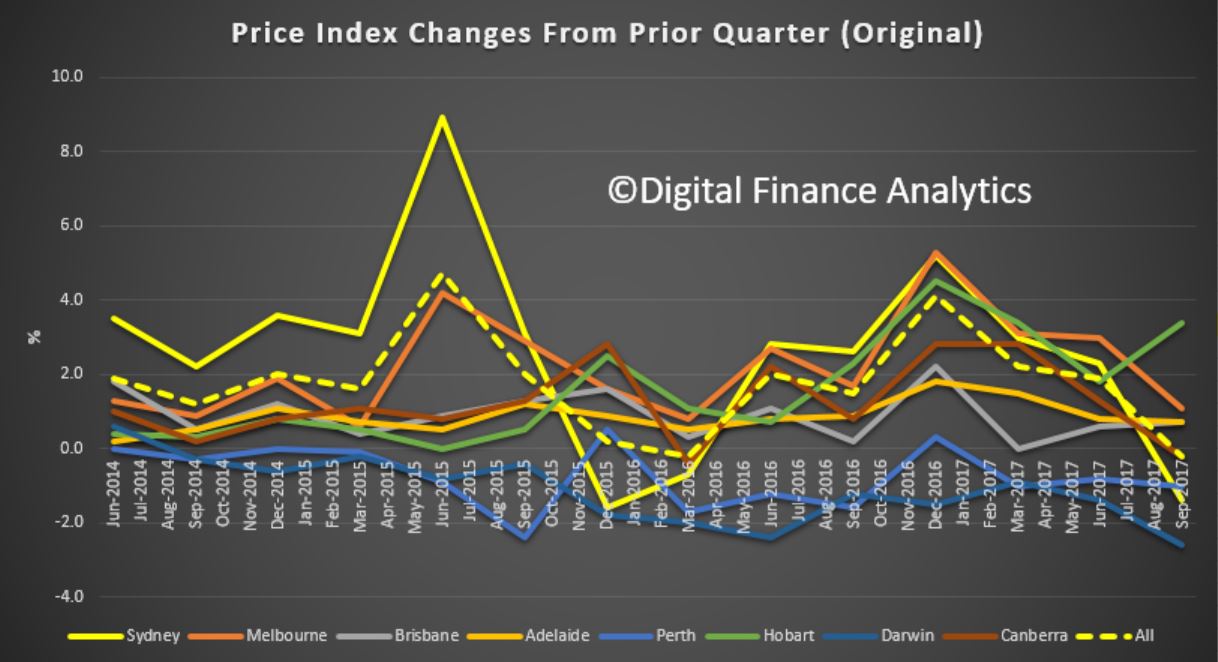
Sydney established house prices fell 1.3 per cent and attached dwellings prices fell 1.4 per cent in the September quarter 2017.
Hobart leads the annual growth rates (13.8%), from a lower base, followed by Melbourne (13.2%) and Sydney (9.4%). Darwin dropped 6.3% and Perth 2.4%.

“The fall in Sydney property prices this quarter was consistent with market indicators,” Chief Economist for the ABS, Bruce Hockman said.
Falls in the RPPI were also seen in Perth (-1.0 per cent), Darwin (-2.6 per cent) and Canberra (-0.2 per cent). These were offset by rises in Melbourne (+1.1 per cent), Brisbane (+0.7 per cent), Adelaide (+0.7 per cent) and Hobart (+3.4 per cent).
For the weighted average of the eight capital cities, the RPPI fell 0.2 per cent in the September quarter 2017. This was the first fall in the RPPI since the March quarter 2016.
“Residential property prices have continued to moderate across most capital cities this quarter,” Mr Hockman said.
The total value of Australia’s 10.0 million residential dwellings increased $14.8 billion to $6.8 trillion. The mean price of dwellings in Australia fell by $1,200 over the quarter to $681,100.