July 2019 Mortgage Stress Still Up, Despite Rate Cuts

The DFA mortgage stress tracker to the end of July 2019 is released today. This is based on our rolling 52,000 household surveys and includes data up to the 31st July. More than 70,000 households risk default over the next 12 months.

Despite the two RBA rate cuts, and the tax refunds which some can claim, (after the legislation was passed in Parliament in July), the impact on household budgets with mortgages has yet to translate into a meaningful easing in mortgage stress. In fact, we doubt it will.

This is because the reductions in variable mortgage rates for existing customers have yet to work through the system, and the tax refund claims take some time to be processed. Meanwhile costs of living continue to escalate.

We also note that many households who have attempted to refinance to the much lower attractor rates and are in mortgage stress are being declined. In an absolute sense many of these households are locked into higher rates than the best available, and fall outside the revised (even if loser now) underwriting standards. We estimate there are more than 300,000 households who are mortgage prisoners as a result.

The total number of households estimated to be in mortgage stress in July 2019 is 1,080,000 or 32.1% of borrowing households. This is another record.

The RBA data to March 2019 showed that the ratio of household debt to income rose again to 189.7, and credit growth is still running at a faster rate than household incomes. And yet APRA reduced underwriting standards!

Analysis of stress across the country shows Western Australia still leads, but more households in New South Wales, Victoria and Queensland are under financial pressure.

We define households as “stressed” when current income does not cover current expenditure, including mortgage repayments. Households manage this deficit by cutting back on spending, putting more on credit cards and other loans, or try to refinance to a cheaper loan. Those in severe stress are deeply in deficit. It can take a household many months to slide from stressed to severely stressed, beyond this point, bank foreclosure or a forced sale in more likely.

We note that households in this severely stressed state are now much more likely to be forced to sell, as bank hardship schemes only protect households for a period. We note that in some post codes in Western Australia, where this has been an issue now for some time, defaults and foreclosures are running at three to four times the national average.

We also continue to see stress breaking out across most of our household segments, this is not just a factor running in battling households. Indeed, banks have been treating more wealthy groups very generously in terms of loan amounts, because they have other assets (even if they are also mortgaged). Risks in the affluent groups are rising still, and as the share market reverses, this will become significant.

Stress does vary across the regions.

And finally, here are the top post codes in terms of mortgage stress.

WA postcode 6065, the area around Tapping and Hocking has the largest count of stressed households this month, followed by Cambelltown in NSW 2560, Toowoomba in QLD 4350, Liverpool in NSW 2170, Ballarat 3350 in VIC and Narre Warren in VIC, 3895. All these areas are locations where there has (and continues to be) considerable new construction. Many households purchased close to the top of the market, and are now experiencing negative equity, with prices in some locations down more than 30%. Some were first time buyers, others traded up to a new property.

We will discuss the drivers of stress when we publish the next edition of our surveys, but we note that households are reporting significant ongoing rises in fuel costs, child care costs, healthcare costs (especially health insurance), school fees, and local authority rates. In many cases any relief from lower mortgage rates is blotted up by other living costs. The truth is only significant increases in take-home pay would alleviate their financial pressures, but in the current situation, this is unlikely.

Finally, as I often say, many households do not maintain a household budget, so they do not know their true financial position. This is an essential first step to managing financial issues. The ASIC Money Smart Web site offers some useful tools.

Next, it is important to prioritise spending, and avoid using high rate credit cards. Pay these off first.

Third, if households are getting into difficulty financially, its important to act early, rather than hoping things will work out. And Banks have an obligation to help, to talk to them. So talk to your lender.

Rising Household Debt May Weigh on Medium-Term Chinese Growth

Chinese household debt has continued to rise rapidly, reaching 85% of disposable income at end-2018, Fitch Ratings says in a report published today. Rising debt servicing costs do not pose near-term risks to financial stability, but will weigh on economic growth in the medium term and this is reflected in our latest GDP forecasts.

Chinese household debt grew by 18.2% last year, slightly slower than in 2017 but still nearly double the rate of nominal GDP growth. They estimate that household debt rose to about 53% of GDP last year, up from just 18% a decade earlier. This increase was largely driven by mortgage borrowing, but has spread to other products such as credit cards, where the outstanding balance of debt was similar to the US, at about USD1 trillion at end-2018.

The household debt-to-disposable income ratio is lower than most developed markets. But the gap will narrow rapidly, with the ratio rising to close to 100% at the end of this decade if growth rates remain unchecked.

The rapid pace of household debt growth is more of a concern than the level. Closing the gap with international peers would add considerably to China’s macroeconomic vulnerabilities, given its already high corporate debt burden. Rising consumer credit could support economic growth and rebalancing towards consumption in the near term. In their latest Global Economic Outlook published on 17 June, they increased our forecast for annual real GDP growth this year slightly, by 0.1pp to 6.2%, as earlier policy easing appeared to have gained traction. But consumer indicators have been relatively soft.

2Q19’s yoy growth rate of 6.2%, released by the National Bureau of Statistics on 15 July and in line with our GEO forecast, is consistent with their view that following a stronger-than-expected first quarter, growth would slow before stabilising. Rising household debt may lead to overleveraging by individual borrowers, eventually becoming a headwind to growth as debt service costs rise at the expense of other discretionary spending. They reduced their 2020 growth forecast by 0.1pp to 6.0% in the GEO, and see growth slowing to 5.8% in our 2021 forecast. A sharp correction in property prices is a downside risk, given households’ significant exposure to housing loans.

Household debt accounts for just 18% of banks’ assets in China, lower than many other APAC jurisdictions. But several medium-sized banks have aggressively expanded their lending in the segment, given continued corporate deleveraging efforts. Ping An Bank stands out, with 84% of its loan increase in 2017-2018 in retail loans, especially credit cards.

Among securitised assets in Chinese consumer ABS deals, unsecured consumer lending, which is less regulated than secured lending, exhibits a worse performance. Secured loans, like housing mortgages and auto loans, have been robust despite rising household debt because they benefit from stringent underwriting guidelines stipulated by regulators, and low average loan-to-values provide significant buffers against declines in collateral market value.

Securitisation accounts for about 2%of Chinese banks’ funding source for household debt. Securitised assets, which have performed better than banks’ overall books, can provide a direct and granular insight about asset-specific performance. The performance of secured loans, like housing mortgages and auto loans, has been robust despite rising household debt because they benefit from good economic environment and stringent underwriting guidelines stipulated by regulators.

Warning issued over housing market ‘bull trap’

The recent spike in housing market sentiment could be luring speculators into a “bull trap” with the dwelling values to continue falling, according to analysts. From Mortgage Business.

Over the past few months, there have been suggestions that green shoots have begun to emerge in the housing market, following two years of price declines.

Some indicators have suggested that the outcome of the federal election – which signalled the defeat of the Labor opposition’s proposed changes to negative gearing and the capital gains tax (CGT) – as well as recent cuts to the official cash rate from the Reserve Bank of Australia (RBA) and changes to the Australian Prudential Regulation Authority’s (APRA) mortgage serviceability assessment guidance have improved market sentiment, which may in turn trigger a rise in demand for housing.  

Recent property price data has also indicated that, on average, dwelling values are beginning to stabilise.

CoreLogic’s latest Hedonic Home Value Index reported that values increased for the first time since July 2017 in Sydney and November 2017 in Melbourne, rising by 0.1 per cent and 0.2 per cent, respectively. 

However, according to principal of Digital Finance Analytics Martin North and investment manager of Alto Capital Tony Locantro, housing market speculators are at risk of being ensnared in a “bull trap”, claiming that recent reports of a recovery in the housing market may be premature.

Speaking to Mortgage Business, Mr North noted that recent mortgage rate cuts would not provide universal relief to borrowers, claiming that the continued crackdown on living expenses for home loan applications would imprison some mortgage holders looking to refinance.    

“We know that interest rates have dropped and that means lending rates are lower, and that does mean that there’s a little bit of latitude with regards to the multiples that you can get,” he said.

“But of course, there is still much tighter lending standards, relative to where we were 18 months to two years prior.

“My research suggests that around 300,000 households across Australia are potentially in risk of being mortgage prisoners.”

Mr North added that while demand for housing may have lifted in some segments of the market, overall activity remains “weak”.

The DFA principal said that while first home buyers (FHBs) may have been emboldened to enter the market as prices fell, interest from foreign investors has waned.

“There are international reasons for that. There’s been a tightening in China, so property investors are not really convinced that there’s going to be any capital growth from this point,” he continued.

According to Mr North, domestic property investors are also reluctant to take risks with strong capital growth unlikely.

“If you’re a property investor, you would not buy now, because even the most bullish of people are saying that it’s an ‘L-shaped’ recovery – in other words, prices may go sideways. That may be a little growth, but nothing like the capital growth that we saw previously,” he said.  

“If you look at rentals, they’re going backwards, not growing. Basically, you might pay a little less because interest rates are lower, but lower rentals are offsetting that. 

“My calculations suggest that we’ve still got half of property investors underwater now on a net rental basis, which suggests that the property investment sector is pretty weak.”

Moreover, Mr North claimed that concerns over building quality, brought to the fore by the Opal Tower crisis, would also weigh on demand, and in turn stunt price growth.

“It’s really playing out more aggressively than I expected,” he said. “We’re finding more and more properties that have issues.”

He added: “My worry is that there’s a whole bunch of people who are sitting in properties with defects, but nobody wants to talk about them because if you start talking about them, then you basically pull the value of your property down. 

“I think we’re going to see tighter regulations and changes to the supervision processes ahead. If people are going to pay more for indemnities, then that’s going to flow through to greater costs or cost of insurance going up.”

Further, the analyst said that “worrisome” domestic and international economic conditions would also hinder any potential for a recovery in the housing market.

“I don’t think we’re going to see any growth in income, and I think that we’re going to find that the broader unemployment number goes the wrong way,” he said.

“The Reserve Bank wants the unemployment rate to be [below 5 per cent], but I think it’s going to be [above 5 per cent].

“We also know that there’s significant pressure on the retails sector, and I don’t see that turning around. 

“I guess my question is, where is growth going to come from to actually stimulate it? I can’t see where that is coming from.”

Mr North said that while some locations may experience price growth over the coming years, he expects dwelling values to continue falling in the outskirts of major capital cities.

“If you put all that in perspective, sure there will be some postcodes, particularly houses close to the major centres in Sydney and Melbourne where there is limited supply and some demand from local buyers who want to trade up,” he said.

“You will probably see some upward movement in those areas, but it will be offset by more falls on the urban fringe where we’ve had massive oversupply.

“Even in a steady state scenario, I can’t see any significant price growth from this point.” 

More Households Are Renters Or Hold Mortgages

The ABS released their latest research on households and wealth, with a focus on housing. It shows that a greater proportion of households now rent, and those owning property are more likely to use a mortgage. This is consistent with our own surveys and is the consequence of the high price of property, and big debt. The net result is a lower proportion of households own their property debt free. The tantamount failure of public policy over a generation and more!

The Survey of Income and Housing (SIH) collects data from households across Australia to measure levels of housing occupancy and costs and how these change over time.


In 2017–18:

  • Around two thirds (66%) of Australian households owned their own home with or without a mortgage, a decrease from 68% in 2015–16.
  • Almost one third (32%) of Australian households rented their home in 2017–18, an increase from 30% in 2015–16.
  • Average weekly housing costs increased to $484 for owners with a mortgage (up $15 per week from $469 in 2015–16) and remained relatively stable for the other major tenure types ($53 for owners without a mortgage, $366 for renters).
  • Households continued to spend 14% of their gross weekly income on housing costs (owners with a mortgage spent 16% and renters spent 20%).
  • The average number of persons per household remained stable at 2.6, and the average number of bedrooms per dwelling was unchanged at 3.2.
  • Applying the Canadian National Occupancy Standard for housing utilisation, almost one in twenty (4%) of Australian households required at least one additional bedroom to meet the requirements of the household, while more than three quarters (79%) of households had at least one bedroom spare.
  • One in five households (20%) owned one or more residential properties other than their usual residence. Of those that owned other residential property, almost three quarters (71%) owned a single property, while one in twenty (5%) owned four or more properties.
  • More than half (55%) of recent first home buyers were households with a reference person aged under 35 years.

Household Debt Ratios And Mortgage Stress Continues To Rise

We have released the June 2019 mortgage stress results, based on our running 52,000 household surveys. We found that 32% of households are now dealing with mortgage stress, a record, meaning they are having cash flow issues managing their finances and mortgage repayments.

This translates into more than 1,063,000 households spread across the country, and nearly 71,000 risk default in the year ahead, even taking into account the fall in mortgage repayments represented by the recent rate cuts. Banks loses will rise.

This is because the costs of living continue to run ahead of incomes, while households have larger debts (and are being enticed to buy in the current complex risk environment).

The top post codes in stress are those in the outer suburban fringe areas, where many large estates are still being built, and households are super-highly leveraged.

The RBA released their March 2019 data on household ratios. Whilst these series include small business finance, and include households not borrowing, the trends continue to tell the story of debt, and more debt.

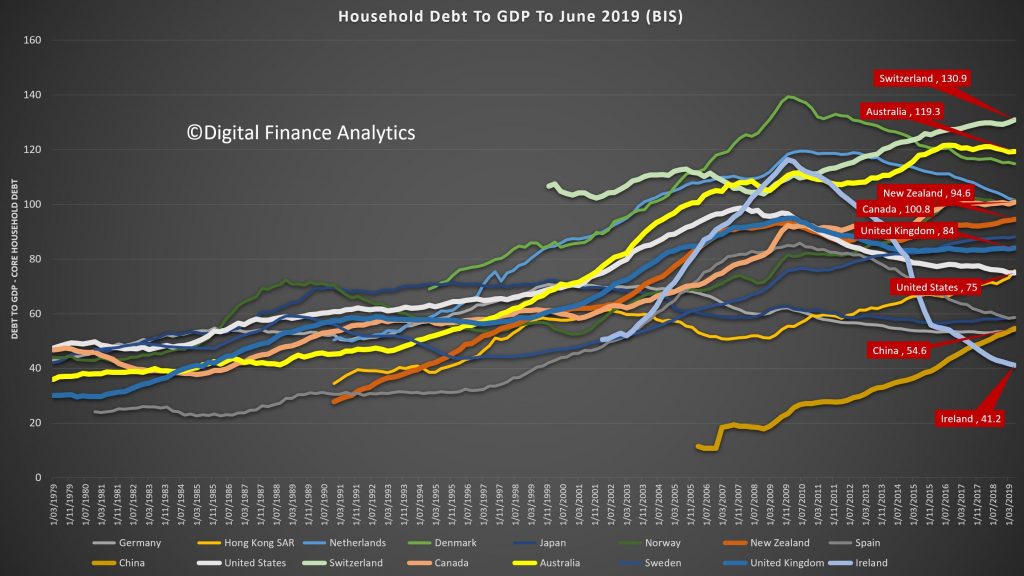
The household debt to income ratio is at a record 189.7, while the housing debt to income ratio was 140.1, again a record and the owner occupied housing debt to income ratio was also up, to 109.3. These are high numbers, on a trend and international comparable basis. Households are drowning in debt.

However the asset to income ratios tell another story. As home prices have fallen, so the ratio has decreased, assets are down relative to income. The exception are financial assets, which benefited from the rise in stock prices this year.

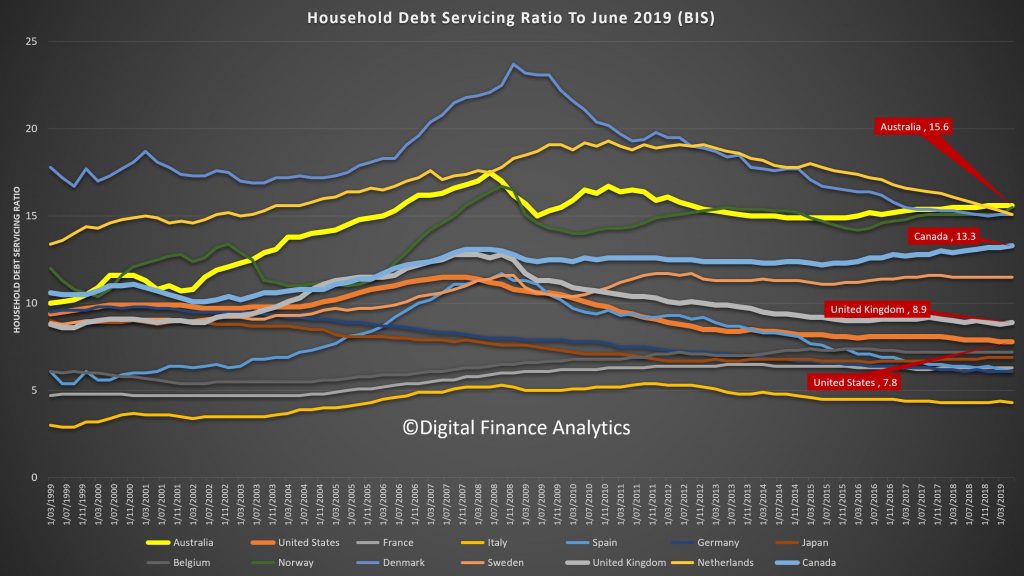
The ratio of interest to income continues to rise because households are borrowing at a faster rate than their incomes are growing, helped of course by lower interest rates. This ratio is below that before the GFC because rates have dropped. And this is the one ratio spruikers turn to to defend the high debt levels – but it is myopic, and going in the wrong direction.

Finally, the RBA data debt to assets shows the pincer movement as home prices fall, and debt rises. This is now heading towards the highest we have seen.

The obvious conclusion is that the debt burden is too great, mortgage stress will go on rising, until the balance between debt and income is restored.

The recent loosening of lending standards simply pours more fuel on the fire. Households are being used a canon fodder in the vein attempt to keep the faltering economy afloat.

Household Wealth Up (And Down)! [Podcast]

We look at the latest ABS stats on household wealth. How do falls in real estate values compare with recent lifts in share prices?

Digital Finance Analytics (DFA) Blog
Household Wealth Up (And Down)! [Podcast]
Loading
/