Please consider supporting our work via Patreon
Please share this post to help to spread the word about the state of things….

/
RSS Feed
Digital Finance Analytics (DFA) Blog
"Intelligent Insight"

We discuss the latest discussions about household debt.
Please consider supporting our work via Patreon
Please share this post to help to spread the word about the state of things….
Michael Pascoe has penned an article in the New Daily, which attempts to bring some balance to the discussion of the severity of household debt in Australia.
“there are no guarantees and household debt levels do indeed need watching, but it’s not as simple an Armageddon as the scaremongers would like you to think”.
Good on him, for not just following the herd on this one. Because the debt footprint is more complex than some would like to admit.
Averaging data tells us very little. For example the RBA chart showing 190 debt to income includes all households, including those without debt, so the ratio is higher for those with big debts.
 Second, you have to look at individual households and their finances. This is of course what our surveys do, alongside details of their overall assets, and net worth.
And yes, many are doing just fine (even if much of those assets are in inflated housing, or superannuation which is locked away).
But it is the marginal borrower who is under the gun now, even at rock bottom interest rates, and banking lending standards are a lot tighter so around 40% of households are having trouble getting a refinance. Plus we do have problems with some interest only loans, especially where the borrower is a serial leveraged investor with a significant number of properties.
Then of course there is the question of whether employment rates will rise or fall, and the quality of new jobs on offer. As a piece in The Conversation today shows:
many jobs are Job creation in the female-dominated health and education service sectors is driving both full-time and part-time employment growth in Australia.
And some of these will be less well paid.
Here is a plot for all households of TOTAL debt repayments as a ratio to income at the current time. This includes households with a mortgage, those who own property outright and those renting. Many have no debt.
For those borrowing, debt can include mortgages (both owner occupied and investor), personal loans, credit cards, and other consumer finance. This does not include business lending.
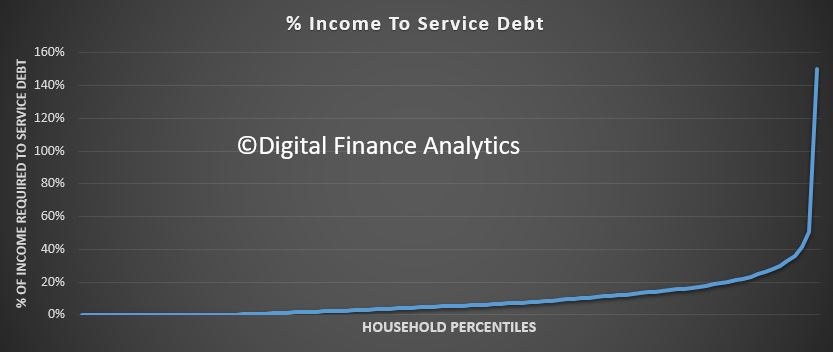 Many more have commitments which require less than 20% of household incomes (from all sources). But others have much higher debt servicing requirements, and a few are through the 100% barrier – meaning ALL income is going to repay debt. Not pretty. In some cases this is triggered by changes in personal circumstances.
If you boil it back to owner occupied mortgage borrowers, then our data suggests around 30% have little wiggle room at current levels. Even small rises would be concerning.
And at the end of the day it will be the marginal borrower who has the potential to trigger issues down the track – as happened in the USA post the GFC.
It is certainly not an all or nothing picture. Granularity is your friend.
Continuing our series on Financial Resilience, we look in detail at how mortgage stress sits across selected post codes in Queensland.
Back in January I decided to start more regular content creation for YouTube. Last week we passed 3,000 subscribers, and the number continues to grow. Thanks for your support. And judging by your comments, you appreciate the straightforward data driven approach. Our podcast subscriber base is also expanding nicely too.
 Since that time, we have built the arguments using data to highlight around the growing pressures from higher levels of debt, sliding home prices sliding and higher interest rates.
Now one question keeps recurring in the community discussion. I see the problem, but what should I do to protect myself in these uncertain times? This is an excellent question, and one I want to take further. Because the answer is, it depends.
It depends on where you believe the economy is headed. It depends whether you are seeking to protect the value of existing assets and savings, are seeking to exploit the uncertainty, or something else.
So in response, I am going to commence today the first in a series of posts which I have called Financial Resilience 101.
Resilience is defined as “the capacity to recover quickly from difficulties; toughness”.
And we start our journey with a quick recap based on some of the most relevant posts I have already created. If you missed them, now is a good time to catch up.
The first post “Four Potential Finance and Property Scenarios” discusses the range of potential outcomes over the next couple of years, because you will need to decide where to place your bets.
If you are holding to a mild correction and more of the same, you will adopt one set of strategies for resilience, whereas if you are at the other end of the spectrum and looking at global events similar to the GFC a decade ago you will go a different way. Thinking about scenarios is useful if not easy to do. We will update our scenarios again in a future post, but they generally still holding true.
The next post discussed whether now is a good time to buy property “Should I Buy”and here we explored the reasons to buy and not to buy.
Again it partly depends on your view, but also whether you are thinking of property as a place to live or an investment.
The other side of the coin is should I sell now, and we discussed this too in our post “Should I Sell Now?” and we look at the reasons why you might decide to sell, or not.
Again this varies depending on whether you are an owner occupier or a property investor.
Then we went on to explore options beyond property, accepting that things may get shaky. In our post “What Should I Do” we go through the options, from stocks, shares, bonds, commodities and crypto and draw some comparisons with the UK a decade ago via Northern Rock.
Now once you have gone through these sessions you will have a good set of foundations from which to build a Financial Resilience Strategy. Next time we will then go further into what to do next.
And a warning, this is not financial advice, as I cannot take account of individual circumstances, and am not qualified to give such advice. That said, there are some general principles which I think are useful, based on my own experience. And if you find these useful then that is a good outcome. But you will have to make your own decisions.
Two final points, first generally diversification is goodness, as it spreads the risks, and second there are no silver bullets, no simply answers. If there were, I would not be making these videos, I would be going after that solution! Neither Gold, nor Silver nor Crypto are without significant risks. You can easily jump from the frying pan into the fire. Things are decidedly tricky at the moment, so you need to do the work, and make your own choices. No silver (or other metal) bullets here!
We commence a series on how to build financial resilience in the context of the debt bomb.
We discuss our latest mortgage stress data in the context of the latest economic news.
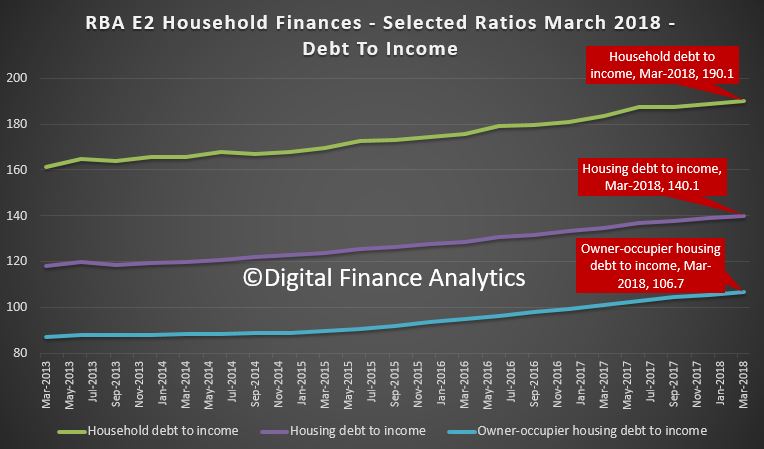
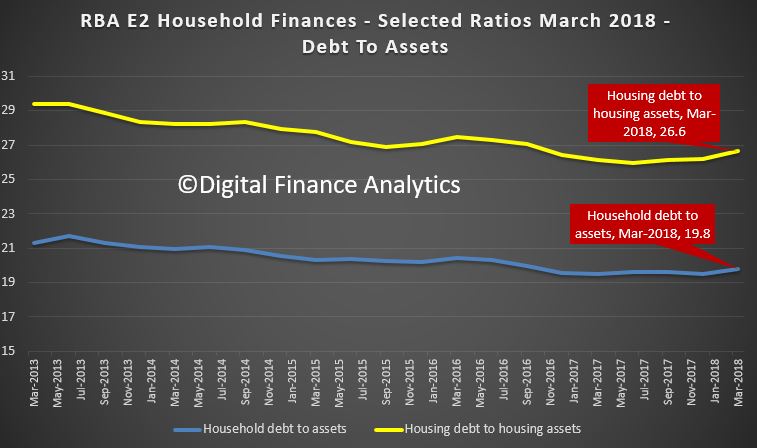
The RBA updated their E2 Household Finances – Selected Ratios to end March, released at the end of June. So they are yet to reflect the latest downturn in home prices and rising debt. But the trajectory is clear and should be ringing alarm bells.
First the ratio of household debt to housing assets and total assets is going up, reflecting mainly falls in property prices. The rate is accelerating, confirming that while debt is still rising, values are not. Expect more ahead.
 The ratios of assets to income are falling, having been rising for year, again reflecting falls in home prices. So while incomes are flat in real terms, asset values are falling faster.
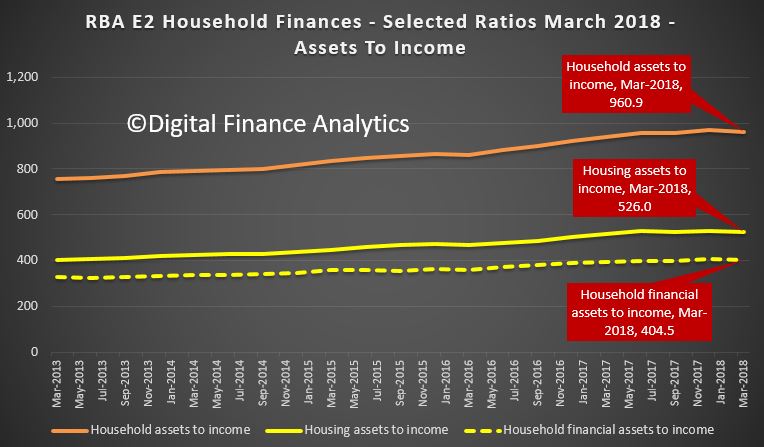 And finally, the killer, the household debt to income ratios continues higher, this despite the greater focus on lending quality, and reduced “mortgage power”. The household debt to income ratio is now at 190.1, the housing debt in income 140.1, and the owner occupied housing debt to income is 106.7. In fact this is moving up more sharply as lenders have focused on owner occupied lending.
Combined this shows the problems in the household sector. No surprise then that mortgage stress is going higher. We release the June data tomorrow.
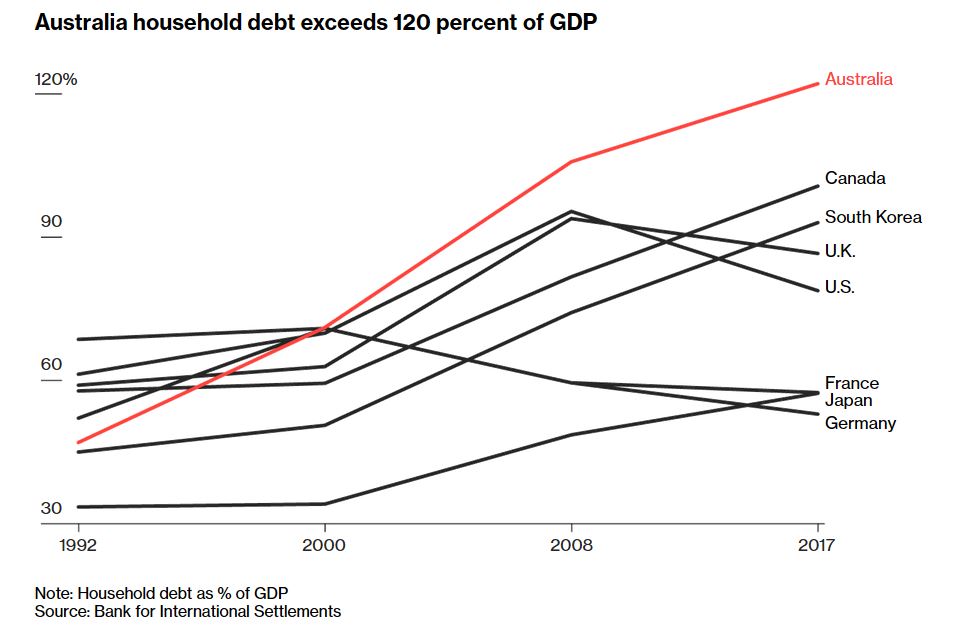
Remember that the debt to GDP ratio is highest in Australia compared with other countries.
The Australian Bureau of Statistics has just released its latest analysis of the effects of government benefits and taxes on household income. Overall, it shows government spending and taxes reduce income inequality by more than 40% in Australia. Disparities between the richest and poorest states are also greatly reduced.
 The ABS analysis provides the most up-to-date (to 2015-16) and comprehensive figures on the impacts of government spending and taxes on income distribution. As well as direct taxes and social security benefits, it estimates the impact of “social transfers in kind” – goods and services that the government provides free or subsidises. These include government spending on education, health, housing, welfare services, and electricity concessions and rebates.
The figures also include a wide range of indirect taxes. Among these are GST, stamp duties and excises on alcohol, tobacco, fuel and gambling.
The 2015-16 results are the seventh in a series published every five to six years since 1984. The methodology is based on similar studies by the UK Office of National Statistics since the 1960s. The latest UK analysis coincidentally also came out on Wednesday.
The ABS analyses income distribution in a number of stages.
First, it calculates the distribution of “private income”. This includes wages and salaries, self-employment, superannuation, interest, dividends and income from rental properties, among other items. It also includes net imputed rent from owner-occupied dwellings and subsidised private rentals.
Next the ABS adds social security benefits, such as the Age Pension, unemployment and family payments, to give “gross income”.
Then it deducts direct taxes – primarily income tax – to give “disposable income”.
The next stage is to add the estimated value households derive from government services. This is mainly the value of public health care and education spending.
The final stage is to deduct the estimated value of indirect taxes.
It is possible to calculate measures of economic inequality at different stages in this process. By implication, the difference between inequality measures is the result of the different government policies taken into account.
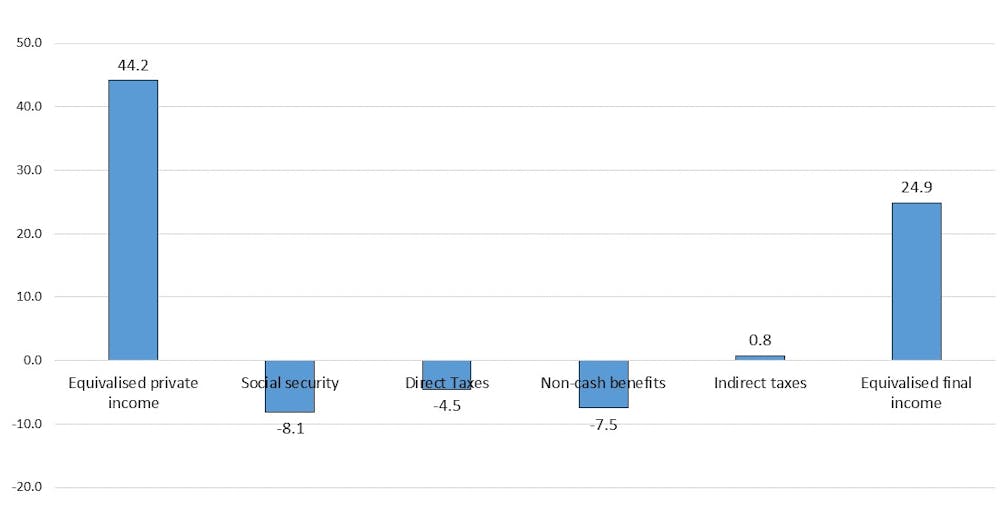
Figure 1 shows the Gini coefficient, which ranges between zero – where all households have exactly the same income – and 100% – where one household has all of the income. The Gini coefficient for private income in 2015-16 was 44.2. The addition of social security benefits, which mainly increase the incomes of low-income groups, reduces the coefficient by 8.1 percentage points.
Deducting income taxes – which are progressive – further reduces inequality by 4.5 points. Government non-cash benefits reduce the Gini coefficient by nearly as much as the social security system. However, indirect taxes slightly increase income inequality.
The Gini coefficient for final income is 24.9. So, compared to a coefficient of 44.2 for private income, government spending and taxes reduce overall income inequality by more than 40%.

Figure 1: Effects of government spending and taxes on income inequality, measured by Gini coefficient Australia 2015-16. Data source: ABS Government Benefits, Taxes and Household Income, Australia, 2015-16, Author provided
While most of the reduction in inequality is due to government spending, taxes are obviously important to pay for this spending.
The social security system reduces income inequality (and poverty) because Australia targets benefits to the poor more than in any other high-income country.
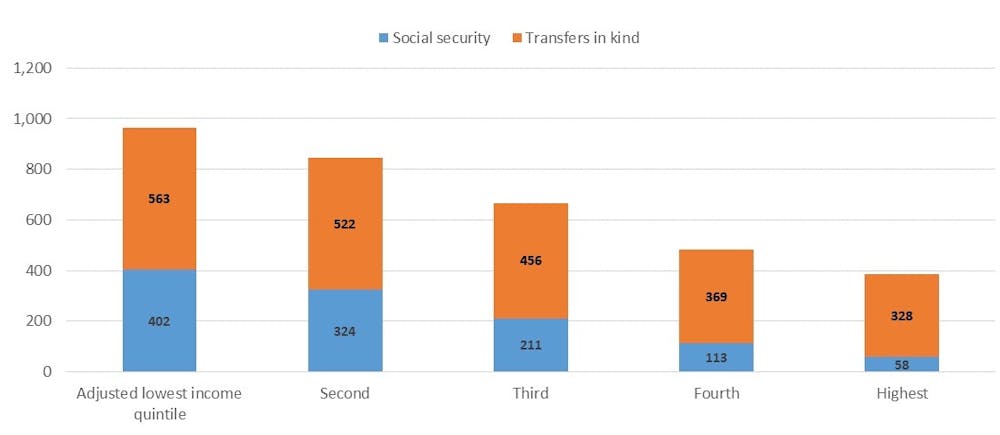
Figure 2 shows the distribution of social security benefits and government services across income groups, from the poorest 20% to the richest 20% of households. The poorest 20% receive about seven times as much in benefits as the richest 20%. The average for OECD countries is close to one, with rich and poor receiving about the same amount.

Figure 2: Distribution of social spending ($ per week) by equivalised disposable household income quintiles, Australia 2015-16. Data source: ABS Government Benefits, Taxes and Household Income, Australia, 2015-16, Author provided
Government spending on social services is also progressively distributed. This spending is considerably greater than social security spending and includes both Commonwealth and state spending on education and health.
The poorest 20% receive about 70% more in non-cash benefits than do the richest. This is not due to income-testing. Instead, it’s largely a result of the greater value of public health spending on hospitals and Medicare for older people, who tend to be in the bottom half of the income distribution.
Taxes, of course, work to reduce income inequality, as high-income groups pay a higher share than low-income groups. Figure 3 shows that the poorest 20% pay about 5% of their disposable income in direct taxes, while the richest 20% pay about 30% of their disposable income.
In contrast, indirect taxes – particularly those on tobacco and gambling – are regressive. Low-income groups pay more than high-income groups as a share of their disposable income. However, the undesirable effects of smoking and gambling on the wellbeing of low-income households need to be borne in mind.
When direct and indirect taxes are added together the overall tax system is less progressive, but the richest 20% still pay nearly twice as much of their disposable income as do the poorest 20%.
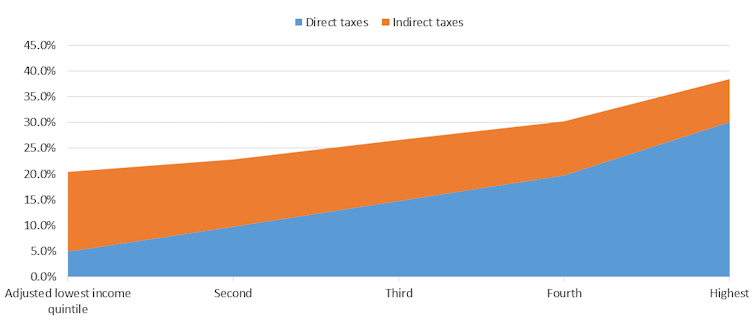
Figure 3: Distribution of direct and indirect taxes (% of disposable income) by equivalised disposable household income quintiles, Australia 2015-16. Data source: ABS Government Benefits, Taxes and Household Income, Australia, 2015-16, Author provided
In addition to reducing inequalities between income groups, government spending and taxes redistribute across age groups. Government spending is much higher for households of Age Pension age than for younger households. This is because of both the Age Pension and older households’ use of the healthcare system.
For example, households where the reference person is 75 or older receive on average just over $1,000 a week in government spending but pay about $180 a week in direct and indirect taxes. Households with a person aged 45 to 54 pay the highest taxes on average – about $800 per week – and on average receive about $620 a week in social spending.
There is also redistribution across states and territories. For example, average private income is about 65% higher in Western Australia than in Tasmania. However, on average, Western Australian households receive about two-thirds of the social security benefits that Tasmanian households get. This reduces the disparity in gross income to about 45%.
Western Australian households pay about twice as much in income taxes as Tasmanians, reducing the disparity to 35%. Households in the West receive only about 3% more in spending on social services than in Tasmania, which reduces the disparity in average incomes to 28%. West Australian households also pay about 20% more in indirect taxes than Tasmanian households (although as a percentage of disposable income, this is a higher share in Tasmania).
These figures suggest that while the financing of fairly equal social services across most parts of Australia reduces inequality between states, the income tax and social security systems also significantly reduce disparities. This is because income tax and social security are national systems and because Tasmania is the poorest state largely due to the higher share of age pensioners in its population.
Overall, this publication provides an invaluable picture of how government spending and taxes affect household economic well-being. Its results are relevant not only to the political debate about tax cuts, but also to long-term policy development to prepare Australia for an ageing population.
Author: Peter Whiteford, Professor, Crawford School of Public Policy, Australian National University
ASIC is warning consumers about companies that claim they can fix a poor credit rating. ASIC is running a month-long campaign, with other Commonwealth, state and territory agencies, to help consumers understand that by using credit repair and debt management firms they may end up paying high fees.

Consumers should be aware these companies often fail to fix credit and debt issues, which can leave people in a worse financial situation.
ASIC Deputy Chair, Peter Kell said consumers may not realise that free services exist to help them fix credit reports or resolve their debt problems, such as the National Debt Helpline.
‘Consumers experiencing money or debt problems don’t need to put themselves under further financial stress by paying high fees to firms providing credit repair and debt solution services’, Mr Kell said.
‘If people are having difficulty obtaining loans because of an incorrect default listing on their credit report, there are actions they can take that are free of charge to have it corrected.
‘If you think you have had a credit default wrongly listed against you, contact the creditor and ask for it to be removed. If you aren’t satisfied with the response you receive you can contact the relevant dispute resolution service for help’, added Mr Kell.
People experiencing debt problems can seek free help and guidance from financial counsellors and the National Debt Helpline on 1800 007 007 or go to ndh.org.au.
In 2016, an ASIC report[1] found debt management firms:
- were offering services where fees and costs were not well explained;
- often required payments be made before services were provided;
- sometimes used high-pressure sales techniques.
Mr Kell suggested consumers can consider alternative services like financial counselling before engaging a debt solutions firm.
Consumers should be aware that lenders will review their credit report when they apply for credit or a loan and they should check their credit history details are correct. Consumers are entitled to obtain one free copy of their credit report each year from a credit reporting agency.
For more information and guidance on credit repair, free financial counselling services, and managing debt, visit ASIC’s MoneySmart website.
Background
ASIC is the lead Australian Government agency for financial literacy, consistent with its strategic priority and statutory objective to promote confident and informed consumers and investors. ASIC’s financial capability program includes:
- leading the National Financial Literacy Strategy;
- providing consumer information via ASIC’s MoneySmart; and
- delivering ASIC’s MoneySmart Teaching program.
The National Financial Literacy Strategy, led and coordinated by ASIC, is a framework to guide policies, program and activities that aim to strengthen Australians’ financial capability.
In addition to ASIC, other agencies involved in the campaign include the Australian Competition & Consumer Commission (ACCC), Consumer Affairs Victoria, NSW Fair Trading and the Queensland Office of Fair Trading.
The Federal Court recently found, in proceedings brought by ASIC, that credit repair business Malouf Group Enterprises Pty Ltd and its director Jordan Francis Malouf breached the Australian Consumer Law by making false and misleading representations and engaging in unconscionable conduct. In addition to penalties imposed by the Court, the Malouf Group will pay $1.1 million to consumers (refer: 18-114MR).
Free financial services available to consumers
Financial Counselling
Financial counselling is a free service offered by community organisations, community legal centres and some government agencies. Financial counsellors can help consumers solve their money problems.
National Debt Helpline
The free hotline – 1800 007 007 – is open from 9:30am to 4.30pm, Monday to Friday (opening hours can differ in different states) to help consumers struggling with debt. Consumers can visit the National Debt Helpline website for information and resources.
The Department of Agriculture runs a Rural Financial Counselling Service to support primary producers, fishermen and small rural businesses that are suffering financial hardship, for further details call 1800 686 175.
ASIC’s MoneySmart website provides a financial counsellor online search tool to locate a financial counsellor near you.
External Dispute Resolution (EDR) services
A credit repair company may offer to contact an External Dispute Resolution (EDR) service to resolve a consumer case. The company could charge a fee, even though those services are free and are designed to be easy for people to use. Consumers can save time and money by contacting an Ombudsman directly, rather than going through a credit repair company.
Credit and financial services EDR schemes
Financial Ombudsman Service (FOS) – 1800 367 287
FOS handles complaints about banking, credit, loans and debt collection, life insurance, superannuation, financial planning, insurance broking, stockbroking, investments, managed funds, timeshares, general insurance, finance and mortgage broking. They do not deal with complaints about compulsory third party, private health, public liability and workers’ compensation insurance.
Credit and Investments Ombudsman (CIO) – 1800 138 422
CIO handles complaints about credit unions, building societies, non-bank lenders, mortgage and finance brokers, financial planners, lenders and debt collectors, credit licensees and credit representatives.
Other dispute resolution services
Energy, water and telecommunication ombudsman services provide free advice and conciliation services for consumers with complaints about providers in those industries.
The New Zealand Reserve Bank has issued their latest financial stability report. They say that New Zealand’s financial system remains sound. Household debt is firmly in the frame as the biggest potential risk!
The banking system holds sufficient capital and liquidity buffers, guided by our prudential regulatory requirements. These buffers reduce New Zealand banks’ exposure to adverse shocks.An ongoing driver of financial soundness is the conduct and culture of banks and insurance companies. These features are being jointly reviewed by the Financial Markets Authority and ourselves, and we will report our findings over coming months. The financial system vulnerabilities are much the same as we discussed in our previous Financial Stability Report.
Household mortgage debt remains high. However, financial risk has lessened with both lending and house price growth slowing in the last 12 months – in part due to our imposition of loan-to-value (LVR) ratio restrictions. This more subdued lending growth needs to be further sustained before we gain sufficient confidence to again ease the LVR restrictions.
However, the banks says the high level and concentration of household sector debt in New Zealand is the largest single vulnerability of the financial system. Some households are vulnerable to developments that reduce their debt servicing capacity, such as higher interest rates or a change in financial circumstances. Households with severe debt servicing problems could default on their loans, creating losses for lenders. If debt servicing problems were widespread, weaker consumption and investment could reduce incomes and contribute to an economic downturn. This could threaten financial stability by causing households and businesses to default, and by reducing the value of assets against which banks have lent, such as houses.
The high level and concentration of household sector debt in New Zealand is the largest single vulnerability of the financial system. Some households are vulnerable to developments that reduce their debt servicing capacity, such as higher interest rates or a change in financial circumstances. Households with severe debt servicing problems could default on their loans, creating losses for lenders. If debt servicing problems were widespread, weaker consumption and investment could reduce incomes and contribute to an economic downturn. This could threaten financial stability by causing households and businesses to default, and by reducing the value of assets against which banks have lent, such as houses.
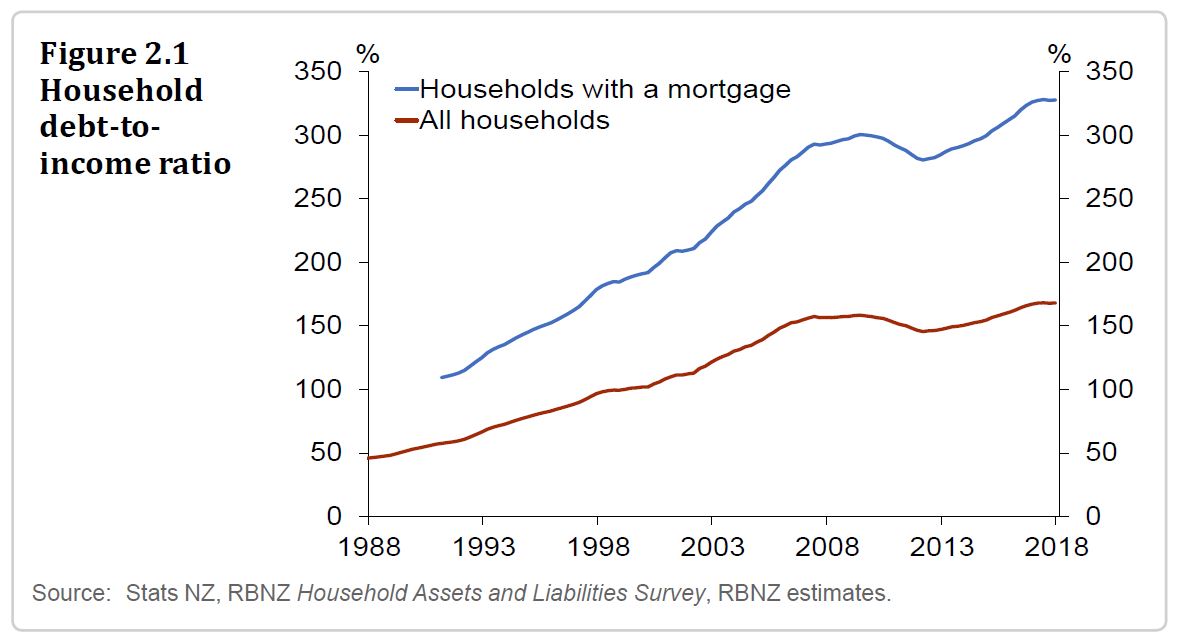
The rise in household debt since 2012 has coincided with a sharp rise in house prices, particularly in Auckland (figure 2.2). The simultaneous rise in household debt and house prices could partly reflect a self-reinforcing cycle, where bank lending has boosted house prices and, in turn, higher house prices have supported more bank lending, by increasing the value of homeowners’ collateral. But this cycle can also operate in reverse, driving down bank lending and house prices. This negative interaction can amplify the financial stability impact of a household income shock, by lowering collateral values and reducing households’ ability to service their existing debts by increasing their borrowing.
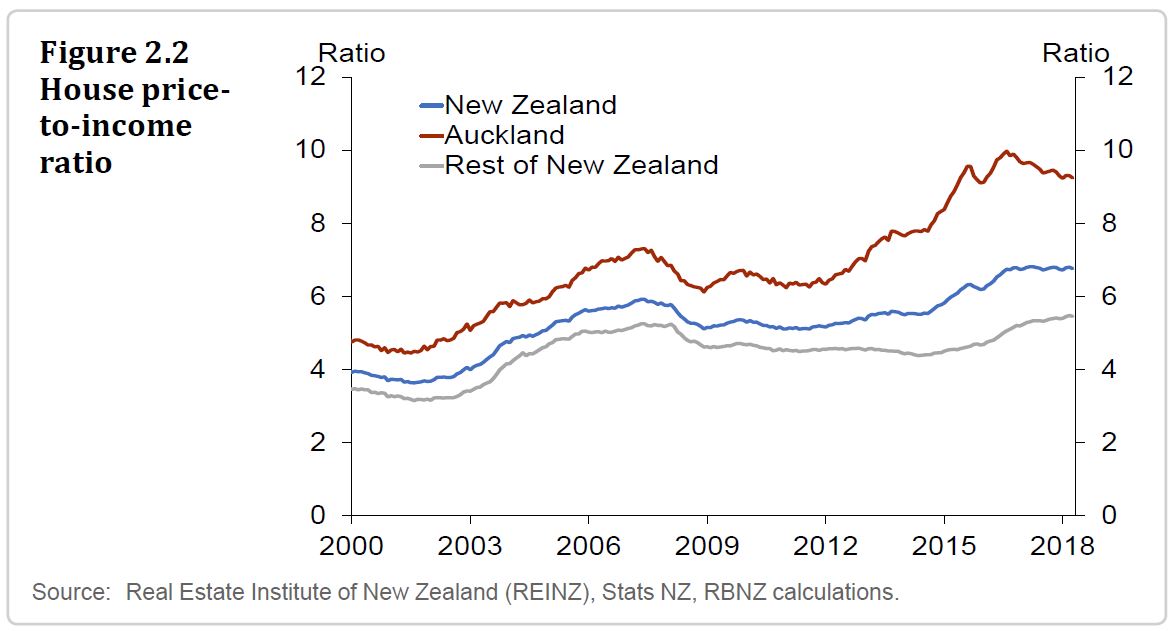
In the past two years, concerns about vulnerabilities in the household sector have caused a tightening in bank lending standards to the sector. This is partly the result of the Reserve Bank tightening its restrictions on new mortgage lending, particularly to investors, at high loan-tovalue ratios (LVRs) in October 2016.1 It also reflects actions by banks to tighten lending standards, such as the use of higher household living cost assumptions when assessing borrowers’ ability to service loans. As a result, a lower proportion of banks’ new mortgage loans have high risk characteristics than in 2016.
However, the share of new lending with high risk characteristics is still concerning. The proportion of new mortgage lending to borrowers with debt-to-income ratios above five is high compared to international peers, such as the UK. Households with this level of indebtedness are
particularly vulnerable to even modest changes in income or interest rates.The tightening in lending standards has contributed to the annual growth rate of household credit slowing to 6 percent, slightly above the rate of income growth (figure 2.4). This has coincided with a slowdown in national house price growth, to 4 percent in the year to April. The
decline in house price inflation partly reflects the announcement and implementation of government policies (such as KiwiBuild, the extension of the bright-line test and plans for ‘loss ring-fencing’). But low mortgage rates and high net migration continue to support house prices.
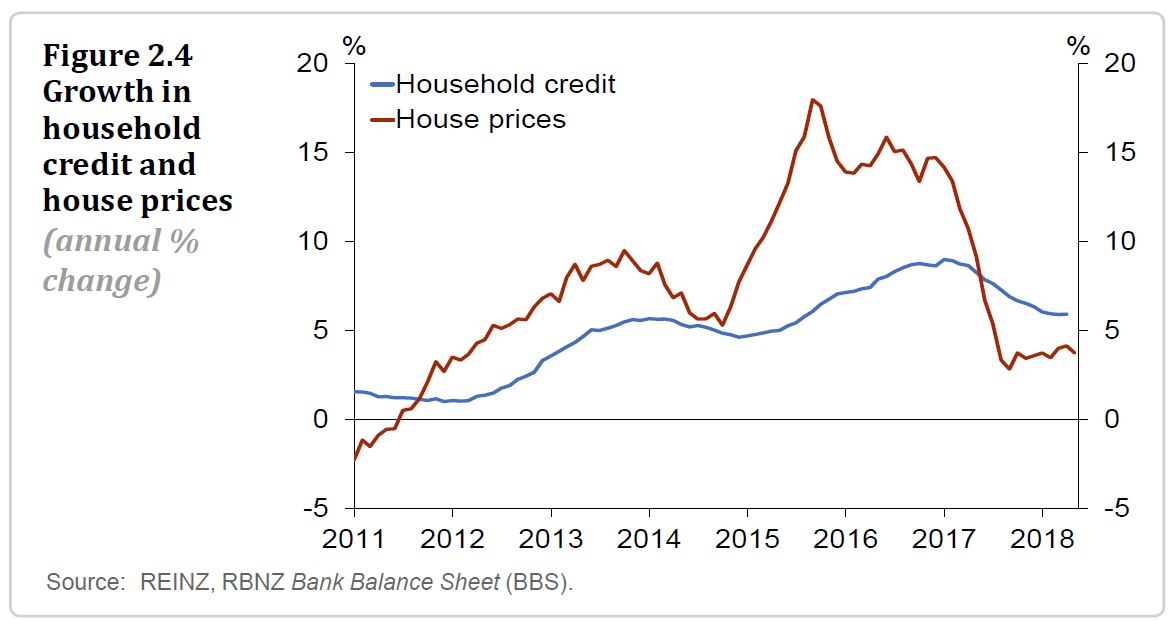
The growth rates of household debt and house prices have been fairly stable over the past six months. Combined with tighter bank lending standards, this suggests the financial system’s vulnerability to household debt has not changed materially since the previous Report.
Ultimately, continued stabilisation, or a further reduction, in the growth rates of household debt and house prices, will be required before the risk to the financial system is normalised. Bank lending standards will have an influence over both. Currently, banks expect to keep their lending standards relatively tight for the rest of 2018.
In a similar vein, the dairy farming sector remains highly indebted. Most dairy farms are currently cash-flow positive, but remain vulnerable to any possible downturn in dairy prices and agriculture shocks. Reducing this bank lending concentration risk requires more prudent lending practices.
The high dairy-farm indebtedness, and the fact that LVRs were necessary, reflects that banks’ allocative efficiency – eg deciding how much to lend to whom – can be impaired due to the pursuit of short-term, rather than longer-term, profits.
The report also commented on the Australia Economy:
The Australian economy is growing steadily. But vulnerabilities have risen in recent years, particularly in the household sector, which carries a relatively high level of debt. House prices also appear stretched in some cities. Regulators have responded in a number of ways, including by requiring banks to conduct more rigorous loan serviceability assessments. These changes, coupled with a broader improvement in lending standards and an easing in housing market conditions, have improved the outlook for risks in the Australian household sector. But the Australian financial system remains vulnerable to developments that could weaken households’ ability to service their debts.