Investment Home Lending Is Where It Is At

The data from the ABS of lending finance for May 2016 shows an overall fall of 0.8% in borrowing flow of all types, or $885 million, compared with the previous month. Within this, there was a relative rise in the proportion of new loans for investment housing (16.% of all lending flows), whilst the relative proportion of lending to business, net of investment housing, fell, to 53.8% of all lending in the month, down from a maximum of 61% of all flows in Match 2015.

Trend-Lending-Flows-May-2016This is not a good outcome when lending to business can translate to productive growth, whilst lending for investment housing continues to stoke up home prices and bank balance sheets. No surprise the banks are cutting mortgage rates to try and attract more business, but at the expense of business lending.

The total value of owner occupied housing commitments excluding alterations and additions fell 0.6% in trend terms to $20.5 billion. Investment lending volumes, which are included in the business volumes, were similar to the previous month, showing a relative swing towards investment loans at $11.6 billion.

The trend series for the value of total personal finance commitments rose 0.9%, or $65 million to $7.3 billion. Revolving credit commitments rose 1.8% and fixed lending commitments rose 0.3%. The seasonally adjusted series for the value of total personal finance commitments fell 4.6%. Revolving credit commitments fell 7.8% and fixed lending commitments fell 2.3%. Households are borrowing more on personal credit, including making up the difference on deposits for housing, as lending criteria get tighter.

The trend series for the value of total commercial finance commitments fell 1.2% to $28.4 billion, net of investment housing. Revolving credit commitments and Fixed lending commitments both fell 1.2%. The seasonally adjusted series for the value of total commercial finance commitments fell 4.1%. Fixed lending commitments fell 4.4% and revolving credit commitments fell 3.2%.

The trend series for the value of total lease finance commitments fell 3.9% in May 2016 and the seasonally adjusted series fell 14.2%, following a fall of 0.6% in April 2016 to $517 million.


Housing Lending Keeps The Ship Afloat

The final data from the ABS for March lending finance includes data on all the flows, including commercial. Trend finance for owner occupied housing flows fell 0.7% to $20.9 billion in the month, personal finance rose 0.5% to $6.9 billion and commercial finance fell 1% to $41.9 billion (which includes investment housing lending of $11.7 billion).

All-Lending-Mar-2016-FlowsLooking at the overall lending trends, we see on a 3 month rolling average, credit flows fell by 0.73% and have been falling since October 2015.

Data on commercial lending for the purchase of existing investment properties shows an uptick, based on the original data by selected states. After the slowing around the summer, it is now trending higher, especially in NSW  (before the cash rate cut).

Lenidng-By-State

We can also look at some of the other ratios which are important. First, total housing lending – including owner occupation and investment made up 46.7% of all lending flows. This is a record, and shows that the banks are reliant on housing lending to keep their ships afloat. The proportion of commercial lending not investment property related to all lending was 42.7%, and has been falling since October 2015.    The proportion of commercial lending which was for investment property related, to all commercial lending rose to 28.1%, the highest it has been for six months.

All-Lending-Mar-2016-Flows-Ratios So do not be fooled by talk of the home lending market stalling, it is not so. Even before the RBA’s cash rate cut at the start of May, housing lending of all flavours was significant, and demand will likely rise as  lower rates flow through, especially as the stock markets look shaky in May (sell in May and go away…?) and deposit interest rates are being killed.

Economically though, more home lending does not solve our economic growth problem.

Where Did The 10% Investor Mortgage Growth Speed Limit Come From?

An interesting FOI disclosure from the RBA tells us something about the discussions which went on within the regulators in 2014 and beyond, as they considered the impact of the rise in investor loans. Eventually of course APRA set a 10% speed limit, and we have see the growth in investment loans slow significantly and underwriting standards tightened.

Back then, they discussed the risks of investment lending rising, especially in Melbourne.

Macroeconomic: Extra speculative demand can amplify the property price cycle and increase the potential for prices to fall later. Such a fall would affect household spending and wealth. This effect is likely to be spread across a broader range of households than the investors that contributed to the heightened activity.

Concentration risk: Lending has been concentrated in Sydney and Melbourne, creating a concentrated exposure in these cities. The risk could come from a state-based economic shock, or if the speculative upswing in demand brings forth an increase in construction on a scale that leads to a future overhang of supply. In Sydney, the risk of oversupply appears limited because of the pick-up in construction follows a period of limited new supply and it has been spread geographically and by dwelling type. While the unemployment rate has picked up a little over the past 18 months, the overall economic environment in NSW is in a fairly good state. In Melbourne, there has been a greater geographic concentration of higher-density construction in inner-city areas. Some developments have a concentration of smaller-sized apartments that may only appeal to some renters, or purchasers in the secondary market. Economic conditions are not as favourable in Victoria and the unemployment rate is 6.8%.

Low interest rate environment: While a pick-up in risk appetite of households is to some extent an expected outcome given the low interest rate environment, their revealed preference is to direct investment into the housing market.  Historically low interest rates (combined with rising housing prices and strong price competition in the mortgage market) means that some households may attempt to take out loans that they would not be able to comfortably service in a higher interest rate environment. APRA’s draft Prudential Practice Guide (PPG) emphasises that ADIs should apply an interest rate add-on to the mortgage rate, in conjunction with an interest rate floor in assessing a borrower’s capacity to service the loan. In order to maintain the risk profile of borrowers when interest rates are declining, the size of the add-on needs to increase (or the floor needs to be sufficiently high).

Lending standards: In aggregate, banks’ lending standards have been holding fairly steady overall; lending in some loan segments has eased a little, while lending in some other segments has tightened up a bit. The main lending standard of concern is the share of interest-only lending, both to owner-occupiers and investors. For investors, 64% of banks’ new lending is interest-only loans and for owner-occupiers the share is 31%. The typical interest-only period is 5 years, but some banks allow the interest-only period to extend to 15 years. During this period, the loan is amortising more slowly than a loan that requires principal and interest (P&I) payments. If housing prices should fall, this increases the risk that the loan balance may exceed the property value (negative equity). There is some risk that the borrower could face difficulty servicing the higher P&I payments when the interest-only period ends, although this is typically mitigated by banks assessing interest-only borrowers on their ability to make P&I payments.

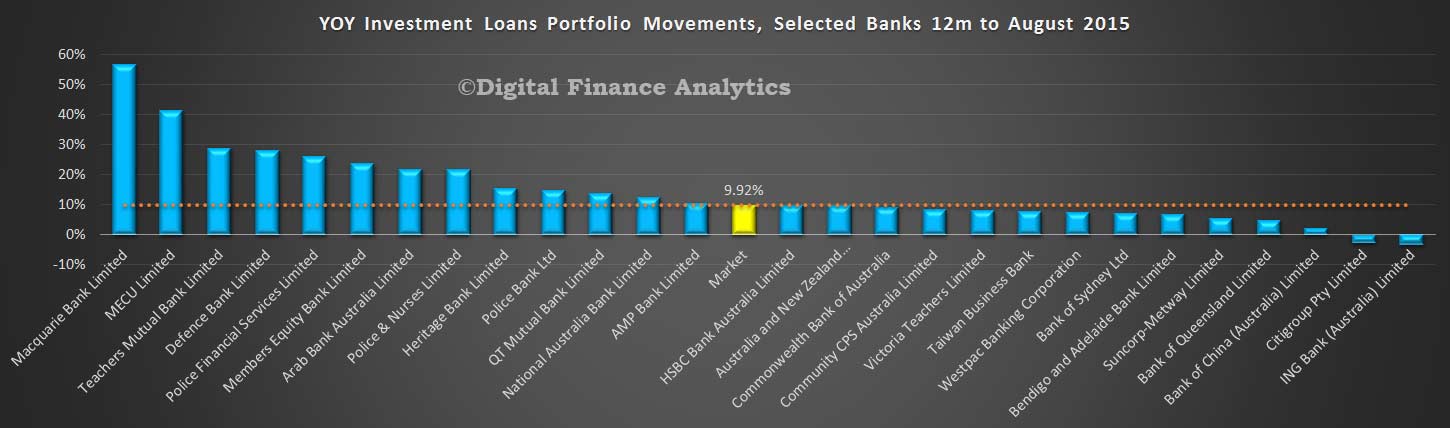
Of course the regulators found underwriting standards were more generous than they thought, at times in 2015 more than half of all new loans were investment loans, and recently banks have reclassified loans, causing the absolute proportion of investment loans to rise. Things were whose than they thought.

Next they discussed how to set the “right” growth rate:

How to calibrate the benchmark growth rate?  Household debt has been broadly stable as a share of income for about a decade. National aggregate ratios are not robust indicators of a sector’s resilience because the distribution of debt and income can change over time. But as a first pass, it is reasonable to expect that the current level of the indebtedness ratio is sustainable in a range of macroeconomic circumstances. Therefore there does not seem to be a case to set the benchmark growth rate significantly below the rate of growth of household income, in order to achieve a material decline in the indebtedness ratio. With growth in nominal household disposable income running at a little above 3 per cent, this sets a lower bound for possible benchmarks at around 3 per cent. Current growth in investor credit, at nearly 10 per cent, suggests an upper bound around 8 per cent to achieve
some comfort about the leverage in this market. Within this range, there are several options for the preferred benchmark rate for investor housing credit growth (including securitised credit).

a) Around 4½ per cent, based on projected household disposable income growth over calendar 2015. This could be justified as being consistent with stabilising the indebtedness ratio. However, it would be procyclical, in that it would be responding to a period of slow income growth by insisting that credit growth also slow. It would also be materially slower than the current rate of owner-occupier credit growth, which so far has not raised systemic concerns.

b) Around 6 per cent, based on a reasonable expectation of trend growth in disposable income, once the effects of the decline in the terms of trade have washed through. It is also broadly consistent with current growth in owner-occupier housing credit, which as noted above has not been seen as adding materially to systemic risk.

c) 7 per cent, consistent with the system profile for residential mortgage lending already agreed as part of the LCR/CLF process. Unless owner-occupier lending actually picks up from its current rate, however, the growth in investor housing credit implied by the CLF projections would be stronger than this. It is therefore not clear that these projections should be the basis for the preferred benchmark.

Staff projections suggest that only a moderate decline in system investor loan approvals would be required to meet a benchmark growth rate for investor housing credit in the 5–7 per cent range for calendar 2015. The exact size of the decline depends partly on assumptions about repayments through churn, refinancing and amortisation in the investor housing book. For a reasonable range of values for this implied repayment rate, and assuming that investor housing credit growth remains at its current rate for the remainder of 2014, the required decline in investor approvals is of the order of 10–20 per cent. This would take the level of investor housing loan approvals back to that seen a year ago. It is worth noting that investor loan approvals would have to increase noticeably from here to sustain the current growth rate of investor housing credit, even though the implied repayment rate is a little below its historical average. Since credit is not available at a state level, the benchmark can only be expressed as a national growth rate. The flow of loan approvals at a state level can be used as a cross-check to ensure that the benchmark incentive has had its greatest effects in the markets that have been strongest recently.

When the 10% cap (note this is higher than those bands discussed above) was announced, some Q&A’s provide some insights into their thinking.

Isn’t 10 per cent a bit soft?  We are not trying to kill the market stone dead. Investor housing credit is currently running at a bit under 10 per cent. Some lenders will have investor credit growth well below this benchmark anyway, so if all lenders do end up at least a little under this benchmark, which we hope they will, then aggregate growth in investor credit will be noticeably below 10 per cent. Setting a benchmark for individual institutions is not the same thing as setting it for an aggregate, and APRA has allowed for that.

Where did the 10 per cent benchmark come from?  This was a collective assessment by the Council agencies. We took the view that we did not want to clamp down on the market excessively. We also took the view that in the long run, household credit can expand sustainably at a rate something like the rate of trend nominal household income growth, maybe a bit more or less in shorter periods. Trend income growth is below 10 per cent, more like 6 per cent or thereabouts. But it was important to make an allowance for the fact that some lenders will undershoot the benchmark, so the aggregate result will likely be slower than that.

But isn’t household income growth likely to be below average in the next few years, because of the end of the mining boom?  Maybe, but we don’t want to be procyclical and clamp down on credit supply more when the economy growing below trend.

This of course confirms the regulators were wanting to use household debt as an economic growth engine (interesting, see the recent post “Why more-finance-is-the-wrong-medicine-for-our-growth-problem” )

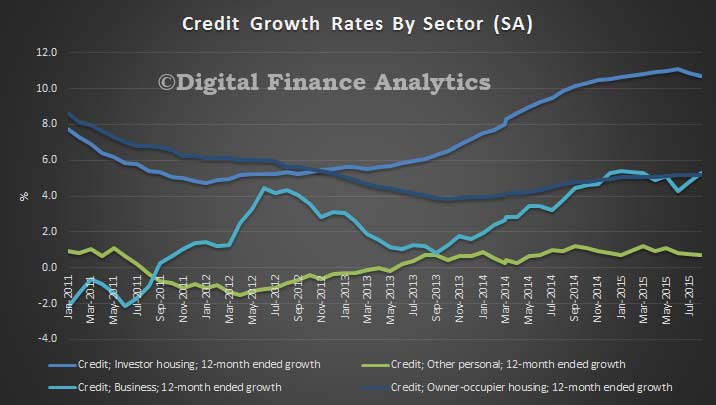
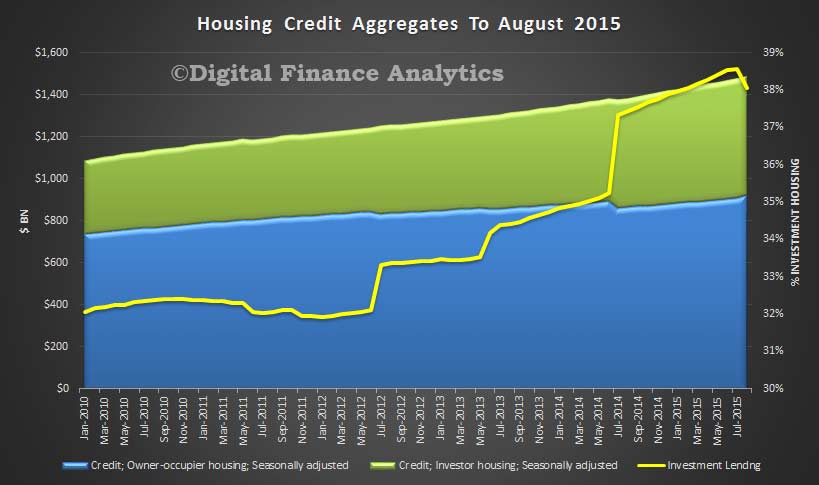
We also see a significant slow down in household income growth, yet credit growth, especially housing has been stronger, creating higher risks if interest rates or unemployment was to rise. Raises the question, were the regulators too slow to act, and did they calibrate their interventions correctly? We will see.
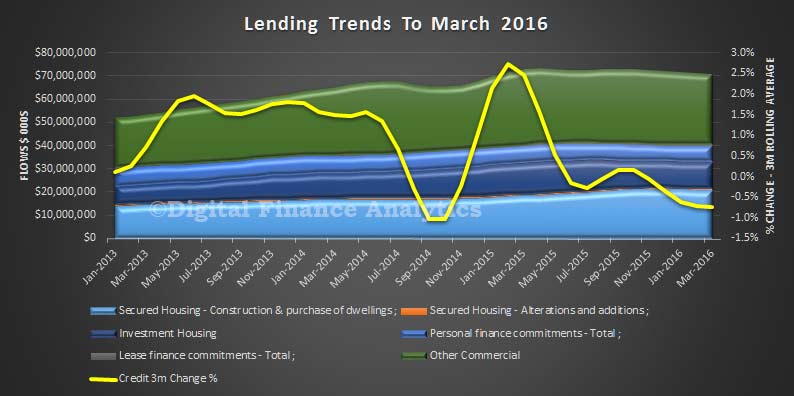
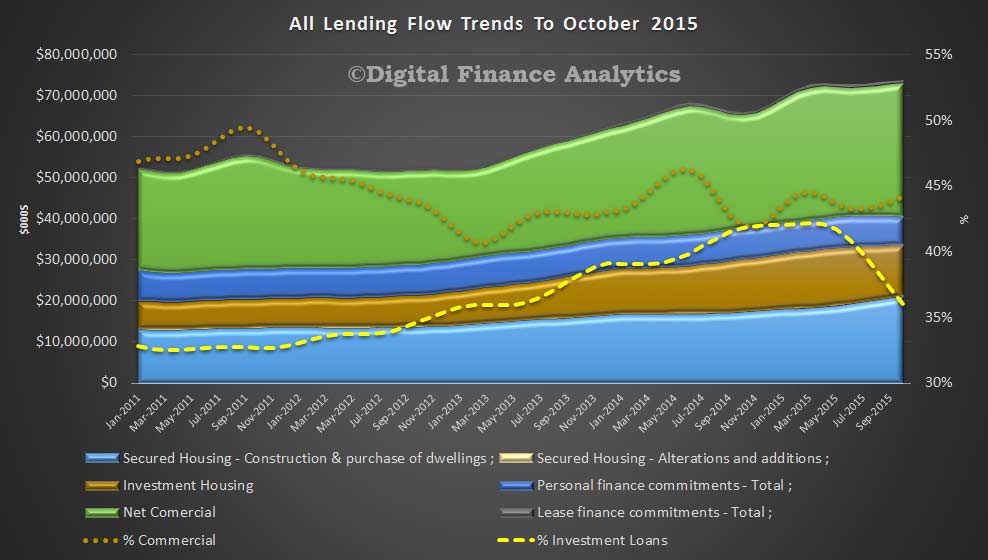
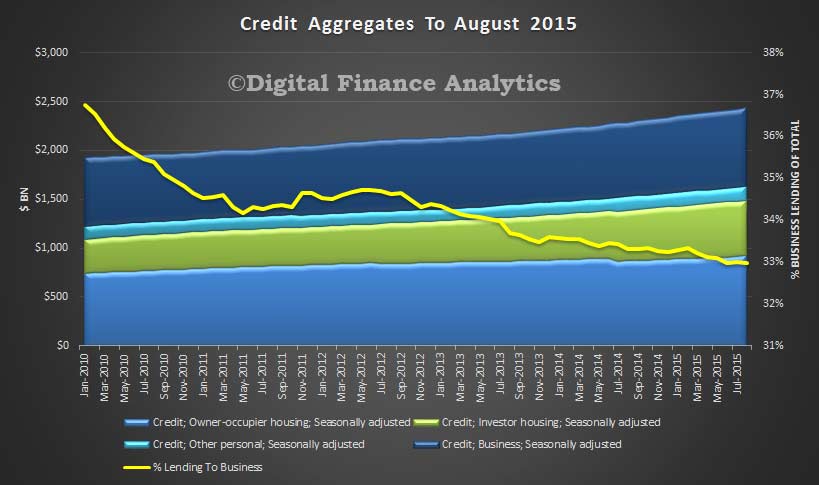
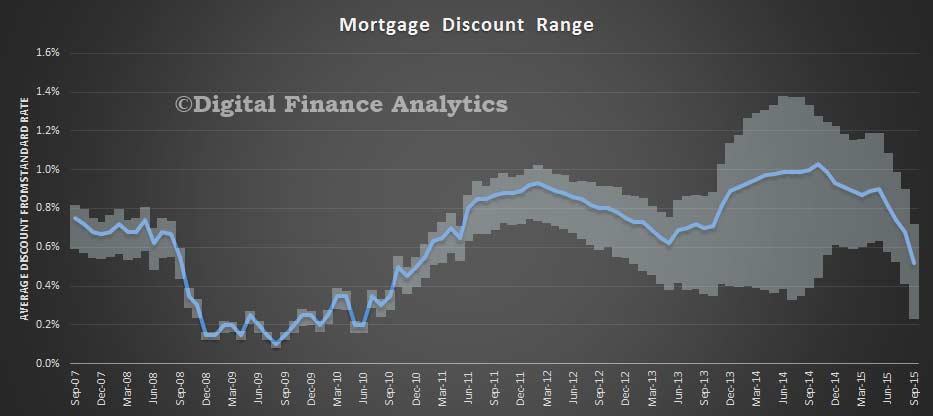
 

Lending Finance To Dec 2015 Shows Business Loans Up Ex. Investment Housing

The ABS data to December 2015 of total lending by category shows that the total flow value of owner occupied housing commitments excluding alterations and additions rose 1.3% in trend terms (to $21.9 bn), and the seasonally adjusted series rose 0.9%.

The trend series for the value of total personal finance commitments fell 0.7% (to $6.9 bn). Fixed lending commitments fell 1.0% and revolving credit commitments fell 0.3%. The seasonally adjusted series for the value of total personal finance commitments rose 2.1%. Fixed lending commitments rose 2.6% and revolving credit commitments rose 1.5%.

The trend series for the value of total commercial finance commitments fell 0.3% (to $44.1 bn). Revolving credit commitments rose 2.4%, while Fixed lending commitments fell 1.2%. The seasonally adjusted series for the value of total commercial finance commitments fell 7.3%. Revolving credit commitments fell 18.3% and fixed lending commitments fell 3.3%.

The trend series for the value of total lease finance commitments rose 0.1% in December 2015 (to $602m) and the seasonally adjusted series rose 1.7%, after a fall of 3.8% in November 2015.

All-Lending-Trends-Dec-2015Commercial finance includes lending to individuals and other for investment property purchase. We see that lending for investment property purchase slid to 15% of all lending in December, having reached a high of nearly 20% in late 2014. In addition, the proportion of commercial lending which related to investment property purchase fell to 25% of all commercial lending, having reached a peak of 31.4% in late 2014.

However, bearing in mind total commercial lending fell in the month, we see that owner occupied lending is now growing considerably faster (1.3%), compared with investment lending (down 2.4% and $11.4 bn) and commercial lending in aggregate is down 0.34%, but the non-investment housing segment rose 0.38% (to $32.7 bn).

If investment lending continues to slow, this will put more pressure on commercial lending growth, or create space for other lending to business, depending on your point of view. Or will the banks simply continue to chase owner occupied refinancing, the easy option? That said, lending to business ex. investment housing did grow, if but a little in the month. We need much stronger movement here to drive productive growth.

Lending Finance Shows NSW Investment Property Momentum Falling

The last piece of the finance data, from the ABS shows lending finance for October 2015. Two things of note (despite the noise in the data, as we have already discussed), first, investment housing lending is on the slide (down 3%), offset by a rise in owner occupied lending (up 2%), so overall lending for housing contained to rise a little. Second lending for business rose (up 1.3%). Investment loans were down to 36% of all housing, and lending for commercial (other than for property investment) rose from 43.8 to 44.2%.

All-Lending-Oct-2015Data for NSW, which is original data (no adjustments for trend or seasonality), showed a 5% rise in construction finance for investors, offset by a 33% fall in investment for existing property.  From this, it looks like the investment property party may just be over.

Oct-2015--NSW-Inv

Many Eastern States Investment Properties Are Underwater

We have had the opportunity to do a deep dive on investment property loans, using data from our household surveys. We have looked at gross rental returns, net rental returns (after the costs of mortgage servicing are included) and net equity held (current property value minus mortgage outstanding). The results are in, and they make fascinating reading, especially in the context of up to 40% of all residential property loans being for investment purposes, according to the RBA. Whilst we will not be sharing the full results here, one chart tells the story quite well.

We show the average gross rental yield on houses by state, (the blue bar), net rental yields before tax (the orange bar) and the net gross average capital gain (the yellow line). Gross yield is annualised rental over current value, assuming full occupancy;  net rental is annual rental less annual mortgage repayments; and capital value is the current marked to market price less current outstanding mortgage. The first two are shown as a percentage, the last as a dollar value. The chart below only covers houses, we have separate data on other property types but won’t show that here.

Rental-SnapshotWe found that investment property which were houses in VIC were on average losing money at the net rental level (and this is before any maintenance or other costs on the property). Those in NSW were a little better, but still in negative territory. The other states were in positive ground – some only just – and of course this is at current interest rates, before the latest uplifts were applied by the banks. We accept that the pre-tax position does not tell the full story, but as a stand-alone investment, many property investors are from a cash flow perspective underwater. Indeed, they are banking on prospective capital gains, and at the moment, they do have a cushion, but if prices were to slip, many would find this eroded quickly.

Our take is that the property investment sector contains considerable risks for banks, and investors, and these are not well understood at the moment. The more detailed analysis we did also showed that some specific customer segments, regions and postcodes were more at risk. Running scenarios on small interest rate rises shows that things get worse very quickly, especially for higher LVR loans.

We concur with analysis from Ireland and New Zealand, that the risks in the investment loan portfolios, despite the apparent historic low rates of default, are higher, and under Basel IV we expect investment loans to carry a higher capital rating, meaning that interest rates on investment loans are likely to rise more in the future, relative the the cash rate.


A Deeper Look at Recent Auckland Housing Market Trends: RBNZ

The Reserve Bank of New Zealand has published an analytic note “A Deeper Look at At Recent Housing Market Trends; Insights from Unit Record Data. It highlights the influence of investors and their impact on the overall market and the impact of LVR controls.

In October 2013 the Reserve Bank placed a temporary ‘speed limit’ on high loan-to-value ratio (LVR) residential mortgage lending, restricting banks’ new lending at LVRs over 80 percent to no more than 10 percent of total residential mortgage lending. This policy was implemented to reduce financial stability risks associated with the housing market, against the backdrop of elevated household debt, high and rapidly rising house prices, and a large share of new lending going to borrowers with low deposits. The policy had an immediate dampening effect on housing market activity and house price inflation, and facilitated a strengthening in bank balance sheets. However, since late 2014, upward pressure on the housing market has re-emerged, predominantly in Auckland, posing renewed risks to financial stability.

With the housing market showing renewed signs of strength, this paper provides a detailed overview of market conditions and examines developments following the imposition of the speed limit on high-LVR lending. We find that increased housing market activity in recent months has been driven by strong investor demand, both within and outside of Auckland, as reflected in increased investor purchases and significant growth in investor-related mortgage credit. Much of the increase in investor purchase shares has coincided with a fall in the share of movers, with the first home buyer share increasing slightly following its decline after the introduction of LVR speed limits.

We also investigate whether the LVR policy has led to an increase in cash buying activity or borrowing from institutions outside of the regulatory. We do not find evidence of the former with cash buyer shares falling in Auckland and remaining broadly flat in the rest of the country. There is some evidence of a modest increase in the share of transactions involving non-banks since October 2013, although non-bank activity remains low.

We then undertake a more detailed analysis of investor activity given their heightened prevalence in the market. The primary driver of their increased market share has been a rising incidence of small investors (that are heavily reliant on credit) in the market, as opposed to greater activity among larger investors. This suggests that the incoming changes to the LVR restrictions could have a significant dampening effect on Auckland housing market activity and house price inflation. We also find that investors are disproportionately represented at both ends of the price spectrum, contrary to popular opinion that investors predominantly buy relatively cheap properties for use as rentals.

Finally, we offer some additional insights into cash buyers, with the evidence pointing towards increased investor leverage relative to other market participants, consistent with the strong growth in investor-related mortgage commitments in recent months.

What Does The Latest Credit Data Really Tell Us?

Today we got the RBA Credit Aggregates and APRA Monthly Banking Statistics to August 2015.  Whilst the overall trends may superficially appear clear, actually, they are are clouded in uncertainty, thanks to significant reclassification between owner occupied and investment loans. As a result, any statement about “investment loans slowing” may be misleading. Total housing lending rose 0.63% seasonally adjusted to a new record of $1.49 trillion, of which $1.38 trillion sits with the banks, the rest is from the non-bank sector.

Starting with the RBA data (table D1),  overall housing growth for the month was 0.6%, and 7.5% for the 12 months (both seasonally adjusted). Owner occupied lending grew by 0.6% in the month, and 5.6% for the 12 months, whilst investment lending grew 0.7% for the month, and 10.7% for the year – still above the APRA speed limit. The chart below show the 12 month movements. It also shows business lending at 0.5% in the month, and 5.3% in the 12 months, and personal credit 0.1% in the month and 0.7% in the 12 months. It is fair to say from these aggregates that investment lending fell a little, and we think it is likely to continue to fall as lending criteria are tightened, but there is still momentum, and as we showed in our surveys demand, though tempered by tighter lending criteria.

RBA-Aggregates-Credit-Growth-PC-August-2015However, and this is where it starts to get confusing, the RBA says “Growth rates for owner-occupier and investor housing credit reported in RBA Statistical Table D1 have been adjusted to take into account the fact that the purpose of a large number of loans was reported to have changed in August, mainly from investment to owner-occupation. Similar adjustments are likely to be required in coming months. However, the stocks of owner-occupier and investor housing credit reported in RBA Statistical Table D2 have not been adjusted. The total stock of housing credit and its rate of growth are unaffected by this change.”

So, the data in D2 shows a significant fall in the stock of investment loans, and because of the adjustments not being made to these numbers (RBA please explain why you are using two different basis for the data) we need to be careful. On these numbers, owner occupied loans rise 1.5% in the month and investment lending fell 0.7%. The 12 month movements would be for owner occupied loans 6% and investment loans 8.3%.

RBA-Housing-Credit-Aggregates-Aug-2015What we can see is that the proportion of lending to business is still at a very low 33%, and this highlights that the banks are still focusing on home lending, with an intense competitive focus on the owner occupied refinance sector, and much work behind the scenes to push as much lending into the owner occupied bucket as possible. Remember that some banks had previously identified loans which should have been in the investment category, so more than 3% of loans were switched, lifting the proportion of investment loans above 38%.

RBA-Credit-Aggregates-Aug-2015The APRA credit aggregates which focus on the ADI’s shows that the stock of home loans was $1.378 trillion, up from $1.367 trillion in July, or 0.8%. Within that, investment loans fell from $539.5 bn to $535.5 bn, down 0.7%, whilst owner occupied loans rose from $827 bn to $843 bn, up 1.9%, thanks to the ongoing reclassification.  Looking at the movements by banks, the average market movement for investment loans over 12 months (and using the APRA monthly movements as a baseline) was 9.92%, just below the speed limit, and we see some of the major banks below the speed limit now, whilst other lenders remain above. These numbers have become so volatile however, that the regulators really do not know what the true score is, and the banks have proved their ability to recast their data in a more favorable light.

APRA-Investment-Loans-By-Lender-August-2015It is unlikely the “fog of war” will abate any time soon, so we caution that the numbers being generated by the regulators need to be handled carefully.

We will be looking at the individual portfolio movements as reported by APRA in a later post. We like a challenge!

Latest DFA Report – The Property Imperative 5 – Just Released

The Property Imperative, Fifth Edition, published September 2015 is available free on request.

This report explores some of the factors in play in the Australian residential property market by looking at the activities of different household groups using our recent primary research, customer segmentation and other available data. It contains:

  • results from the DFA Household Survey to September 2015
  • a focus on underwriting standards and mortgage pricing
  • an update of the DFA Household Finance Confidence Index
  • a discussion of the impact of high house prices

Property-Imperative-5You can obtain a copy of the report, delivered via email here.

From the Introduction.

The Property Imperative is published twice each year, drawing data from our ongoing consumer surveys, research and blog. This edition dates from September 2015 and offers our latest perspectives on the ever-changing residential property sector.

We begin by describing the current state of the market by looking at the activities of different household groups using our recent primary research and other available data.

In this edition, we also look at current mortgage pricing dynamics and underwriting standards; update our household finance confidence index and discuss the impact of chronically high house prices over the longer term.

Residential property is in the cross-hairs of many players who wish to influence the economic, fiscal and social outcomes of Australia.

By way of context, the Australian residential property market of 9.53 million dwellings is currently valued at over $5.76 trillion and includes houses, semi-detached dwellings, townhouses, terrace houses, flats, units and apartments. In the past 10 years the total value has more than doubled. It is one of the most significant elements driving the economy, and as a result it is influenced by state and federal policy makers, the Reserve Bank (RBA), banking competition and regulation and other factors. Indeed the RBA is “banking” on property as a critical element in the current economic transition.

According to the RBA, as at July 2015, total housing loans were a record $1.48 trillion . There are more than 5.4 million housing loans outstanding with an average balance of about $243,000 . Approximately 61% of total loan stock is for owner occupied housing, while a record 39% is for investment purposes. Last month, more than half of new loans written were for investment purposes.

The relative proportion of investment loans leaped by nearly 2.5% to 38.9% thanks to a significant reclassification of loans by some lenders.

In addition, 39.7% of new loans issued were interest-only loans.

The RBA continues to highlight their concerns about potential excesses in the housing market . In addition Australian Prudential Regulation Authority (APRA) has been tightening regulation of the banks, in terms of supervision of lending standards, the imposition of speed limits on investment lending and has raised capital requirements for some banks . The latest RBA minutes indicates their view is these regulatory changes are slowing investment lending somewhat , though we observe that demand remains strong, and in absolute terms, borrowing rates are low.

The story of residential property is far from over!

Table of Contents:
1 Introduction 3
2 The Property Imperative – Winners and Losers 4
2.1 An Overview Of The Australian Residential Property Market 4
2.2 Home Price Trends 4
2.3 The Lending Environment 6
2.4 Bank Portfolio Analysis 9
2.5 Market Aggregate Demand 10
3 Segmentation Analysis 16
3.1 Want-to-Buys 16
3.2 First Timers 16
3.3 Refinancers 19
3.4 Holders 19
3.5 Up-Traders 20
3.6 Down-Traders 20
3.7 Solo Investors 21
3.8 Portfolio Investors 21
3.9 Super Investment Property 21
4 Special Feature – Current Mortgage Pricing Dynamics 24
4.1 Regulatory Context 24
4.2 Bank Reaction 25
4.3 Portfolio Implications 28
5 The DFA Household Finance Confidence Index 30
6 Who Benefits From High House Prices? 33
7 About DFA 35
8 Copyright and Terms of Use 36

Mortgage Discounts Crash

Latest data from the DFA surveys which is going into the forthcoming edition of the Property Imperative, shows that the era of very large mortgage discounts is passing. The average discount has now fallen from above 100 basis points to around 60 basis points and it will continue to fall further. This means a windfall for lenders who can pocket the extra margin, or use it to attract owner occupied new business.

Sept-Discount-TrackerThe range of discounts between the upper and lower bounds is reducing, with the lowest bounds around 20 basis points.

Sept-Discount-RangeThe most insightful data is the split by loan type. Loans for investment loans (both new and refinanced) are much reduced, with the average a little above 20 basis points – some lenders offer no discount at all now. On the other hand, owner occupied borrowers with new or refinanced loans can obtain a larger cut in rates. This reflects the new competitive landscape, where lenders are seeking to swing business away from the investment sector to owner occupied lending.

Sept-Discount-Loan-TypeYou can read our earlier analysis on discounts here.