Lending Finance Tops Out?

The ABS data today provides an insight into the various categories of Finance to February 2015. The total value of owner occupied housing commitments excluding alterations and additions rose 1.0% in trend terms, whilst the value of total personal finance commitments fell 0.1%. The value of total personal finance commitments fell 0.2%. The trend series for the value of total commercial finance commitments rose 2.9%. Revolving credit commitments rose 4.8% and fixed lending commitments rose 2.1%. So, we see a rise in commercial lending (which of course includes investment property lending.) The rate of momentum in housing lending on the other hand appears to be slowing somewhat.

LendingFinanceFeb2015Looking at the relative share of investment property lending, we see it has turned down from a peak of 30.3% of all commercial lending to just of 29%, but still high compared with 2011. Banks are still preferring to lend for housing, though we are seeing a rise in commercial lending which is not property aligned – this is to be welcomed, and we need to see more, as productive lending to business will translated into real economic growth, whilst lending for property purchase inflates house prices, bank balance sheets, and household net wealth in book value terms.

COmmercialFinanceandPropertyFeb2015Turning to housing lending, values still rising and a total of $31 billion was lent for property across all categories in the month. This is a record.

HousingFinanceFeb2015Looking at the mix, 38% was for investment housing, 30% for owner occupation, and 20% for refinance.

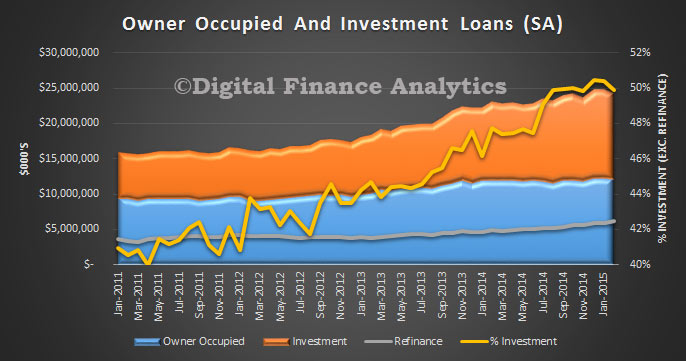
LendingMixFeb2015We see that just of 50% of secured loans (excluding refinance) were for investment purposes. Refinance was high, in response to the RBA rate cut in February.

HousingLendingFinanceFeb2015Looking at the percentage movements, month on month, we see the rate of growth slowing across the board, with investment lending slowing the most. This could well indicate a potential turning point in the months ahead, despite strong demand for investment property in the system.

HousingFinancePCMovementsFeb2015

Is The Housing Finance Worm Turning?

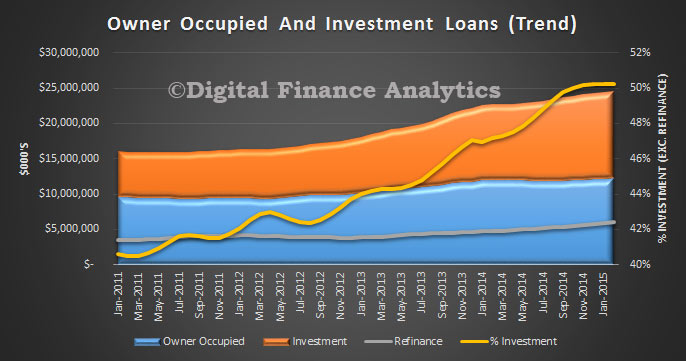
The ABS Housing Finance data for February 2015 was released today. The trend estimate for the total value of dwelling finance commitments excluding alterations and additions rose 0.8%. Owner occupied housing commitments rose 1.0% and investment housing commitments rose 0.4%. This is the first time growth in owner occupied loans has exceeded investment loans for many months. As a result the proportion of investment loans dropped below 50% for the first time this year. The cut in RBA rates also stimulated demand for the refinance of existing loans. We also see the bulk of investors purchased established dwellings, not newly constructed property.

OOandINVSAFeb2015The trend data (which irons out monthly changes) held investment loans over 50%, but also registered a slight drop.

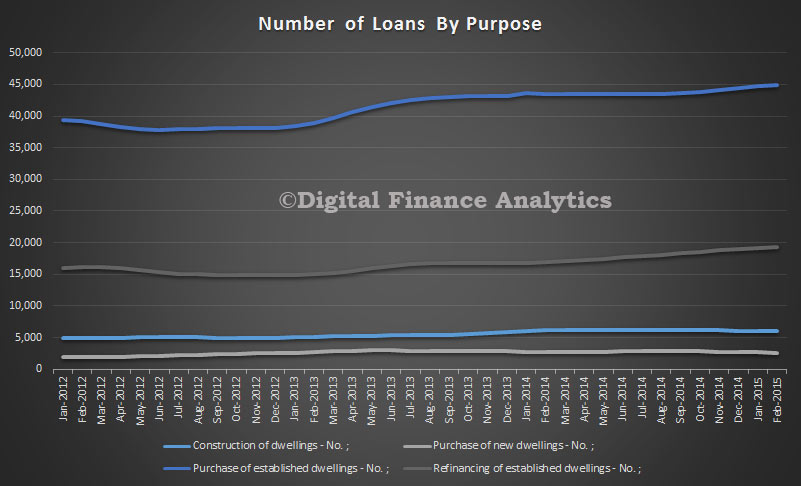
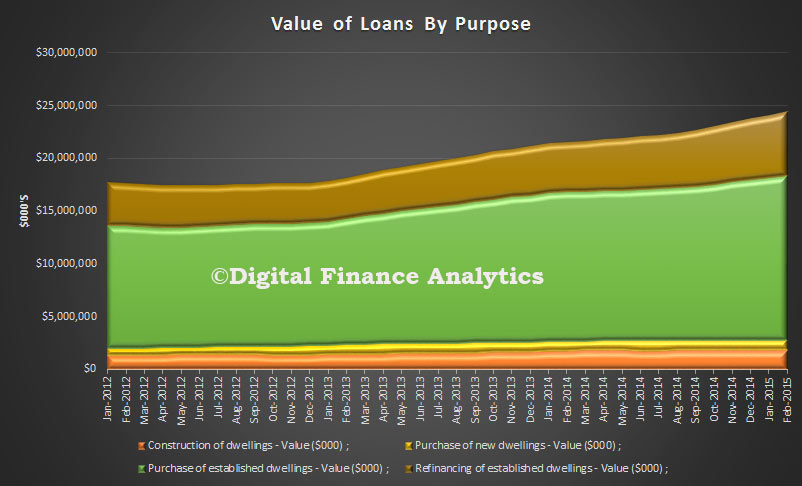
OOandINVTrendsFeb2015In trend terms, the number of commitments for owner occupied housing finance rose 0.2% in February 2015.  In trend terms, the number of commitments for the purchase of established dwellings rose 0.5%, while the number of commitments for the purchase of new dwellings fell 1.4% and the number of commitments for the construction of dwellings fell 1.1%. The number of loans to owner occupiers buying established homes, excluding refinancing, fell by 0.9 per cent.NumberofLoansByPurposeFeb2105The overall value of loans made in the month was a record $18 billion, excluding refinancing of existing loans. New construction was up about 2%.

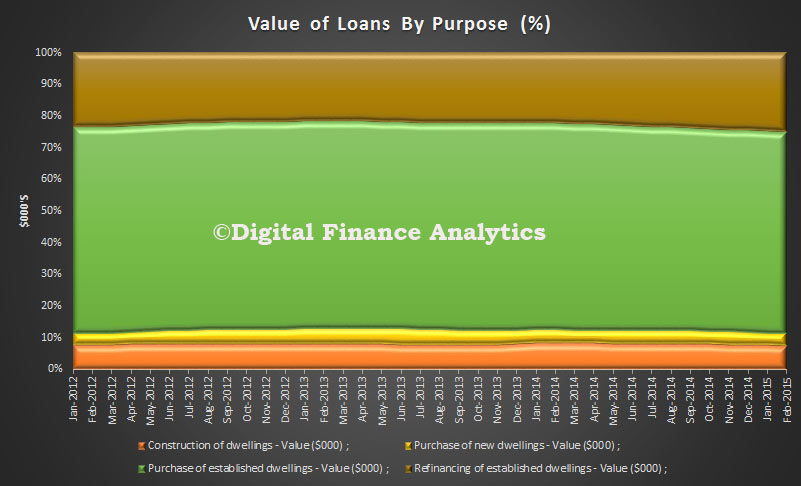
ValueofLoansByPurposeFeb2015In percentage terms, refinance of loans increased slightly, relative to new loans.

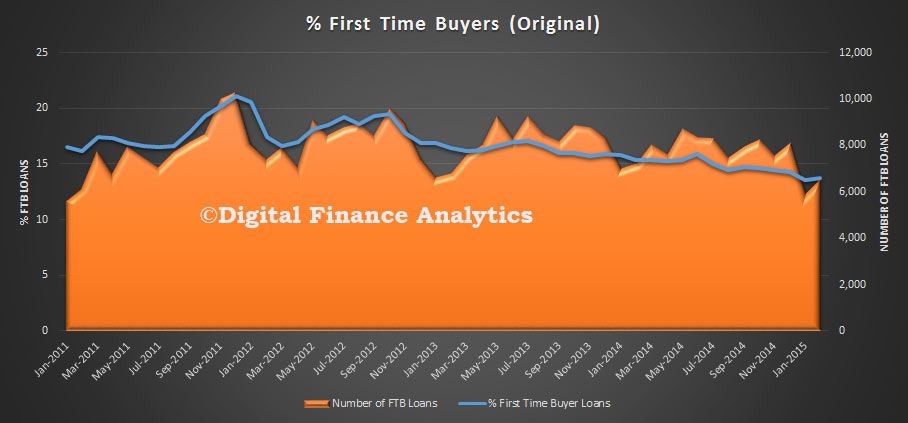
ValueofLoansByPurposePCFeb2015 In original terms, the number of first home buyer commitments as a percentage of total owner occupied housing finance commitments rose to 13.7% in February 2015 from 13.6% in January 2015.

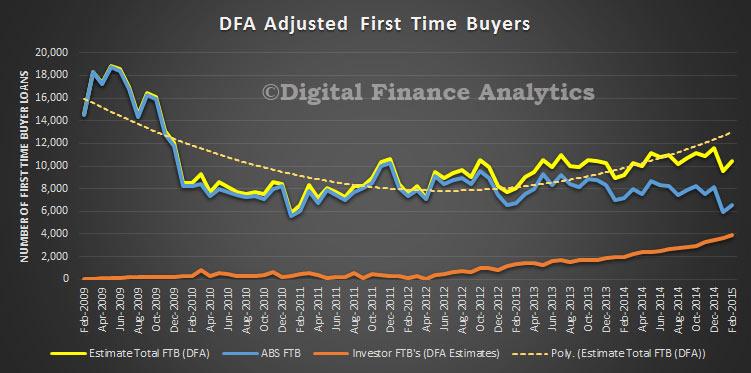
FirstTimeBUyersFeb2015If we overlay the DFA modelling of first time investor loans, overall first time buyer activity was up. Remember, also the data refers to loans, not property transfers, and we know form our surveys that additional purchases were made without the need for a mortgage by overseas investors, and local purchases cashed up thanks to the Bank of Mum and Dad.

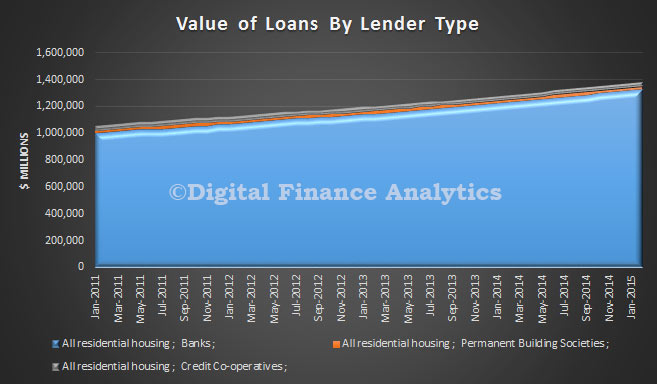
FirstTimeBUyersAdjustedFeb2015Finally, the bulk of lending is being done by the banks, relative to credit unions and building societies. The total loans on book was $1.375 trillion.

Loan-ValueByLenderTypeFeb2015

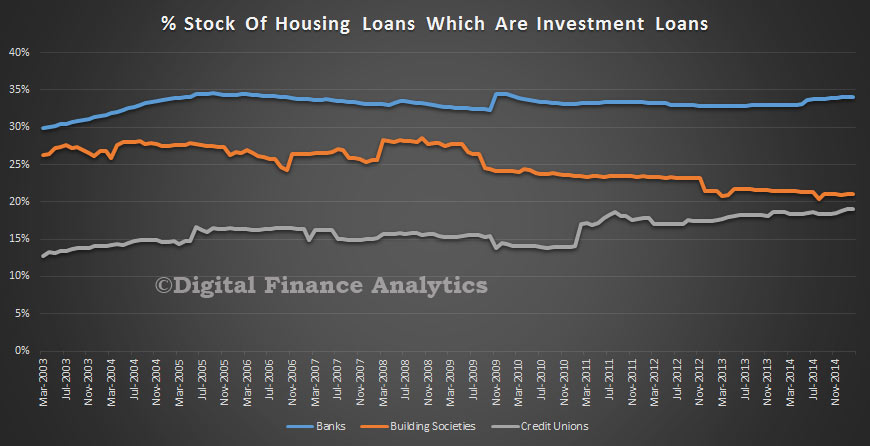
It is also worth noting that building societies are lending a smaller proportion of investment loans, and the falling trend here, compared with the rising trend in the credit union sector, though both are well below the 34% of banks loan portfolio.

LoanStockByTypeFeb2015


.

Housing Lending Now Worth $1.43 Trillion

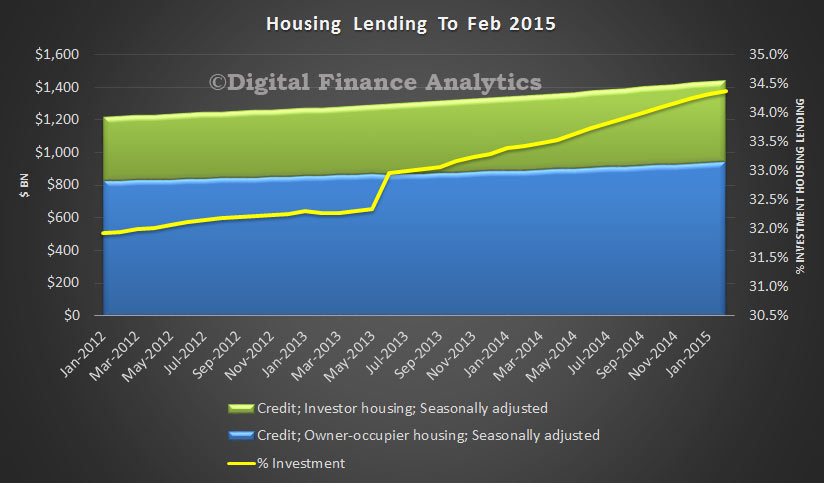
The RBA Credit Aggregates for February today told us what we already knew, housing credit is still booming. The value of loans outstanding rose by 0.54% (seasonally adjusted), with investment loans growing at 0.68% and owner occupied loans at 0.46%. As a result, the ratio of investment loans to owner occupied loans continued its rise to a record 34.4% of all housing. Yes, investment lending is out of control!

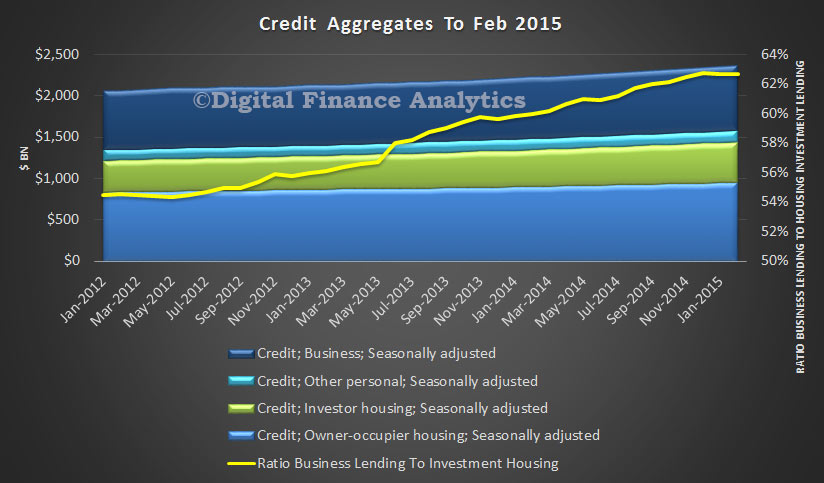
HousingLendingFeb2015Whilst business lending rose in the month by 0.64% and makes an annual growth rate of 5.6%, the ratio of housing investment loans to business lending continued to widen, it is now 62.7%. Personal credit fell slightly, down by 0.3% making a 12 month rate of 0.5%.

CreditAggregatesFeb2015The volume of investment loans driven by high demand from a range of household sectors continues to crowd out productive business lending, and fuels rising household debt, higher house prices and larger bank balance sheets. Lowering interest rates further will not help the position, but given lower than planned growth, we expect further cuts. This element which is missing in action is a proper approach to macroprudential controls. New Zealand have signalled a potential path.

Housing Credit Higher Yet Again

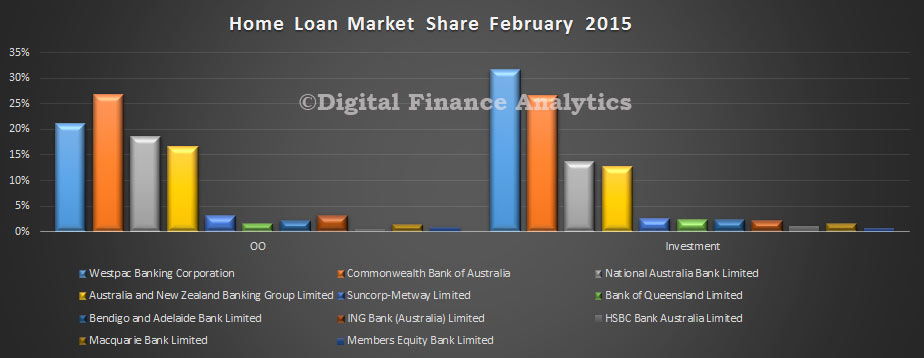
Today APRA released their Monthly Banking Statistics for February 2015. Overall housing lending by the banks rose by 0.53% in the month to $1.329 trillion. Investment lending rose by 0.68% and owner occupation loans by 0.45%. The lending records continue to be broken. Looking at bank by bank performance, CBA has the largest share of owner occupied loans (26.9%) whilst Westpac has 31.7% of investment home loans.

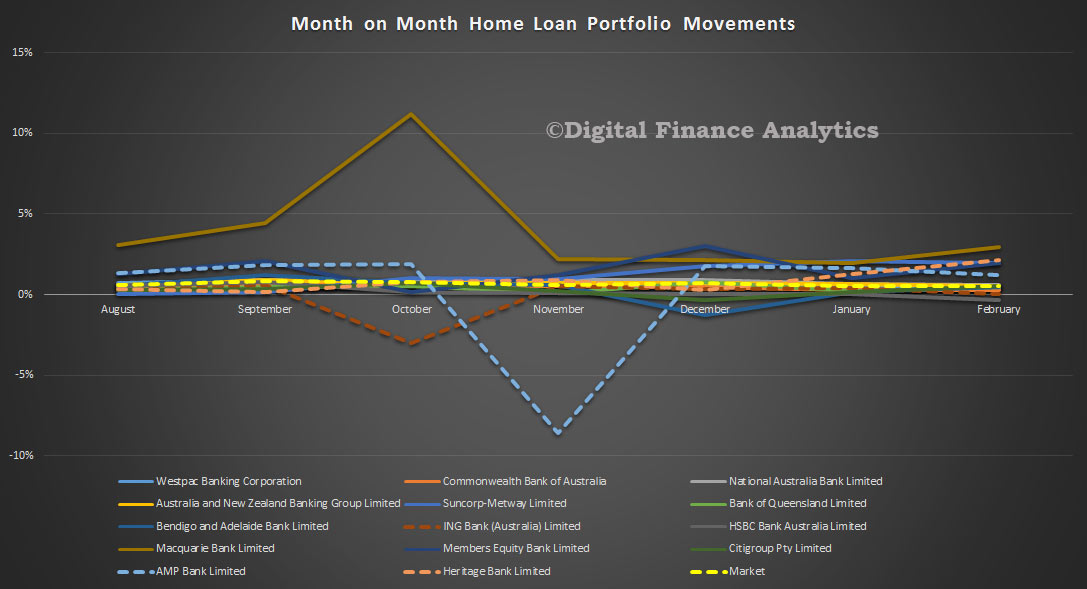
FebAPRAMBSFeb2014Tracking portfolio movements, we see that in the month Macquarie grew its total portfolio by 3% (compared with the market average of 0.5%), Suncorp and Members Equity Bank both grew by 1.9%, whilst AMP Bank rose by 1.2%

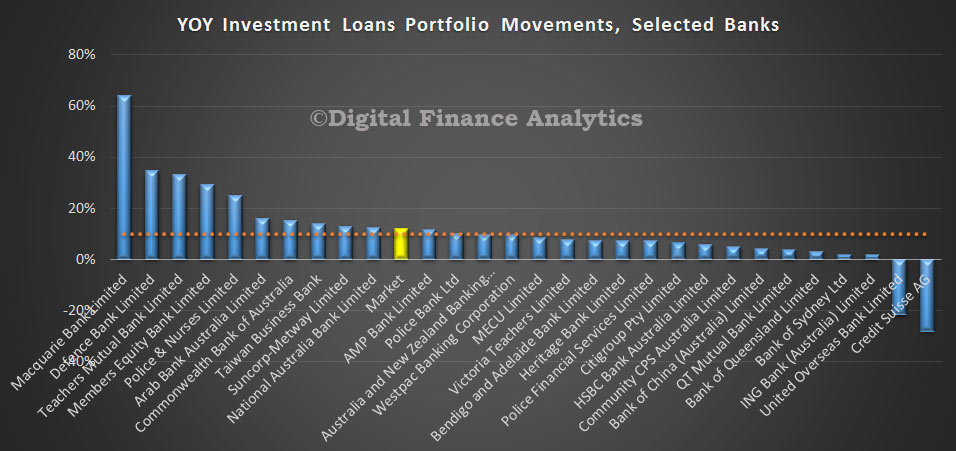
MonthlyPortfolioAPRAMBSFeb2014Looking at the YOY movements in the Investment portfolio, the market grew at 12% (above the APRA 10% monitor rate). A number of banks exceeded this growth level, with Macquarie, CBA and Suncorp at the top of the range.

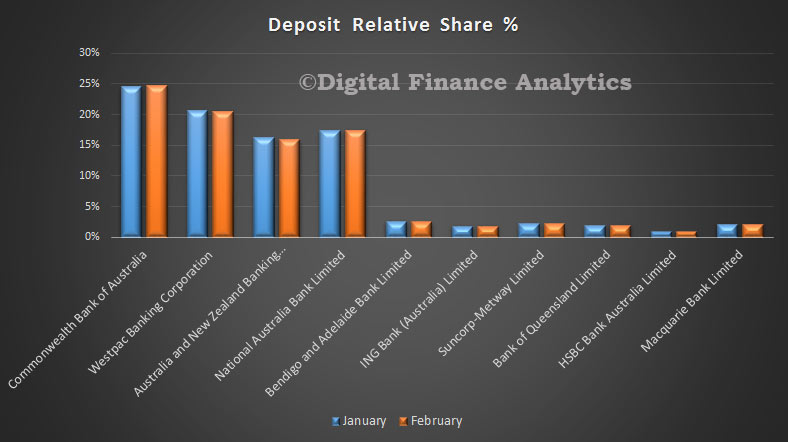
AnnualInvPOrtfolioAPRAMBSFeb2014 Turning to deposits, balances rose by 0.53% in the month, to $1,82 trillion. The portfolio mix changed a little in the month, though CBA still has the largest share at 24.8%.

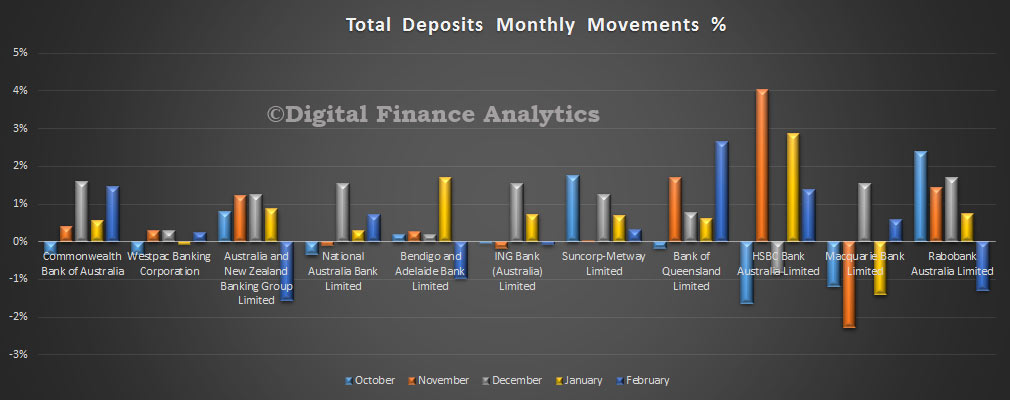
DepositFebAPRAMBSFeb2014Here are the monthly portfolio movements. ANZ, Bendigo and Rabbobank lost relative share, reflecting further deposit repricing strategies.

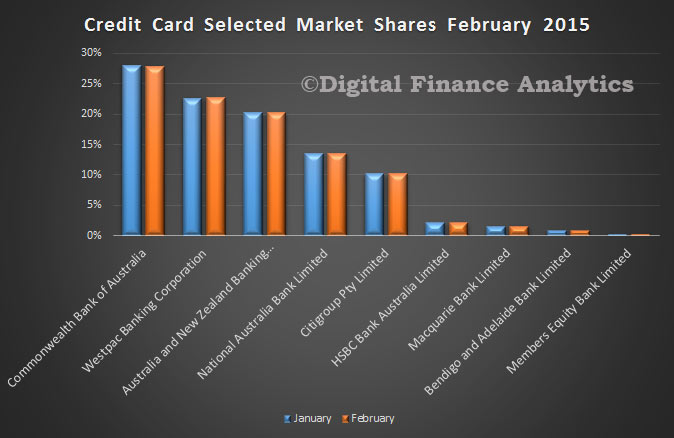
DepositMovementsAPRAMBSFeb2014Finally, the card portfolio rose to $41.5 billion. Little change in the market shares,with CBA at 27.8%, WBC at 22.7% and ANZ at 20.2%.

CardsFebAPRAMBSFeb2014

Latest Lending Data Investment Boom

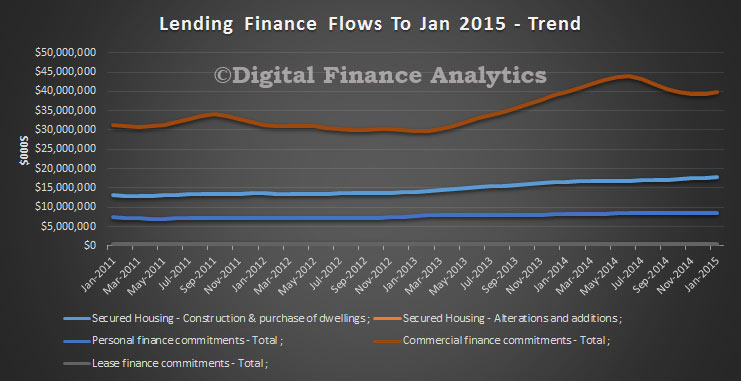
The ABS released their Lending Data to January 2015. The recent trends continue, with a growing investment housing lending sector, at the expense of  other commercial lending. In trend terms, The total value of owner occupied housing commitments excluding alterations and additions rose 0.8%. The trend series for the value of total personal finance commitments fell 0.1%. Revolving credit commitments rose 0.2%, while fixed lending commitments fell 0.3%. The trend series for the value of total commercial finance commitments rose 1.1%. Revolving credit commitments rose 6.6%, while fixed lending commitments fell 1.0%. The trend series for the value of total lease finance commitments fell 2.5% in January 2015.

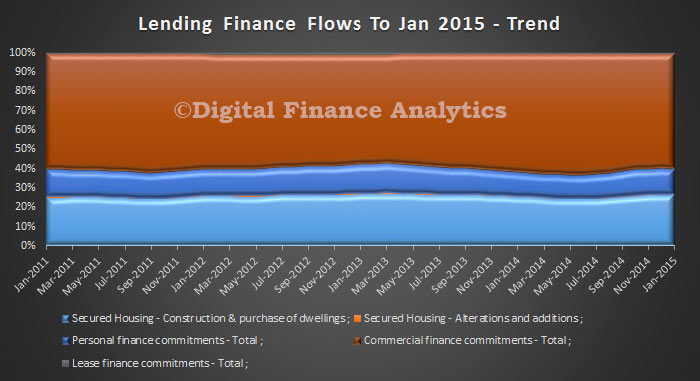
LendingMixJan2015We see a slight fall in relative terms in commercial lending, (and in this data. lending for investment housing is included in the commercial category. )

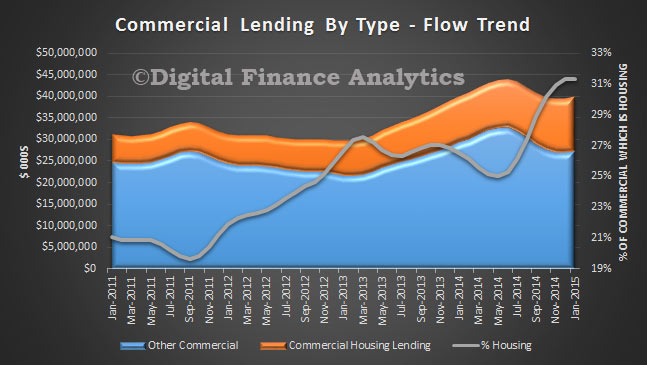
LendingMixPCJan2015But, splitting out the investment housing we see that more than 31% of all commercial lending is for investment housing – and note the consistent trend up from 19% in 2011.

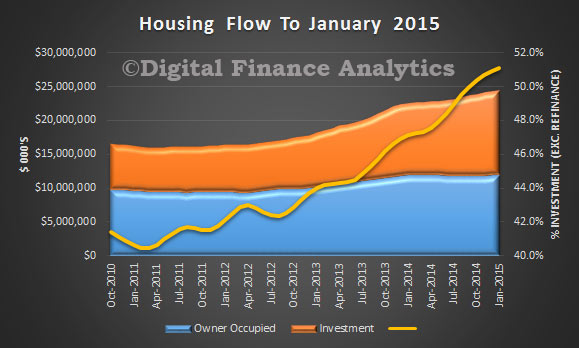
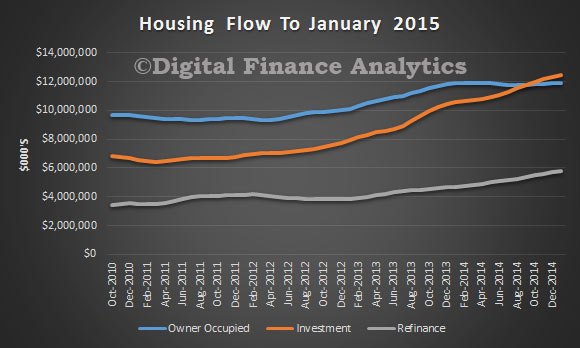
LendingCommercialMixPCJan2015Turning to housing lending, we see investment loan flows were more than 51% of all new loans written (excluding refinance).

LendingHousingMixPCJan2015In other words, more investment loans than owner occupied loans were written in January 2015.

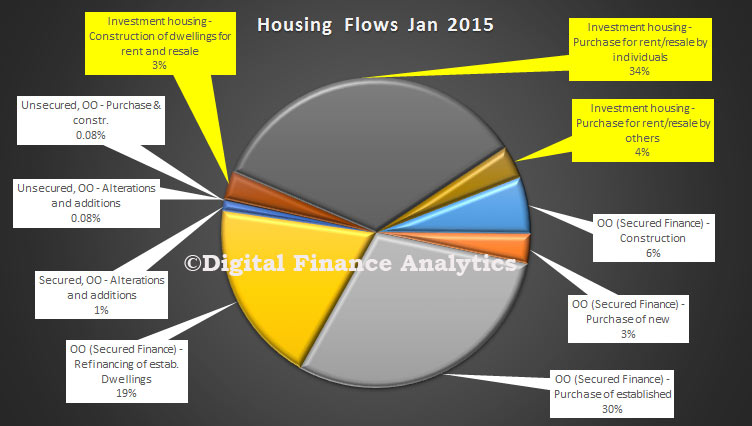
LendingHousingMixJan2015Finally, looking across all housing categories, we see that investment loans made up 41%.

LendingFinancePieJan2015  This momentum in investment lending continues to distort the market. We need proactive intervention, like the recently announced initiatives in New Zealand. I have to say I think APRA is just not cutting the mustard.

First Time Buyer Investors On The March

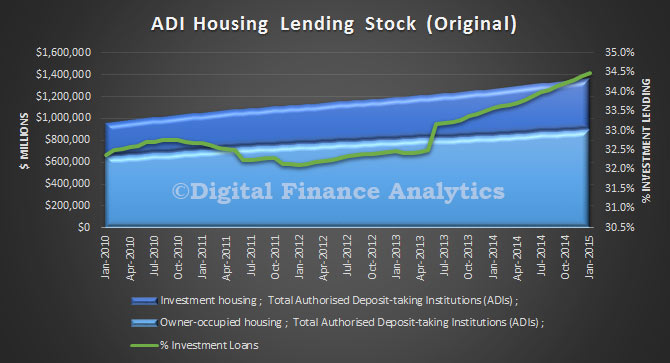
The ABS published their Housing Finance to January 2015. Total lending for housing (both investment and owner occupied lending) lifted the stock 0.6% to $1.37 trillion. Investment rose 0.8% and owner occupied loans rose 0.5% in the month. Investment loans are close to 34.5% of all loans, a record.

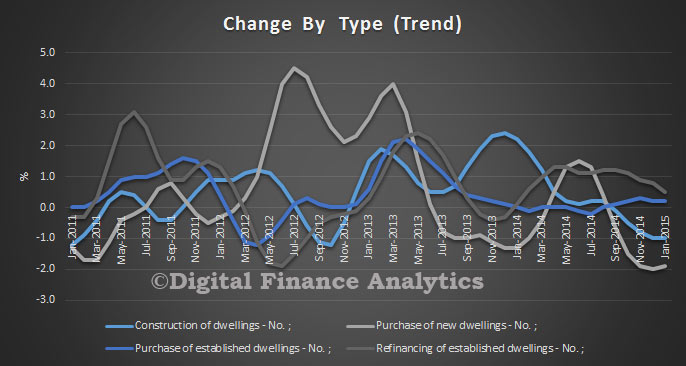
ADILendingStockJan2015Looking at the changes in volumes by type, we see that the purchase of existing dwellings is rising, but refinancing, construction of new dwellings and purchase of new dwellings are down.

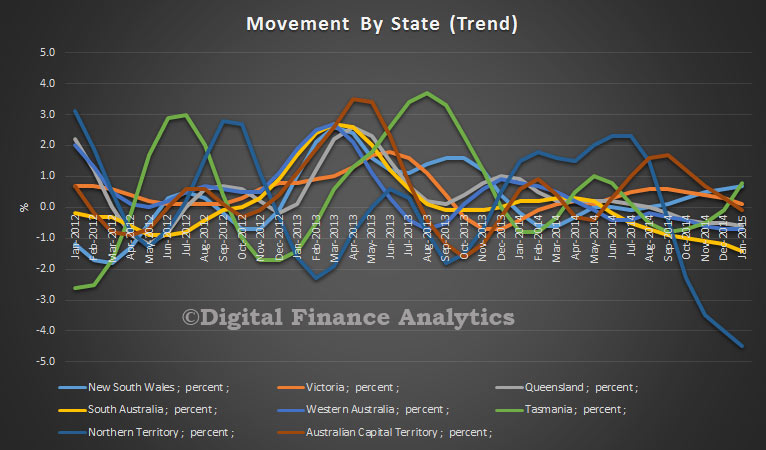
TrendChangeByTypeJan2015Looking across the states, momentum is rising in just two states, NSW and TAS. All other states are slowing.

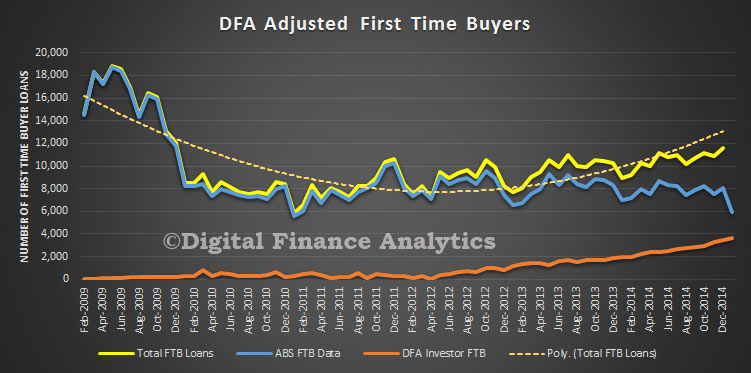
StateTrendMovementsJan2015Turning to first time buyers, using the revised ABS data (method changed last month) and DFA survey data, we see that whilst first time buyers for owner occupation fell slightly (14.3% to 14.2% of all owner occupied loans), an additional 4,000 loans were written by first time buyers going direct to the investment sector. Much of this is centered on Sydney. As a result the cumulative first time buyer count is rising, with more than 21% of all loans effectively to first time buyers. You can read more analysis on this important trend here.

DFAFTBLoansJan2015This is another reason why no further assistance should be offered to “help” first time buyers into the market. It would be a waste of money.


Loan Portfolio Analysis To January 2015 – Where APRA May Look

The Monthly Banking Statistics from APRA, released late last week, shows some interesting trends across the loans portfolios of individual banks in the sector. It of course does not include the non-banks. A number of smaller players are likely to gain APRA’s attention.

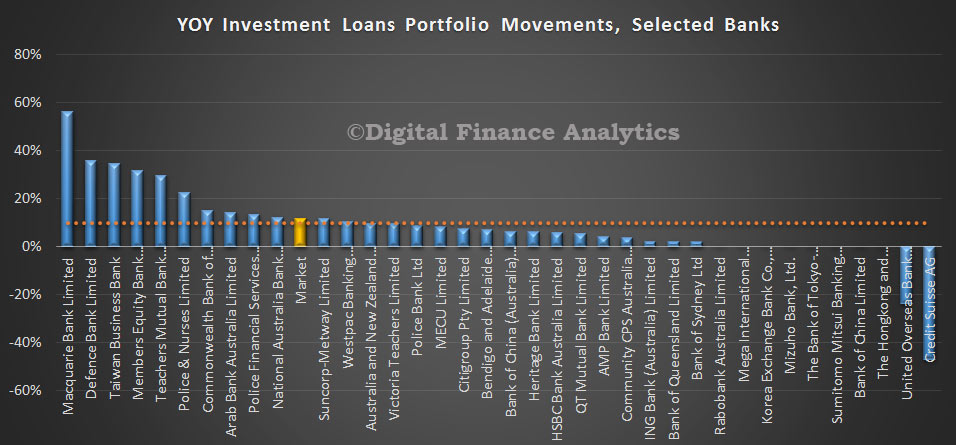
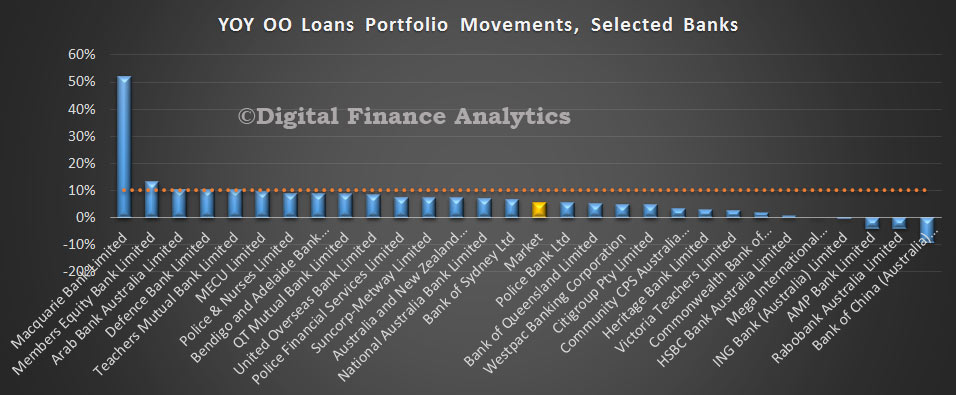
Looking first at the year on year portfolio movements for investment home loans, (of interest given APRA’s recent statements “strong growth in lending to property investors — portfolio growth materially above a threshold of 10 per cent will be an important risk indicator for APRA supervisors in considering the need for further action”), we see a market average (Jan-Jan) of 12%. But there are significant differences between players, with several above 20% growth, CBA at 15%, NAB at 12%, Suncorp at 11% and Westpac at 10%.

MBSYOYINVMovementsJan2015Looking at owner occupied loans, the market grew at 5.6%, with significant portfolio variations, including Members Equity at 13%, Bendigo and Adelaide at 9%, and Suncorp at 7%. Remember, these are net portfolio movements, (allowing for new loans, and existing loan run-off. Macquarie stands out, but that is because of the $1.5 billion portfolio of non-branded mortgages they purchased from ING in September.

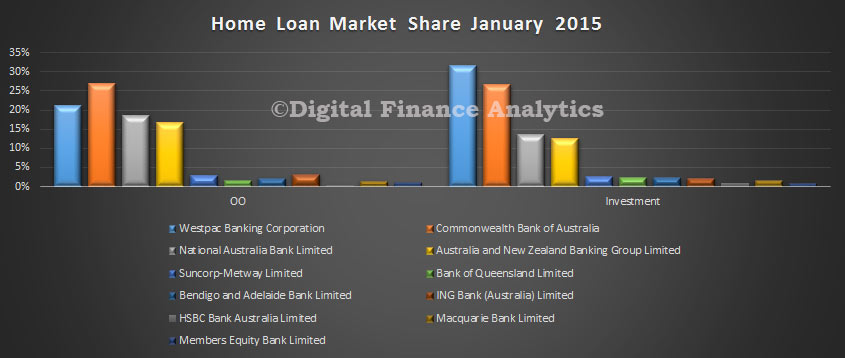
MBSYOYOOMovementsJan2015 In January, the portfolio grew by 0.42% for owner occupied loans to $859,645 bn, whilst investment loans grew 0.76% to $462,358 bn. Investment loans make up 35% of the bank’s portfolios. Total lending was up by $7,107 Bn. Looking at the current share of loans, there was little change in mix, with CBA the largest owner occupied loans provider, and Westpac the largest investment loan provider.

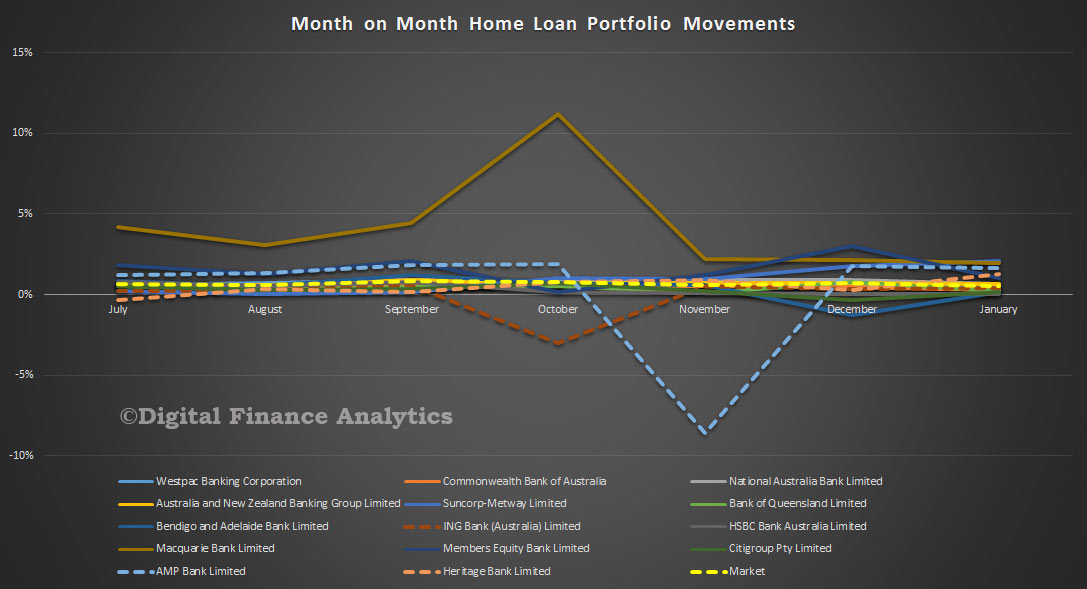
MBSHomeLoansShareJan2015We see Macquarie, AMP and Heritage Buildoing Society growing their loan portfolios the fastest last month.

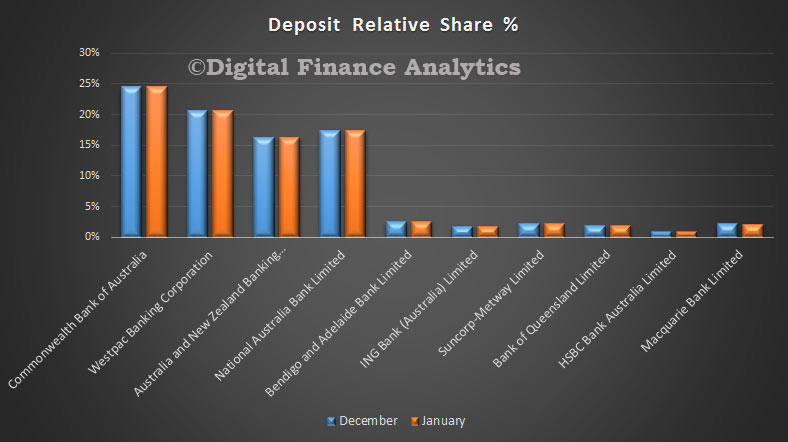
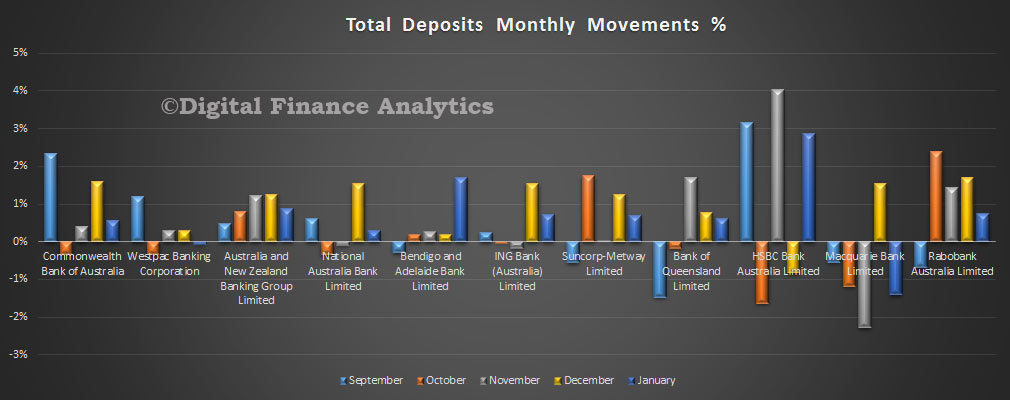
MBSHomeLoansMonthlyMovementsJan2015Turning to deposits, they grew by 0.61% in the month, up $10,948 bn, to $1,807,882 bn. There was little change in the overall portfolio, with CBA still holding nearly a quarter of the market.

MBSDepositSharesJan2015However, looking at the portfolio movements, we see the smaller players, like Bendigo ING, Rabobank and HSBC growing faster compared with the main players. This represents differential deposit discounting which has been in play, thanks to beguine wholesale markets, and competition for deposits easing – bad news for depositors, and rates continue to fall.

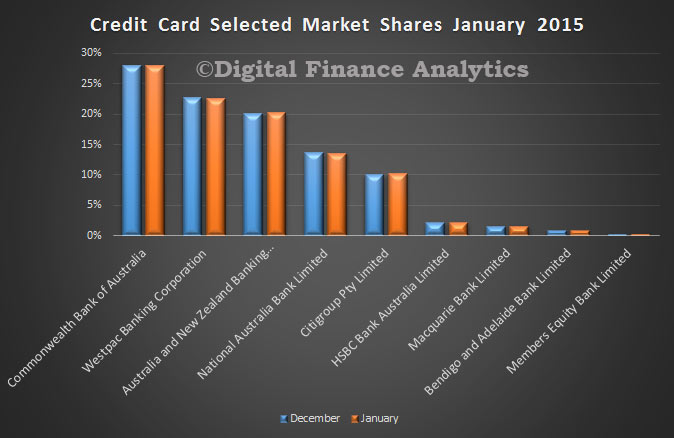
MBSDepositMovementsJaqn2015Finally, credit card balances fell slightly in the month (after the Christmas splurge) down $824 bn to $41,002 bn. Little change in the footprint of the major players.

MBSCardsJanuary2015


Home Lending Up To $1.43 Trillion

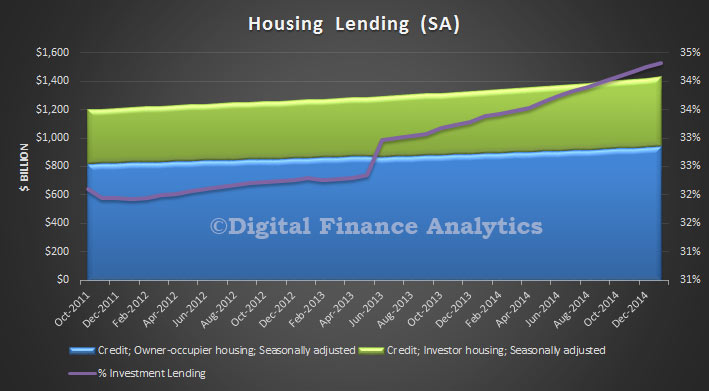
Latest data from the RBA shows that home lending is worth $1.43 trillion, to end January. In the month, lending rose $8.5 billion, or 0.6%. However, investment home lending grew at 0.8%, whilst owner occupied lending grew at 0.49%. Investment lending was at a record 34.3% of total housing.

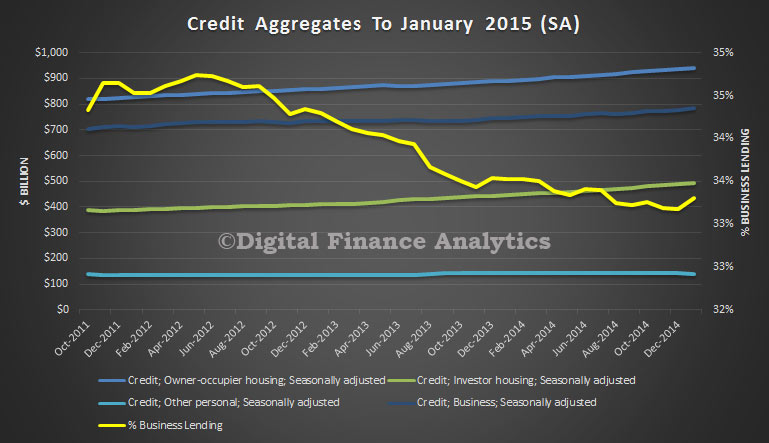
HousingAggregatesJan2015More broadly, total lending was up 0.6% from last month, and 6.2% year on year. The share of lending to business continued to fall as a share of total lending, now down to one third of all funds borrowed. This needs to be lifted if sustainable growth is to be delivered. Banks are biased toward ever more home lending, thanks to lower losses and advantaged capital requirements.

CreditAggregatesJan2015

Banks More Leveraged Into Housing Than Ever

Putting together data from the recent ABS releases, we can view some important data which shows that today Banks in Australia are deeper into property than ever they have been. As a result they are more leveraged (thanks to capital adequacy rules) and more exposed if prices were to turn. Meantime, other classes of commercial lending continues to decline.

To show this, we look first at the share of commercial lending which is investment housing related. These are the monthly flows, not the overall stocks of loans on book. On latest trend data, around 33 per cent of monthly lending is for investment housing. Its normal range was 20-25 percent, but thanks to a spike in investment for housing, and a fall in other commercial lending categories it has broken above 30 percent. From a capital and risk perspective, lending for investment housing is adjudged as less risky than other commercial lending categories.

InvestmentLendingAsShareOfCommercialDec2014Now, lets look at all lending for property, including owner occupied lending, investment lending, and alterations, again from a flow perspective. Now we find that 47 per cent of all monthly flows are property related, again, higher than it has traditionally been.

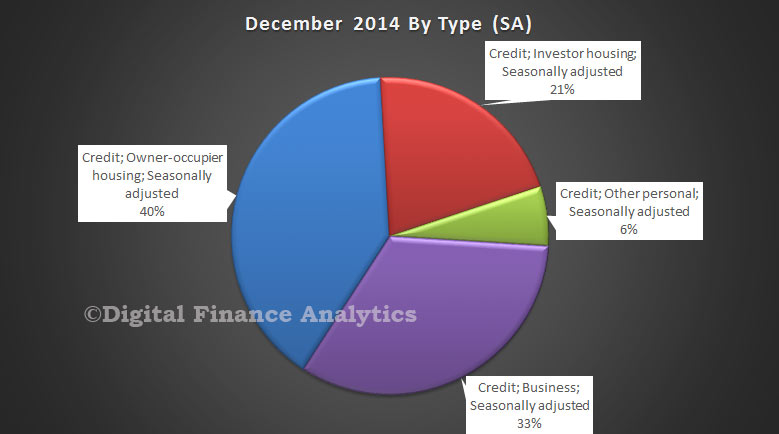
LendingDec14HousingVSAllFinally, in our earlier analysis we highlighted the relative stock of different loan types. Overall, only 33% of all lending is productive finance for business purposes. Household and consumer debt continues to rise strongly. Housing Lending is driving the outcomes.

SplitsDec2014

This is unproductive lending, simply feeding the debt beast, and inflating property to boot. It also means the banks have strong interests in keeping the beast fed, and the RBA, conscious of the need for financial stability, will continue to support the current mix. As Murray pointed out the government is guaranteeing the banks and if there was a failure the tax payer would pick up the tab.

Lending Growth In December Only Supported By Housing

The ABS published their lending finance data for December. Only Housing Lending increased. All other categories declined. We know that investment housing lending grew the fastest.

Comparing December, with November, the total value of owner occupied housing commitments excluding alterations and additions rose 0.9% in trend terms, and the seasonally adjusted series rose 3.8%.

LendingByCategoryDec2014The trend series for the value of total personal finance commitments fell 0.1%. Revolving credit commitments fell 0.4%, while fixed lending commitments rose 0.1%. The seasonally adjusted series for the value of total personal finance commitments fell 2.5%. Revolving credit commitments fell 5.2% and fixed lending commitments fell 0.4%.

The trend series for the value of total commercial finance commitments fell 2.9%. Revolving credit commitments fell 5.1% and fixed lending commitments fell 2.2%. The seasonally adjusted series for the value of total commercial finance commitments rose 0.4%. Revolving credit commitments rose 4.3%, while fixed lending commitments fell 0.9%.

The trend series for the value of total lease finance commitments fell 3.8% in December 2014 and the seasonally adjusted series fell 11.2%, following a fall of 6.7% in November 2014.