ADI Home Lending Growth Slows Again in January 2019

APRA released the monthly banking statistics to end January 2019, and they show a further moderation in home finance lending to both owner occupiers and investors. In fact investment lending balances fell a little.

Its worth highlighting these are raw numbers, no seasonal adjustment, and are based on the returns sent from the banks (possibly data is late thanks to the holidays?).

Nevertheless, it appears to show the credit impulse continues to slow, and this will translate into further home price falls ahead.

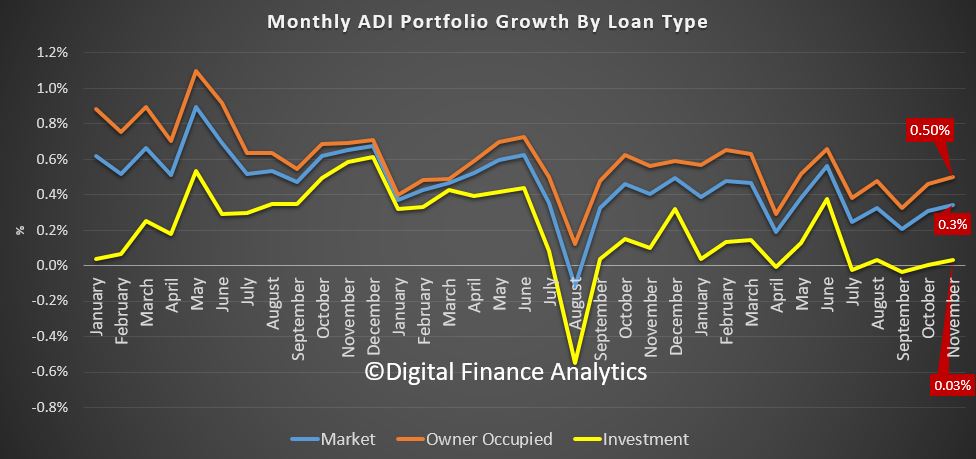
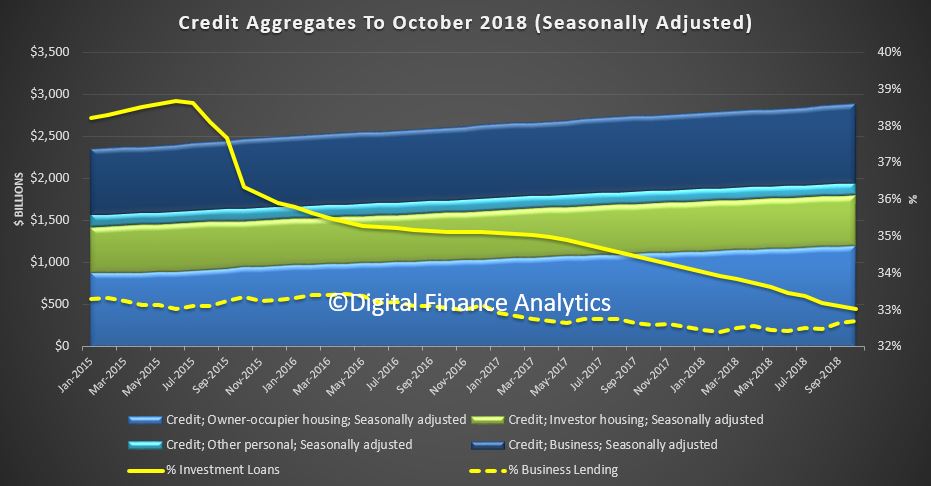
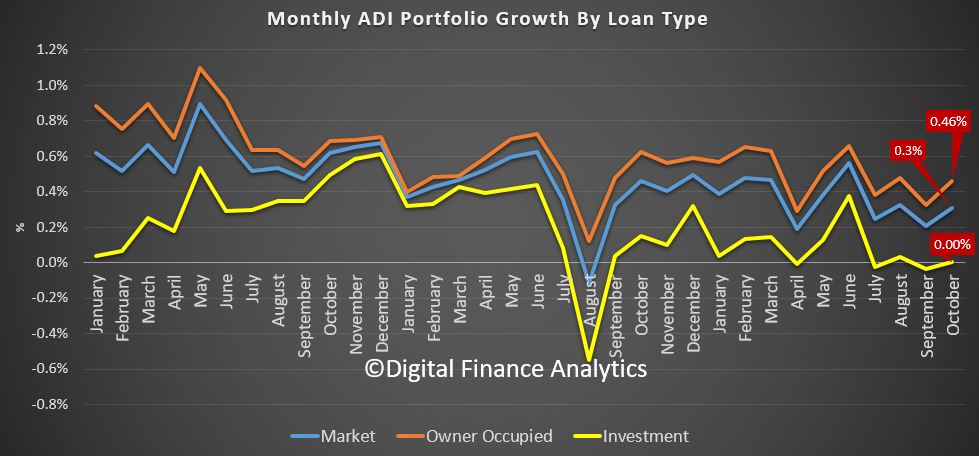
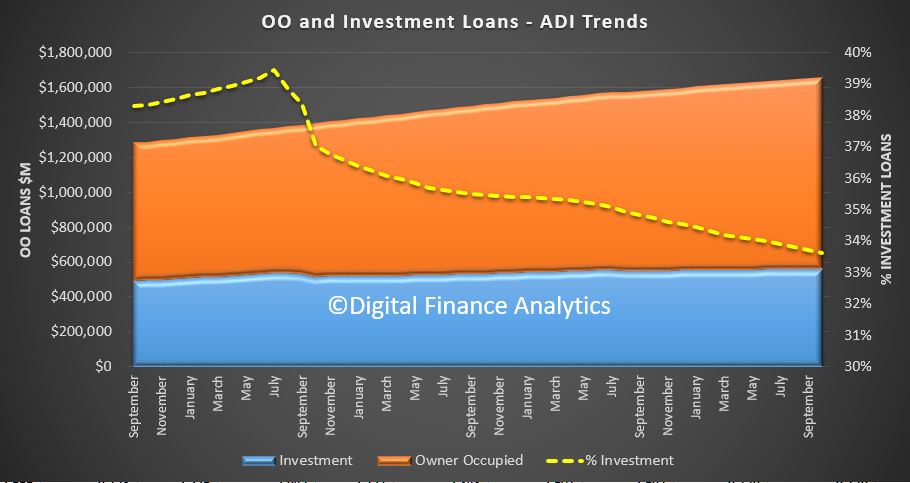
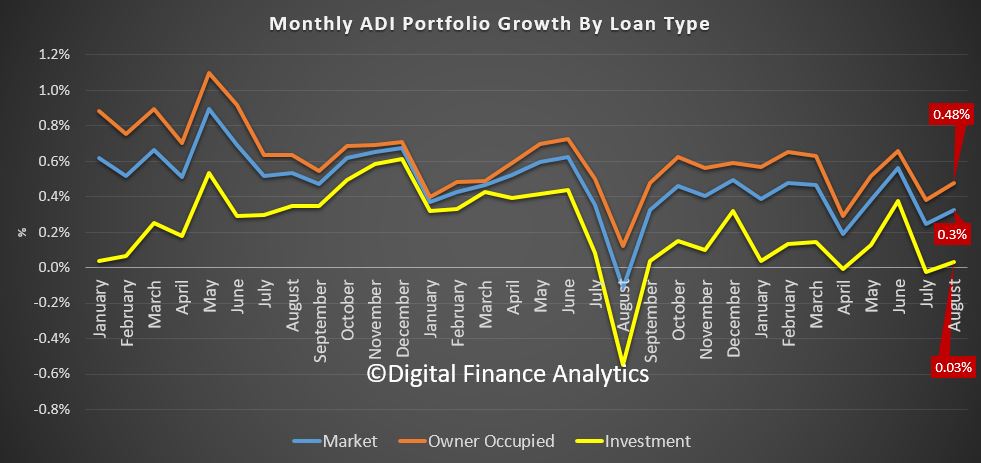
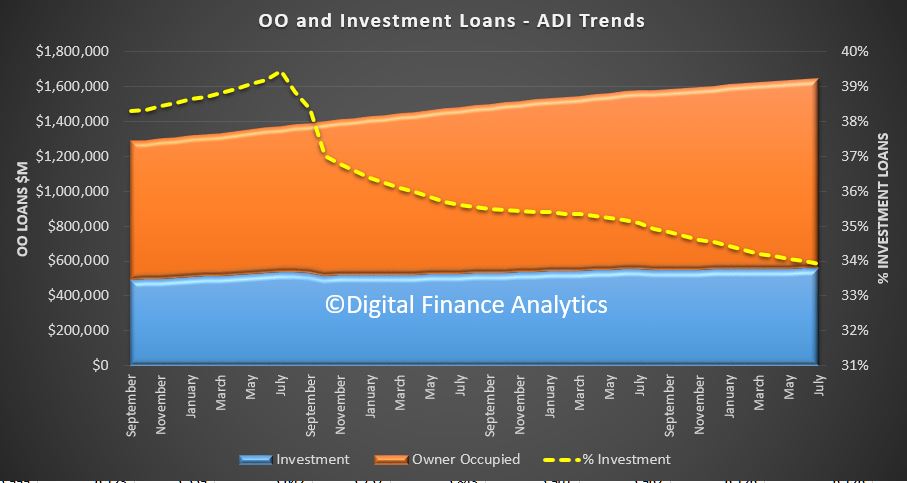
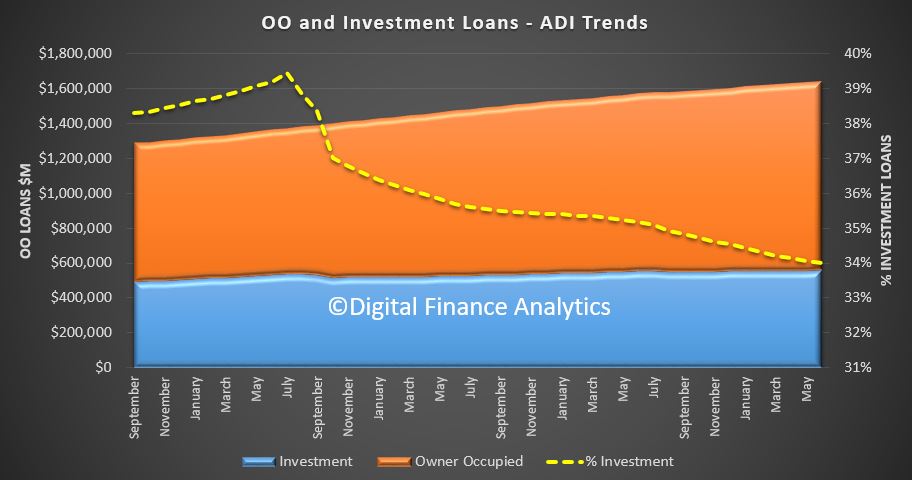
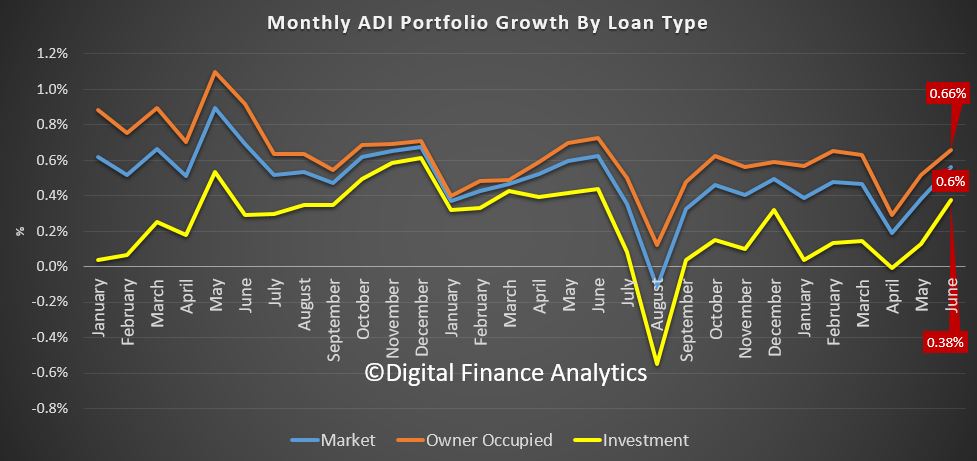
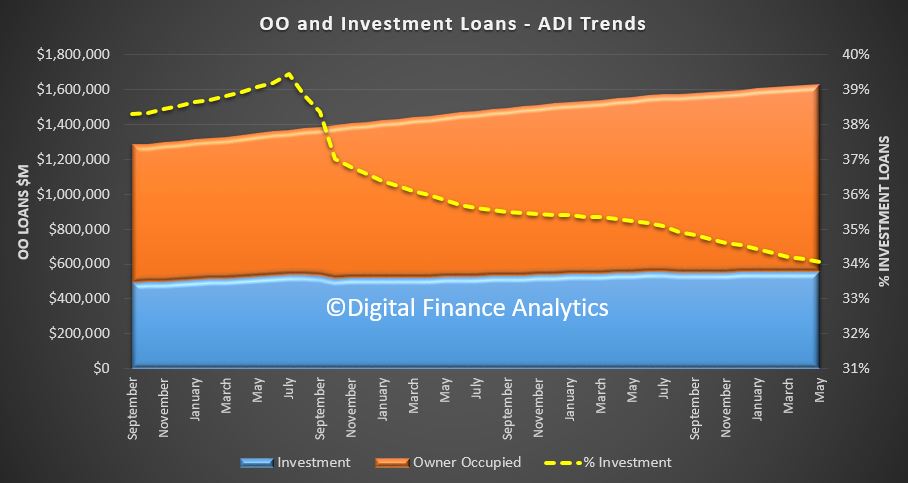
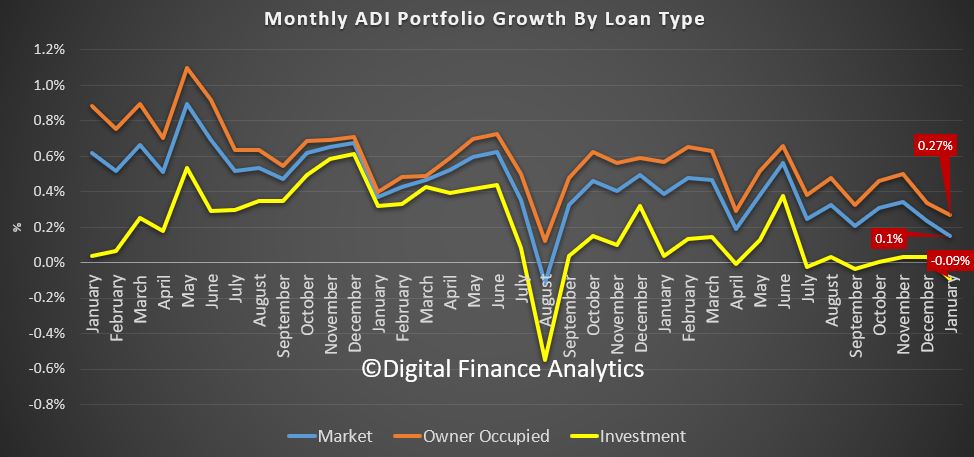
Overall the value of home lending from the banks rose 0.15% in the month, to $1.67 trillion dollars. This be be equivalent to an annual rate of just 1.8%. This is the lowest growth rate for years. Within that lending for owner occupation rose by 0.27% to $1.11 trillion dollars and lending for investment purposes FELL 0.09% to $557 billion. Investment loans comprise 33.37% of all loans on book.

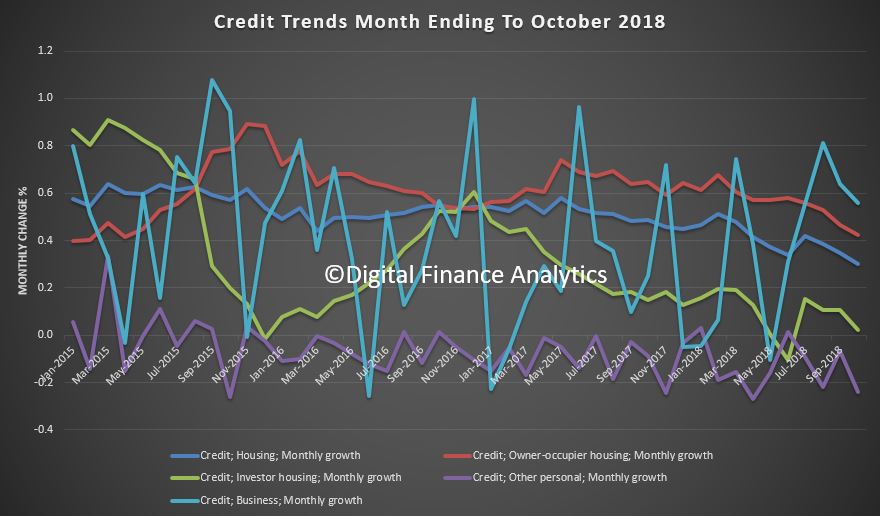
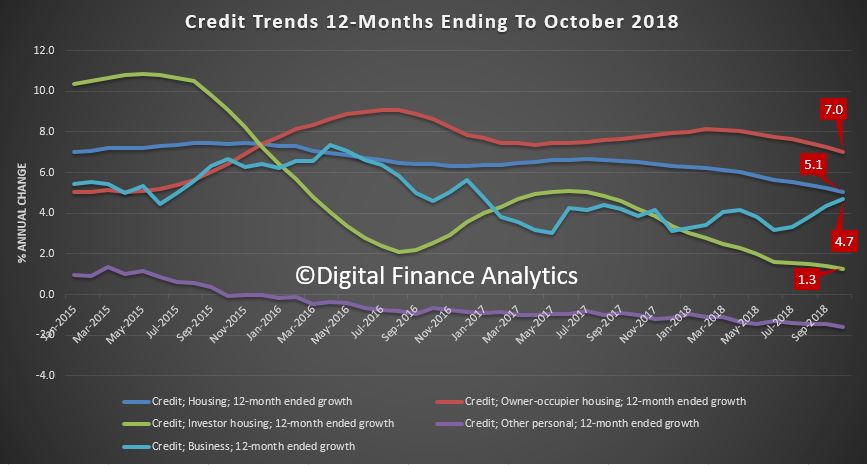
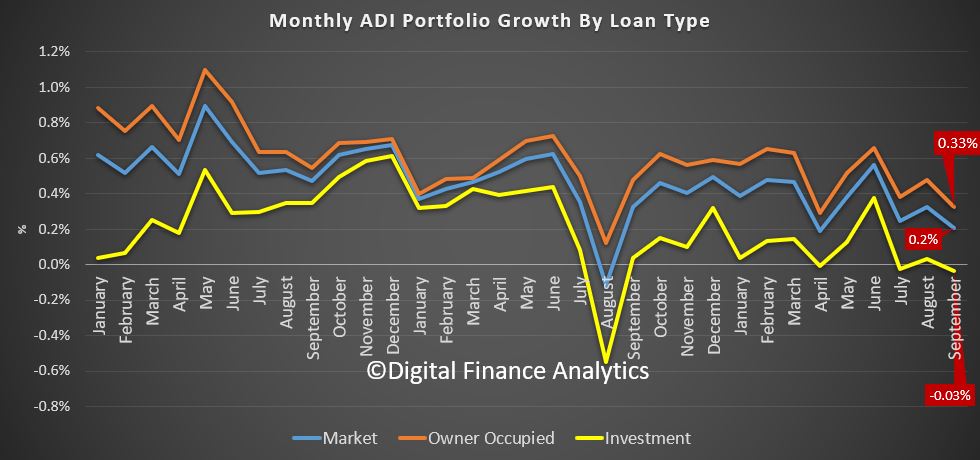
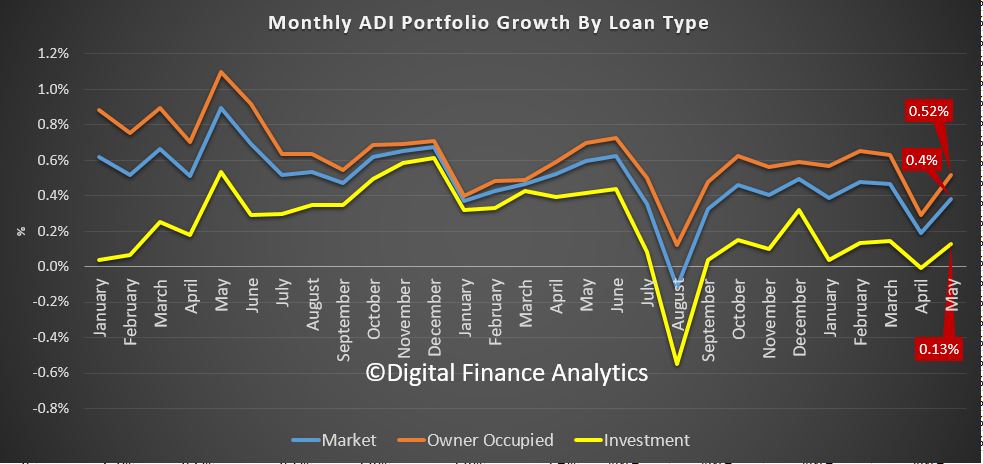
We can track the growth rates by category. Overall growth rates continue to fall across the board.

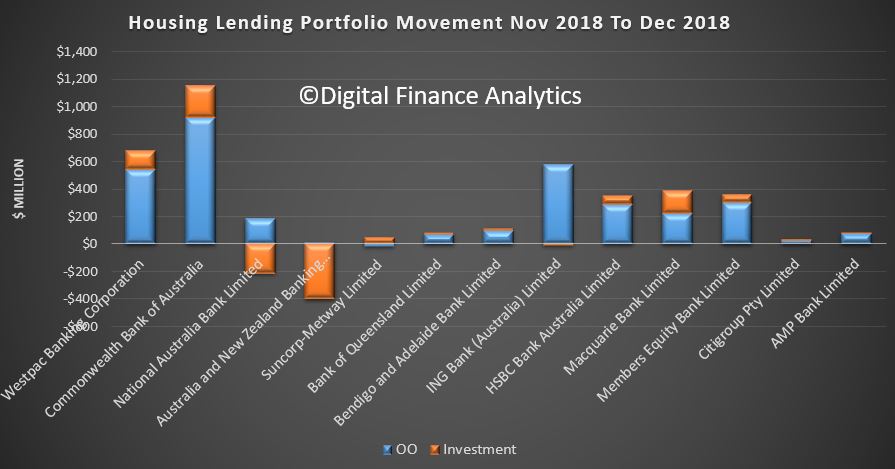
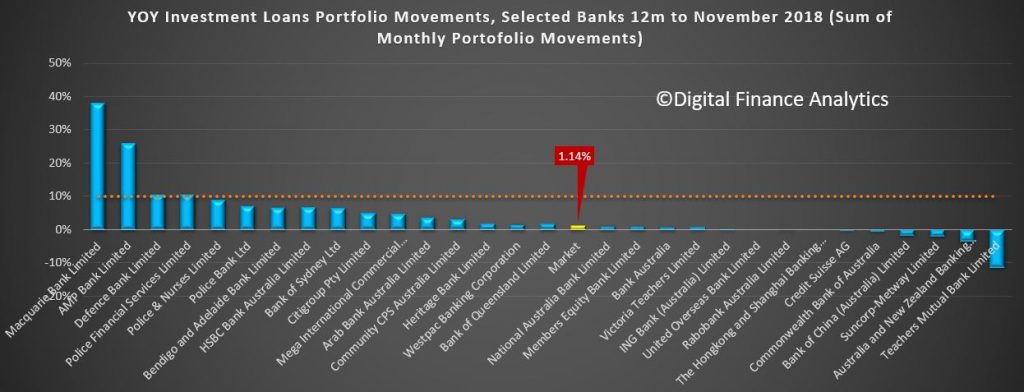
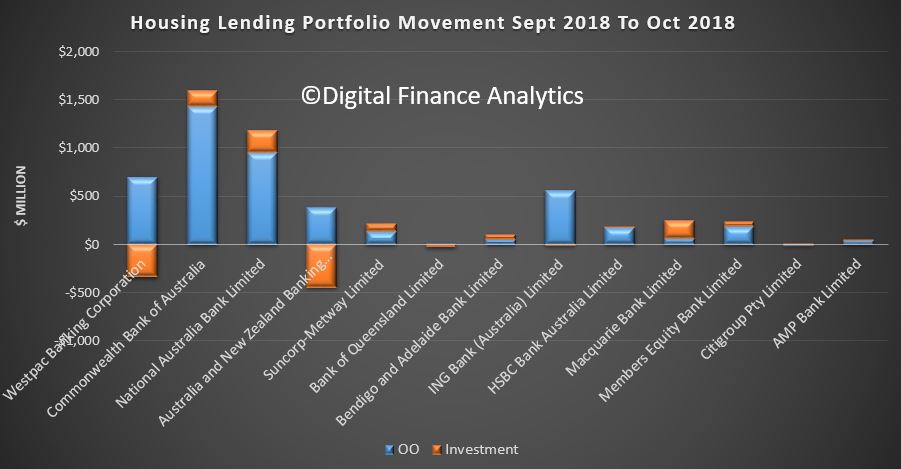
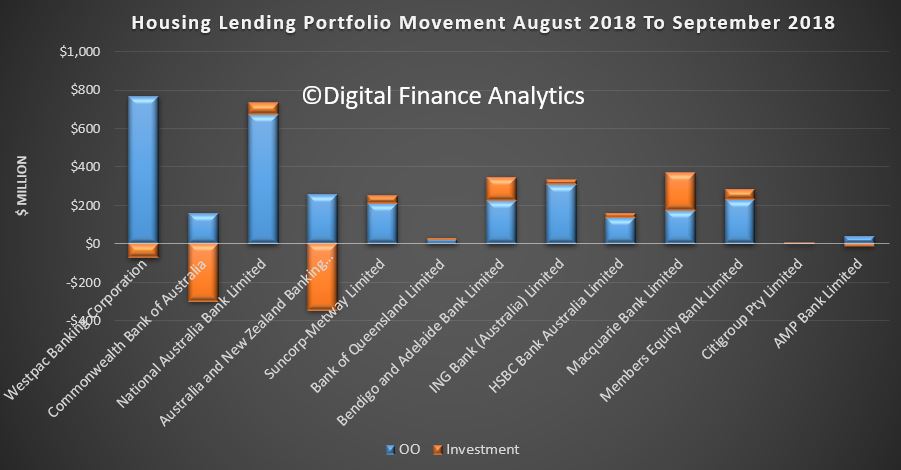
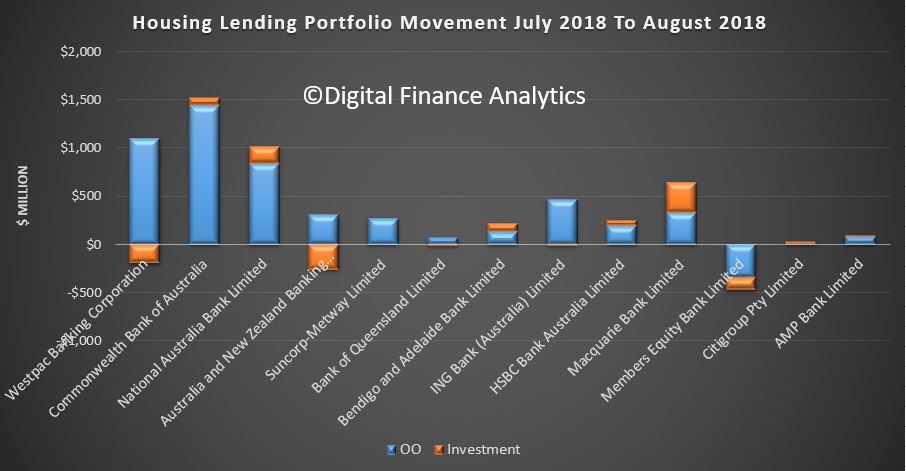
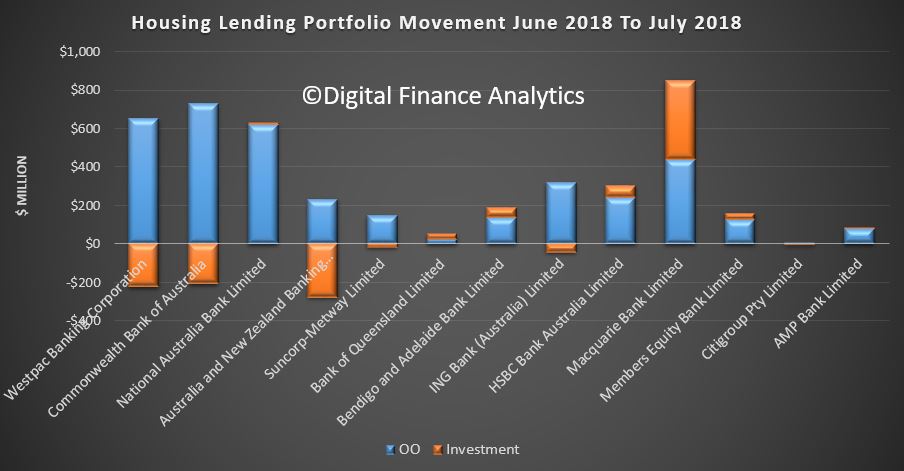
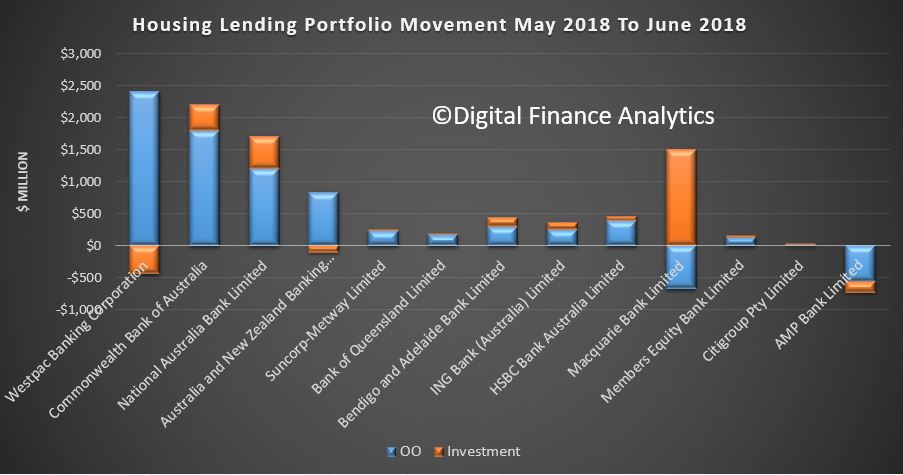
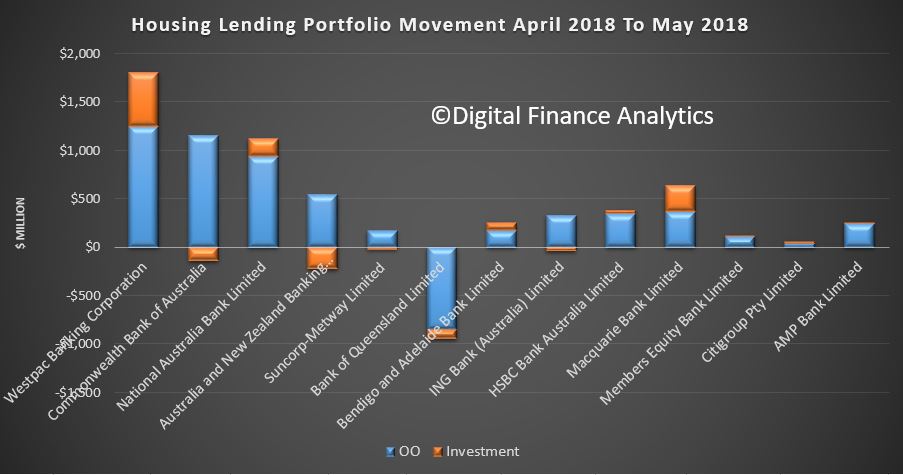
The individual movements within the banks makes interesting reading, with all the large banks seeing their investment lending pools shrinking, while Macquarie, HSBC and Bendigo/Adelaide Bank, plus AMP are taking up the slack. We hope they have adequate underwriting standards in place!

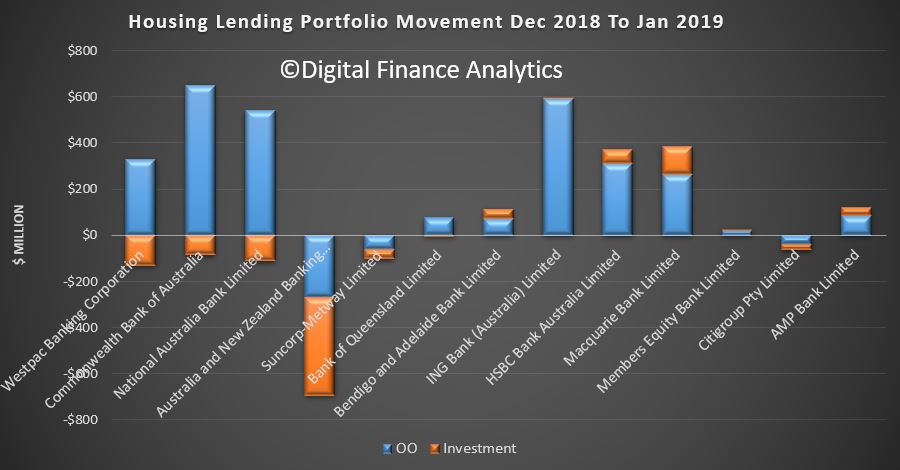
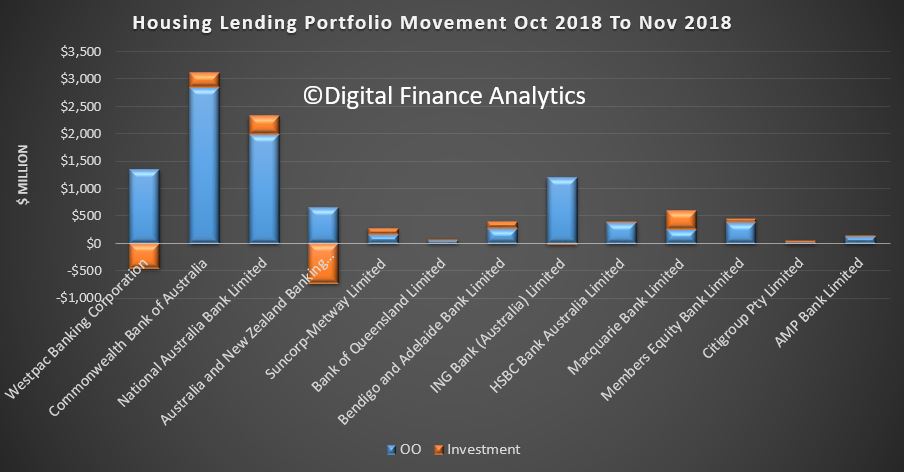
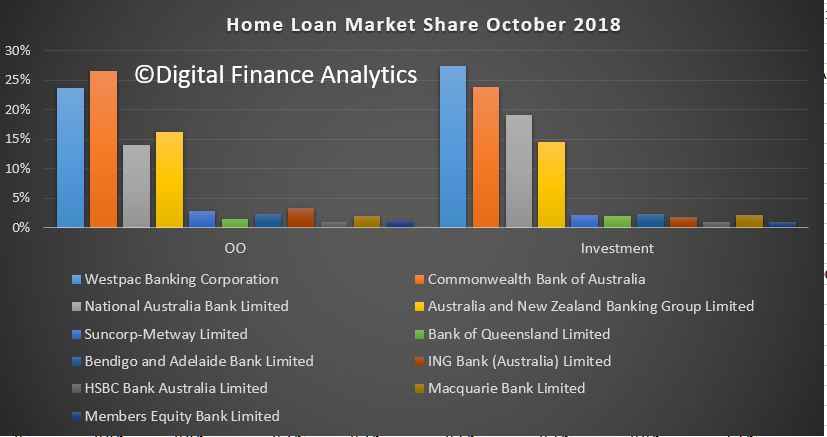
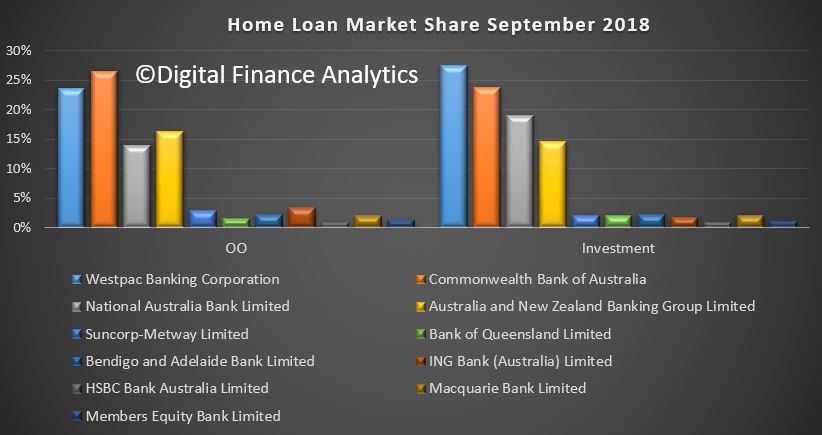
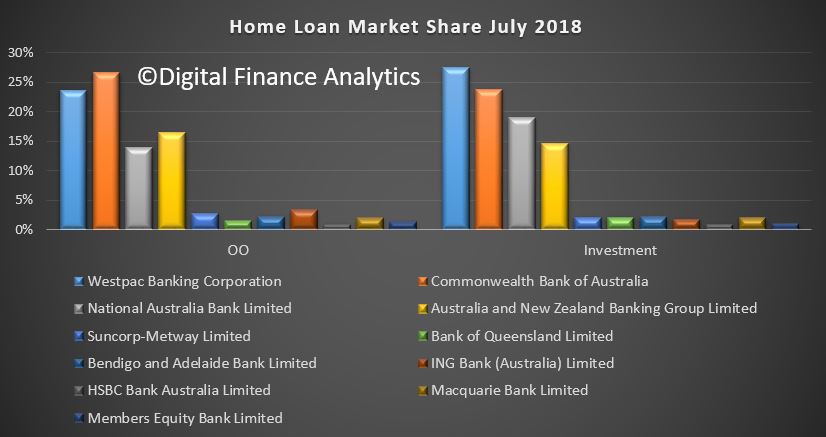
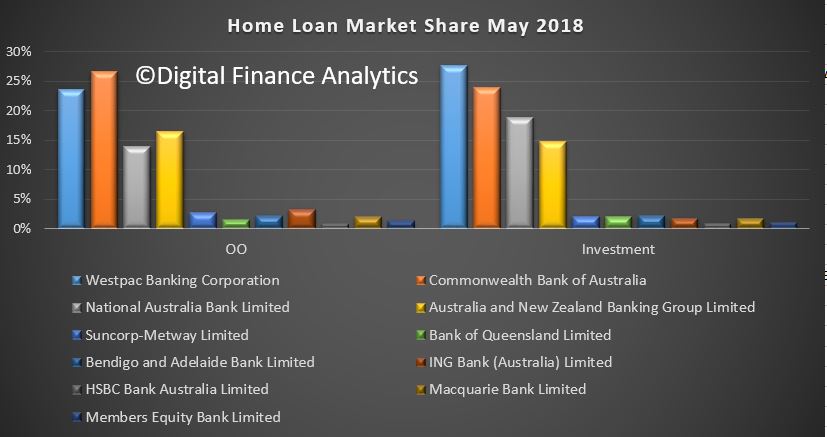
The portfolio movements remain pretty much the same, with CBA the largest owner occupied lender, and Westpac the largest investment loan lender.

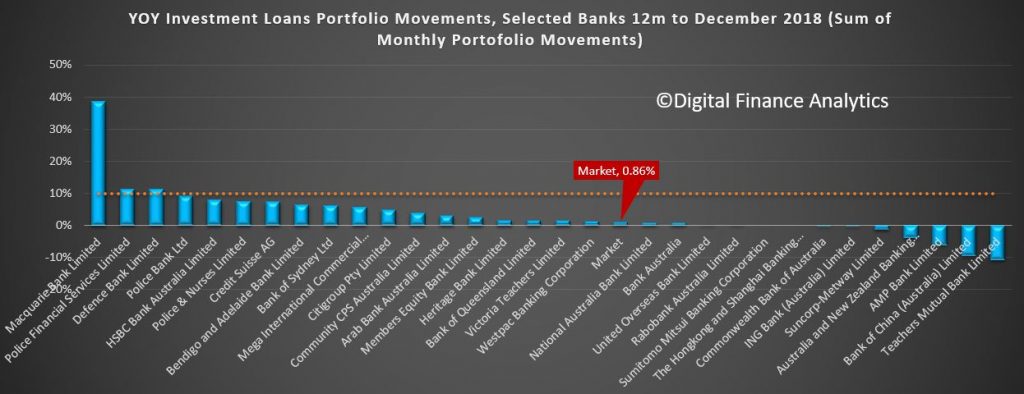
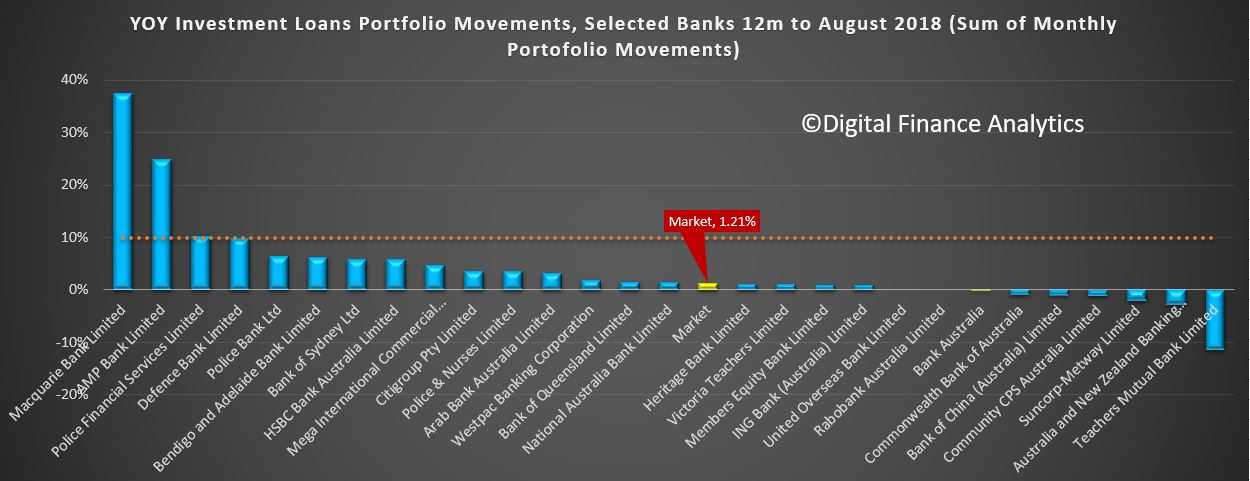
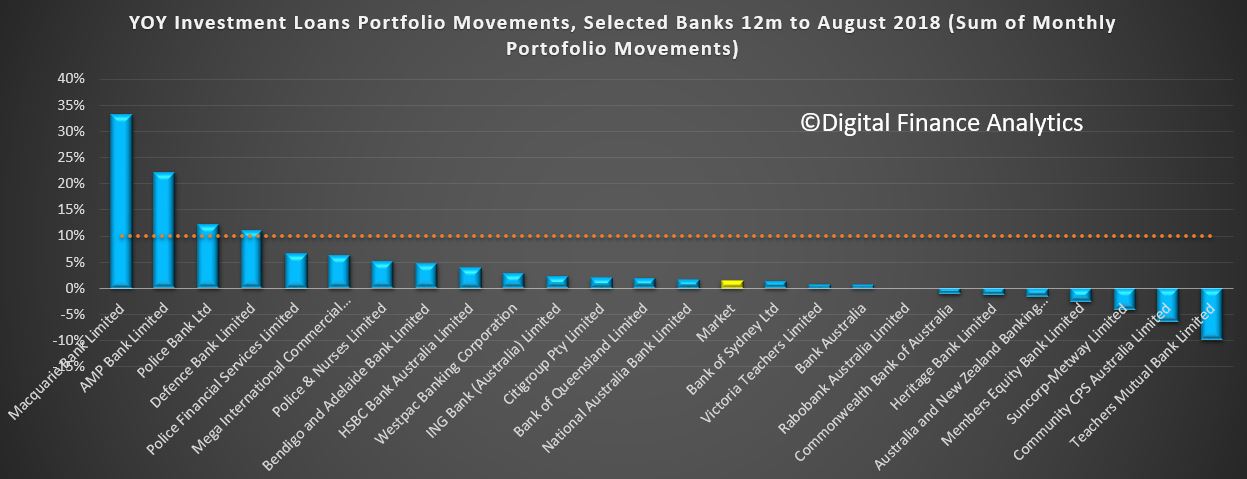
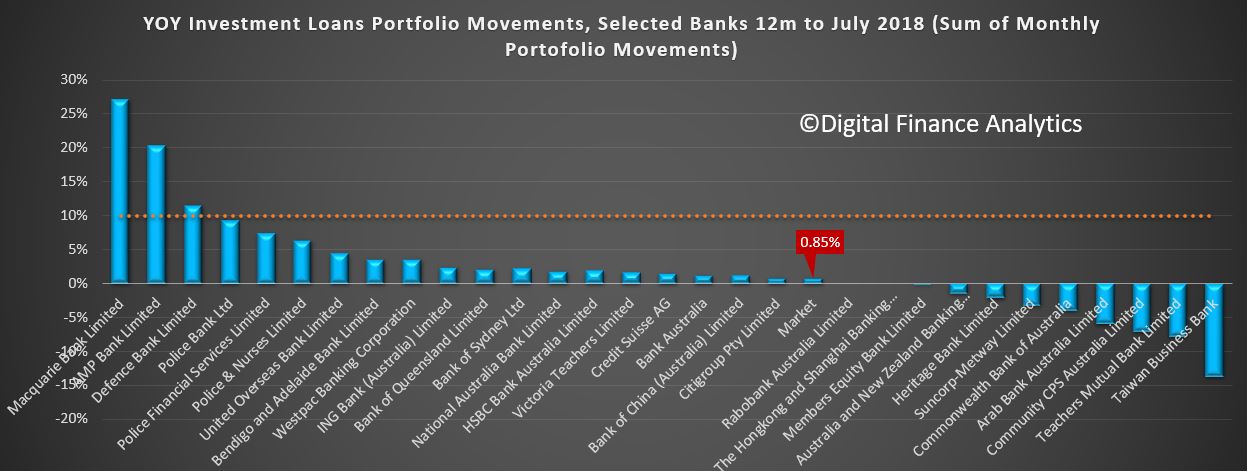
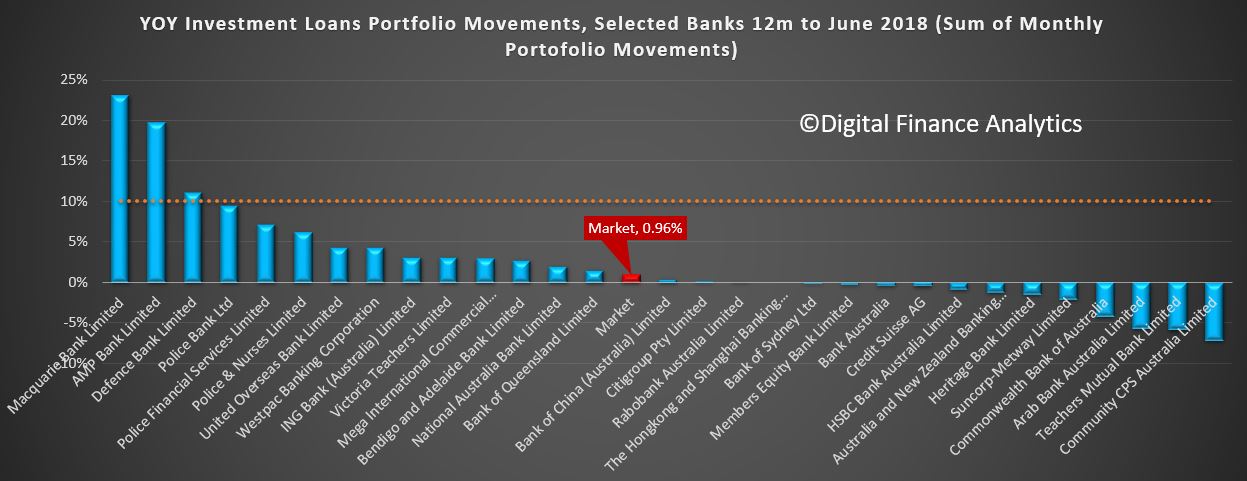
Whilst the 10% APRA speed cap is obsolete now, the annual movements show that the majors are well off the pace compared with some of the smaller lenders, and the market grew (based on monthly averages) by just 0.73%, with below zero growth rates in 4 of the past 12 months.

The investment lending party is well and truly over, but the hangover, in terms of big loans, interest only loans, and falling returns will be with us for years. The credit impulse is dying – prices will continue to fall as lending standards are normalised. Lets be clear, freely available credit inflated home prices, the reverse is also true. Short of breaking the responsible lending rules again, there is no way out.

ADI Credit Growth Continues To Slow

APRA released their monthly banking statistics to end December 2018 today. Total loan stock for housing was $1.67 trillion dollars, up 0.23% from last month (equivalent to 2.8% if annualized). Another record.

Within that loans for owner occupied housing rose to $1.11 trillion dollars, up 0.33% from November, or $3.7 billion dollars, while investment loans rose $173 million. Overall investment loans fell to 33.45% of portfolio.

The movements show a steady decline in owner occupied loans, and a slight rebound in investor loans, from a very low base.

Looking at the banks’ portfolio movements, we see significant variations in strategy, with Westpac and CBA still lending, especially on owner occupied loans, alongside ING, HSBC and Members Equity. But NAB and ANZ have slowed their growth, and in fact dropped their share of investment loans a little in December.

That said the portfolio moves are at the margin, with CBA and Westpac maintaining their leading positions in owner occupied and investment loans respectability.

For completeness, we show the growth in investor loans by lender, despite the APRA speed limit is now removed. Macquarie holds the prize for portfolio growth. Investor loan growth has slowed to a crawl.

Finally, we can estimate the relative growth of the banks and non-banks by combining the RBA and APRA data. It is approximate, but clear the non-banks are growing their portfolios faster than the ADI’s because although they have the same responsible lending rules, they are not constrained by APRA’s capital rules.

It is clear the non-banks, growing on an annualized 16.9% basis for owner occupied loans and 3.06% for investment loans are taking up the slack. But this should be a warning to regulators, as risks here are rising, as households who fail the stricter bank underwriting standards turn to the non-banks; even if they have to pay a higher rate of interest!

APRA needs to wake up, on this one. In fact the story is one of loan flow being deflected away from the big four, to some smaller banks, and non-banks. It will be interesting to see if the Royal Commission report changes the game when it is released.

Non Banks Out-Lending The Banks In Terms Of Mortgage Book Growth

APRA belatedly released their monthly banking statistics to the end of November today. Only a couple of days after the month end, but then who’s counting… (I am!!)

These statistics give us the monthly stock of assets and liabilities by the banks, and as normal we will focus in on the residential mortgage section of the data. We can of course compare this data with that from the RBA, which did come out on the last working day of December, and which we already discussed. See The Debt Machine Is Alive And Well

According to APRA, the original mortgage loan portfolios for the banks rose by 0.344%, or $5.69 billion over the month to a new record of $1.664 trillion dollars. Within that, owner occupied loans rose by 0.5% or $5.5 billion dollars to $1.1 trillion dollars, while loans for property investment rose 0.034%, or $188 million to $557.6 billion. 33.52% of all loans are for investment purposes, and this continues to slide, given the new market conditions.

The monthly trend tracker highlights that owner occupied loans are growing significantly faster than investment loans.

Looking at the monthly portfolio movements among the banks, we see that among the big four, Westpac and ANZ saw a significant fall in the value of their investment loan portfolio, while CBA and NAB grew theirs. Macquarie continues to stand out as a lender writing a significant share of investment loans. CBA wrote the largest share of owner occupied loans, and we also see ING also focussing on owner occupied loans.

Overall, the banks portfolios are only moving at the margin, with CBA maintaining its position as the largest owner occupied lender, and Westpac the largest investor lender.

One other interesting (if obsolete) view is the relative growth in investor lending over the past 12 months. This was a focus of APRA but of course is now not being actively used as a control tool. Nevertheless, the data shows that AMP and Macquarie stand out with the largest portfolio growth, to November, while some of the majors are now in negative territory, including ANZ and CBA. Bendigo and Adelaide Bank are writing a greater relative share than the majors now. The market average across the year (sum of the monthly movements now stands at 1.14%. What a difference from a couple of years ago, APRA’s macroprudential intervention has certainly had an effect, despite being several years too late!).

One final data point, we can estimate the relative share of non-bank lending by comparing the RBA data and the APRA data. As discussed before this is tricky, given the delays in the non-bank data, and the fact that not all the non-banks are included in the dataset. That said, we can use the DFA tracker to show the relative movement between the banks and non-banks.

This makes interesting reading, and underscores that fact that the non-banks have been growing faster than the ADI’s in recent times. Non-Bank owner occupied annual lending is running at around 15.6% compared with a year ago, while investor lending grew around 1.9%. This compares with the market average from the RBA of 0.9% for investor lending and 6.4% for owner occupied lending. Its fair to conclude therefore than non-banks are lending like fury, compared with the ADI’s, a symptom of easy non-bank funding, different capital requirements, and a greater willingness to lead.

This is a sure sign of more trouble ahead, as we know that some borrowers rejected by the banks, because of their not meeting the tighter lending standards now in force are being swept up by the non-banks, where they often will pay a higher mortgage rate! This is something I discussed with Tony Locantro in our recent video – from first hand experience!.

The Credit Impulse Weakens Further In October

The RBA and APRA both released their statistics today to end of October. The data clearly shows the mortgage flows are easing, which is a key indicator of weaker home prices ahead. Remember it is the RATE of credit growth, or the credit impulse we need to watch. Essentially, for home prices to rise, the rate of credit growth needs to accelerate, and the reverse is also true as can be clearly seen.

The RBA credit aggregates   shows that overall credit rose by 0.4% last month, or 4.6% over the past year. Housing credit rose by 0.3% in October, or 5.1% over the past year. Business credit rose 4.7% over the past year and 0.6% in October. Personal credit fell 1.6% over the year, and broad money rose by 1.9%, compared with 6.8% last year – the credit impulse is easing!

Total housing lending rose by 0.28% to $1.78 trillion. Within that owner occupied lending rose 0.42% or $5 billion to $1.2 trillion while investment lending rose by just 0.1% to $593.6 billion.  Investment loans fell to 33% of all loans, down from 38.6% in 2015.

Business lending was 32.7% of all lending, lower than 2015.

The monthly flows continue to show significant noise…

… but the annualised figures show the fall in housing lending across the board.

Turning to the APRA banking stats, we can look at individual lender portfolios.  We see that Westpac and ANZ both reduced their investor loan portfolios between September and October, while NAB and CBA grew theirs.

Macquarie Bank is still growing its investor pools (well above the now obsolete APRA 10% speed limit).

ADI portfolios hardly moved overall with CBA still the largest owner occupied lending, and Westpac the largest investment lender.

We can still plot the annualised movements of investor loans, and we see a small number of lenders well above the 10% speed limit (which was removed a few months ago). Significantly many lenders are well below that rate.

At an aggregate level, lending by ADIs was up 0.3% in the month, with investor loans flat, and owner occupied loans at 0.46%.

The proportion of investor loans fell again in stock terms to 33.6%.

Total ADI lending rose to $1.66 trillion, up 0.3% of $5 billion. Owner occupied loans rose 0.46% to $1.1 trillion and investor loans rose 0.004% to $557.4 billion.

In fact some smaller banks, and non-banks are growing their portfolio faster than the majors, thus the rotation across the sectors continues.

We expect credit to continue to grow more slowly ahead, and this will lead home prices lower.


Home Lending Momentum Eases In Sept 2018

APRA released their monthly banking statistics for September 2018. This includes the total balances by ADI broken by investor and owner occupied lending.  Total lending grew by 0.21% in the month to a total of $1.65 trillion, or 2.5% annualised. Within that lending for owner occupation rose by 0.36% to $1.09 trillion and investor loans fell 0.03% to $557.4 billion.

Investment loans now comprise 33.72% or the portfolio.

Looking at the individual major players, we see that only NAB grew their investment loan portfolio in the month, among the big four.  Macquarie and Bendigo are lifting investor loans the most by value. ANZ dropped their balances the most.

This had little impact on overall market shares.

And the investor loan portfolio at the market level grew 1.35%.

We will look at the RBA aggregates in a separate post, but investor lending momentum continues to drift lower. Its surprising the owner occupied lending remains so strong, but that may change ahead.


ADI Mortgage Lending Accelerates In August 2018

APRA has released their latest banking stats to end August 2018.  Total lending for residential homes rose by 0.33% in the month to a total of $1.65 trillion. Another record. That would be an annual rate of 3.9% if repeated each month, a little lower, but still nearly twice wages growth, so household debt is STILL climbing.

Within that lending for owner occupation rose 0.48% to $1.09 trillion and lending for investment purposes rose 0.03% to $557.6 billion (last month it dropped by 0.02%). 33.8% of loans are for investment purposes.

Looking at the portfolio movements, NAB, CBA, Bendigo, HSBC and Macquarie reported a lift in investor loan balances. Westpac and ANZ reported a fall.  ME Bank appears to be losing relative share on both fronts.

The market share of the major players hardly moved, with CBA the largest owner occupied lender and Westpac still holding the largest portfolio of investment loans.

Whilst officially the 10% speed limit on investor loans has been sidelined, it is worth observing that over the past year, Macquarie, AMP and some of the smaller players are running way ahead of the market rate of growth.

The RBA will post their aggregates later this morning, and we will then have a market view – and we can impute the non-bank lender share which we expect to be higher again.

But for now it is worth highlighting that despite all the grizzles from the property spruikers, mortgage lending is STILL growing…. and faster than inflation. We have not tamed the debt beast so far, despite failing home prices.  No justification to ease lending standards – none.

The Federal budget status moving towards a technical surplus earlier (remember this is new debt, not the total outstanding debt…) may take the risk premium on Australia down a tad, but I still expect higher mortgage rates ahead – not least as the banks struggle to fund the fallout from the various legal claims and penalties which are being, and will be imposed; to say nothing of higher international funding costs.

Investment Lending Crashes

APRA has released their monthly banking stats to the end of July 2018 today. As expected from our survey data, gross investment mortgage lending balances fell last month. Expect more ahead.

Total loans outstanding for all residential property – owner occupied and investment rose by 0.24% to $1.64 trillion, which would be an annual rate of 2.9%.  Within that lending for owner occupation rose by 0.38% to $1.09 trillion while lending for investment loans fell 0.25% to $557.4 billion.  As a result the proportion of loans for investment purposes fell to 33.9%, the lowest for years.

The monthly movements underscore the changes, (and remember the August 2017 drop was a blip created by loan reclassification at CBA from their residential books).

The monthly portfolio movements by lender really tell the story, with investor loan balances at Westpac, CBA and ANZ all falling, while NAB grew just a tad. Macquarie, HSBC. Bendigo Bank and Bank of Queensland grew their books, highlighting a shift towards some of the smaller lenders. Suncorp balances fell a little too.

The overall portfolios by lender continue to show CBA the largest owner occupied lender, and Westpac the largest investor lender.

Analysis of the 12 month portfolio movements also reveals the some of the smaller players, and Macquarie have grown their portfolios faster than the majors, and Westpac had the strongest growth among the big four. Market growth continues to fall, at 0.85%.

The tighter credit conditions are now biting – finally – which explains the recent spate of ultra-low rates on offer to lower risk new borrowers and those seeking to refinance who fall within the new criteria. But many are excluded, prisoners of higher rates as they do not fall within these now tighter (and rightly so) guidelines.

There will be howls of pain from the sector and calls to relax lending standards to “save” the economy, but these must be resisted at all costs. We must not return to the over lax lending of past days as this will simply build even bigger risks later. Time I fear to face the music.

Anyone now game enough to forecast a rise in home prices? I suspect not. We will see what the RBA data tells us about the non-bank sector, their data just came out. We will post on this soon….

I will be watching for a slowing in owner occupied growth, as confidence and sentiment ebbs away.

Housing Reaches Another Record

We review the latest lending statistics

Please consider supporting our work via Patreon

Please share this post to help to spread the word about the state of things….

Economics and Markets
Housing Reaches Another Record


Loading


/

ADI Housing Credit Still Higher In June 2018

The latest data from APRA, the monthly banking stats to June 2018 show that the banks are still busy lending for home loans. Total balances rose in the month by $9.2 billion, to $1.64 trillion. Within that lending for owner occupied housing rose $7.1 billion, up 0.68% to $1.08 trillion and lending for investment property rose 0.38% to $558 billion. Investment lending comprised 34% of the portfolio, and fell slightly as a result.

The trend growth, over the months is accelerating.  Total credit is still growing at an annualised rate of 6.7%, scary, when incomes and cpi are circa 2% and we have some of the highest debt to income ratios globally.

Looking at the individual lenders portfolio movements, we see that Westpac have been focusing on owner occupied lending growth, while their investor balances fell a little, a similar pattern to the ANZ. On the other hand, both CBA and NAB grew their investor loan books, having given up share in recent months. But Macquarie bank lifted their investor loan book significantly.

Overall shares did not move that much in the month, with CBA still the largest owner occupied lender, and Westpac the largest investment loan lender.

We also updated our annual portfolio movements for investor lending (despite the APRA 10% speed limit no longer being relevant). We see that Macquarie shows the strongest growth in investor lending, alongside AMP Bank, and some of the smaller players. The market annual effective growth rate is 0.96%. ANZ and CBA are in negative territory across the last 12 months.

So in summary, home lending is alive and well, which given the current falls in home prices is a concern – but many households are refinancing to lower cost loans, taking advantage of the  wide range of deals out there, for some. But investment lending remains in the doldrums, if a little off its lows.

Clearly the regulators are betting that income growth will snap back up, allowing for households to service their massive debt burden, but as prices fall for the straight 10th month, and all else being equal its hard to see an easy way out from the debt bomb, as rates rise in the months ahead.

Mortgage Credit Growth Accelerates In May

APRA has released their monthly banking statistics to end May 2018. After last months drop, we were waiting to see whether the loosening announced by APRA would show up, and yes,  this month there was a rise in both the growth of owner occupied and investment lending!

Total portfolio balances rose by 0.38% to $1.63 trillion, which would translate to be a 4.6% annualised growth rate, well above inflation and wages growth if this rate continued. Thus household debt still grows ever larger (a ratio of 188.6 household debt to income according to the RBA, last December), despite being at record and risky levels.

Within that, owner occupied loans rose 0.52% in the month to $1.08 trillion, up $5.5 billion while investment lending rose just 0.13% to $555 billion, up $712 million.  Or in annualised terms, owner occupied loans are growing at 6.2% while investment loans are growing at 1.5%.  Investment loans now make up 34.06% of all loans, which is still very high but falling.

Turning to the individual lenders, there is little to be seen at the total portfolio level, with CBA leading the owner occupied lending, and Westpac the investment side of the ledger.

However, the individual portfolios within the lenders are more interesting, with Westpac still leading the way in investment lending portfolio growth, alongside Macquarie and NAB. However CBA and ANZ both saw their investor portfolio balances fall, while still expanding their owner occupied portfolios. Bank of Queensland dropped their balances in both owner occupied and investment lending this month.  Clearly different strategies are in play.

Later we will get the RBA numbers, and we will see what the total market trends look like. We suspect non-banks will be growing faster than ADIs.

But overall, this appears to show a willingness to continue to let debt run higher to support home prices, so we are still on the same debt exposed path, should interest rates rise further, as is likely, as we discussed recently.  Sound of can being kicked down the road once again!