ADI’s Housing Loans Now At $1.43 trillion

The latest data from APRA, the monthly banking stats to February 2016 shows lending portfolios held by the banks for housing was $1,432 billion. The gap between this figure and the RBA reported figure – $109.4 billion,  is the non-bank sector, which represents a 1.38% rise (up $1.49 billion) compared with last month. So one important observation is the non-bank sector is now growing their mortgage loan books faster than the banks.

Looking at the ADI specific data, 63.8% of loans on book are for owner occupation, which is now at $913 billion, up $6.8 billion, or  0.75% from last month, whist the rest is for investment loan purposes, and this was up 0.06% or $340m to $519 billion.

We still of course have noise in the numbers thanks to the ongoing restatements, (RBA says $1.9 billion was restated in February).

But looking at the detail, CBA holds first place for owner occupied loans, and WBC for investment loans.

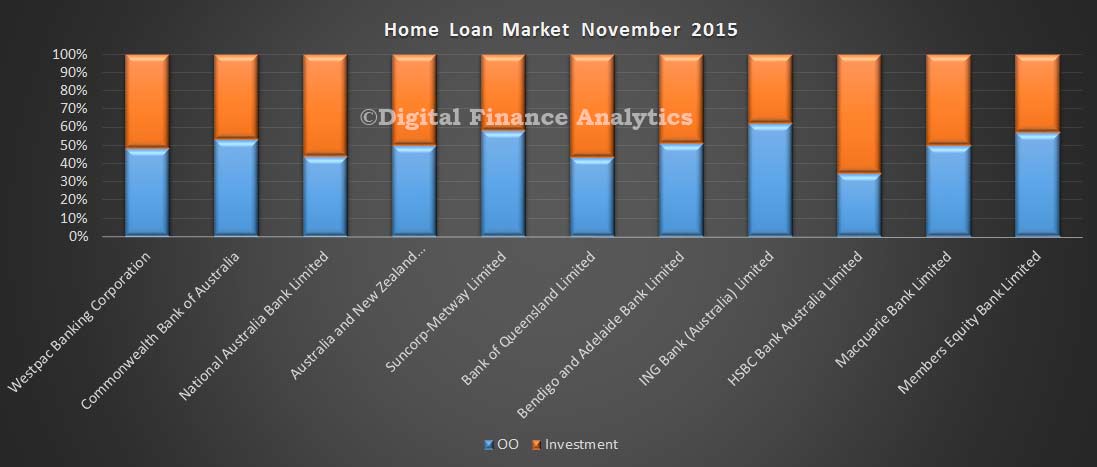
Lonn-Mix-Feb-2016-NewThe mix of loans between owner occupied and investment loans shows that Bank of Queensland and Westpac have the largest relative proportion of investment loans.
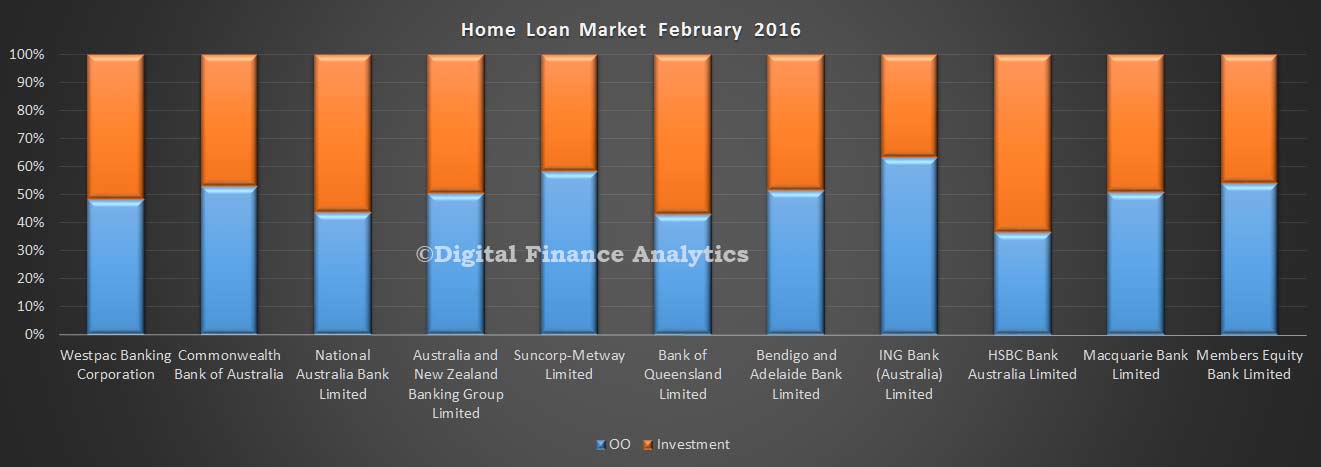
Loan-Mix-Feb-2016Looking at the portfolio movements in real terms, NAB grew their investment loan book faster than their owner occupied loans. The other three large players all focused on owner occupation loan growth, and this is largely related to loan refinancing.

Loan-POrt-Movements-Feb-2016Looking at the 12 month loan growth data by bank, using the APRA baseline, and incorporating adjustments where possible, annual growth rate at a system level for investment loans is now sitting at below 2%. All the big players are below the 10% speed limit now, though some smaller players may be getting some attention from the regulator.
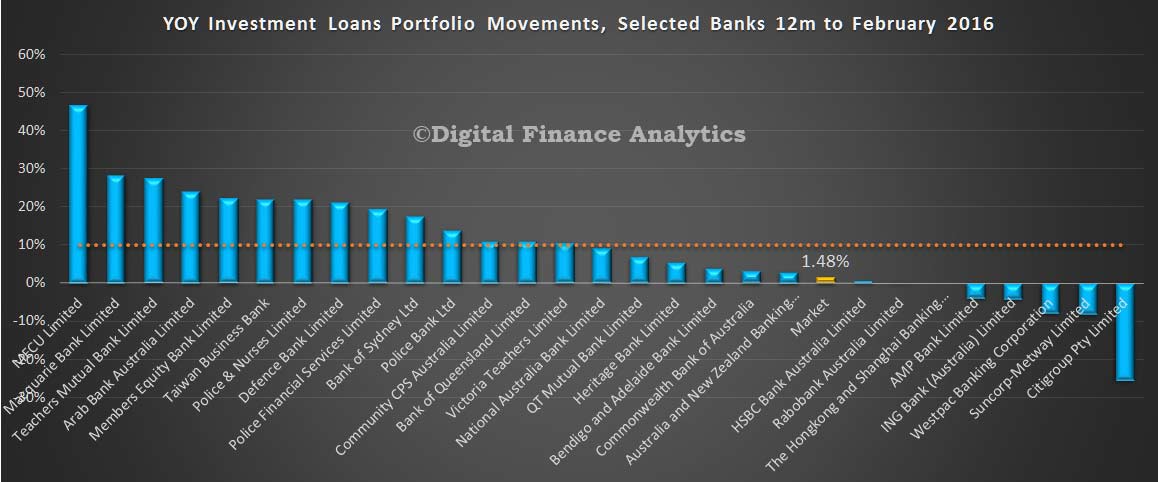
INV-Loan-Growth-12m-Feb-2016On the other hand, growth in the owner occupied portfolios continues a pace, with a estimated average over 12 months of more than 12%. This is high, when compared to average income growth or inflation.
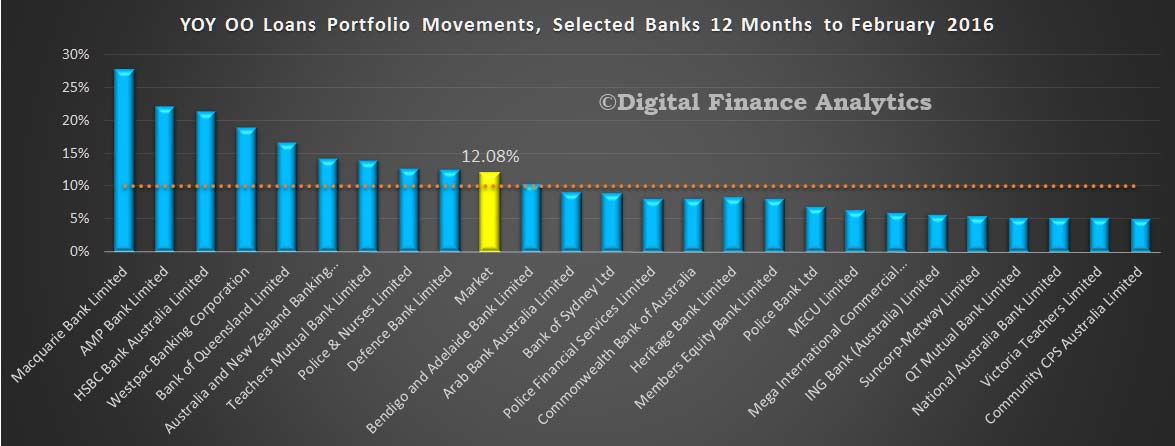
OO-12m-Loan-Growth   Looking at deposits, total balances rose by 0.33% in the month, by $6.4 billion, reaching $1.92 trillion. There was little change in the relative share in the month.
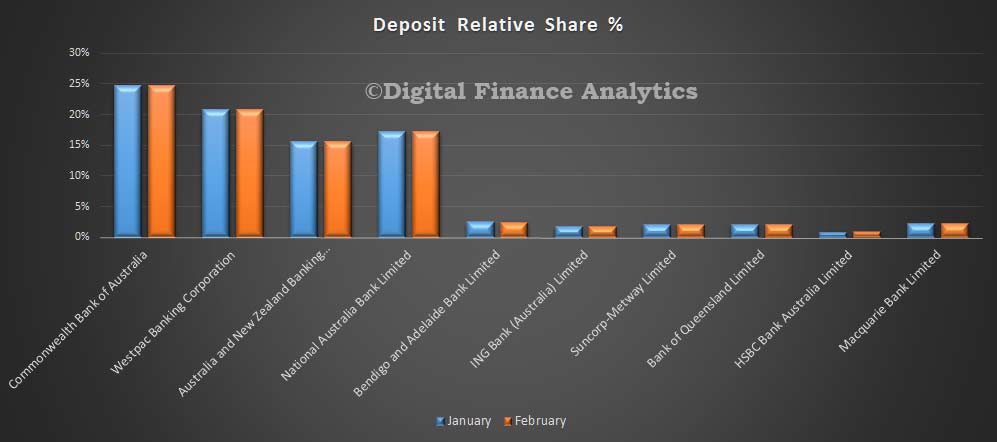
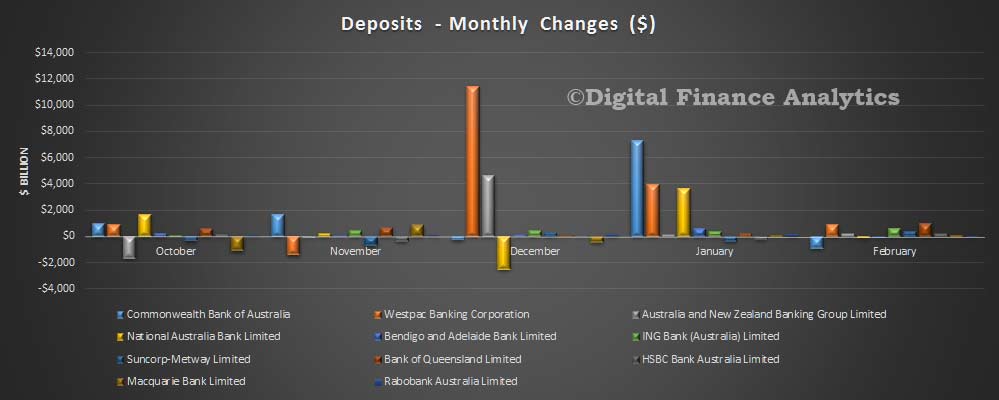
Deposits-Share-Feb-2016This is confirmed by looking at the value of movements month on month.
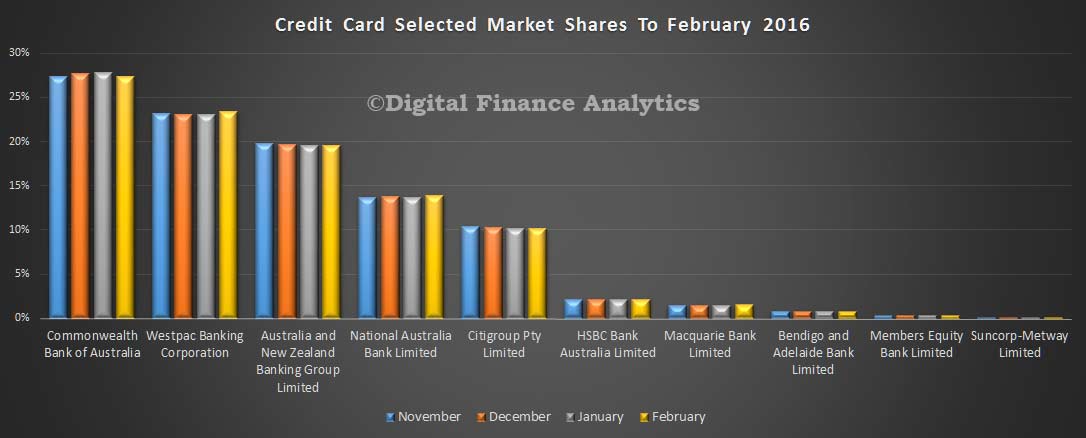
Deposits-Movements-Feb-2016Finally, credit card balances rose by $382 million to $41.8 billion. There was little change in portfolios, with CBA holding more than 27% of the market.
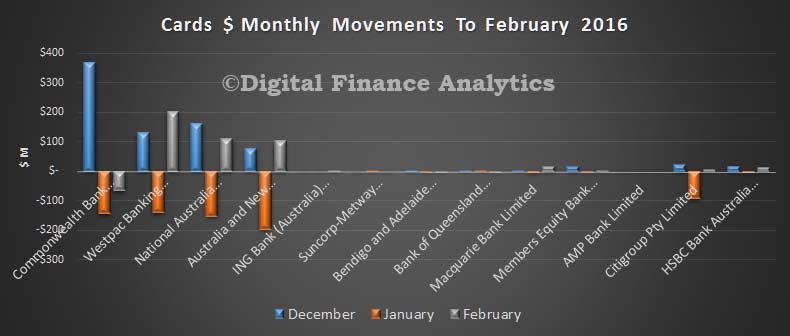
Cards-Share-Feb-2016The monthly movements highlight the ipact of Christmas spending, and the January repayments. WBC saw the largest lift in balances in the month.

Cards-Movements-Feb-2016

Housing Lending Finance Takes a Tumble

The latest data from the ABS on housing finance to January 2016 shows that the total value of dwelling commitments excluding alterations and additions (trend) fell 0.6% in January 2016 compared with December 2015. $32.4 bn of loans were written, with loans for owner occupation worth $21.2bn (down 0.1%)  and investment loans $11.2bn down 1.6%. The number of refinancing commitments for owner occupied housing (trend) rose 1.7% in January 2016, following a rise of 2.0% in December 2015.  Banks are fighting for refinance market share. We think that tighter lending standards are biting, this is reflected in a rise in the number of households who are having problems getting the loan they want. One in ten are having difficulties.

OO-Loans-Jan-2016-ABSThe total value of owner occupied housing commitments (trend) fell (down $19m, 0.1%) in January 2016. A fall was recorded in commitments for the purchase of established dwellings (down $46m, 0.3%) while rises were recorded in commitments for the construction of dwellings (up $19m, 1.0%) and commitments for the purchase of new dwellings (up $8m, 0.6%).

Per-Change-OO-Jan-2016-ABSThe number of owner occupied housing commitments (trend) rose 0.4% in January 2016, following a rise of 0.6% in December 2015. Rises were recorded in commitments for the refinancing of established dwellings (up $346m, 1.7%), commitments for the purchase of new dwellings (up $37m, 1.2%) and commitments for the construction of dwellings (up $31m, 0.5%), while a fall was recorded in commitments for the purchase of established dwellings excluding refinancing (down $188m, 0.7%).

The total value of investment housing commitments (trend) fell (down $186m, 1.6%) in January 2016 compared with December 2015. Falls were recorded in commitments for the purchase of dwellings by others for rent or resale (down $23m, 1.9%) and commitments for the purchase of dwellings by individuals for rent or resale (down $178m, 1.9%), while a rise was recorded in commitments for the construction of dwellings for rent or resale (up $15m, 1.7%).

OO-and-INV-Flows-Jan-2016-ABSBetween December 2015 and January 2016, the number of owner occupied housing commitments (trend) rose in Queensland (up $146m, 1.4%), Victoria (up $128m, 0.8%), New South Wales (up $23m, 0.1%), Tasmania (up $15m, 1.7%), the Australian Capital Territory (up $13m, 1.2%) and the Northern Territory (up $4m, 1.2%), while falls were recorded in South Australia (down $6m, 0.2%) and Western Australia (down $15m, 0.2%).

State-PC-OO-Jan-2016-ABSIn original terms, the number of first home buyer commitments as a percentage of total owner occupied housing finance commitments remain unchanged at 15.1% in January 2016 from December 2015. However, the number of loans fell from 9,357 to 6,669 in the month. Between December 2015 and January 2016, the average loan size for first home buyers fell $-9,300 to $338,800. The average loan size for all owner occupied housing commitments fell $-5,400 to $372,400 for the same period.
FTB-Trends-Jan-2016-ABSThe number of first time buyers going direct to the investment market fell 3%, but remains elevated compared with previous years. These transactions are based on our survey data and are not counted in the ABS FTB OO data.

All-FTB-DFA-Jan-2016 At the end of January 2016, the value of outstanding housing loans financed by Authorised Deposit-taking Institutions (ADIs) was $1,466b, up $8b (0.5%) from the December 2015 closing balance. Owner occupied housing loan outstandings financed by ADIs rose $8b (0.8%) to $939b and investment housing loan outstandings financed by ADIs was flat at $528b. Overall 36% of loans are for investment housing purposes.

ADI-Loan-Stovck-Jan-2016-ABS

ADI Housing OO Loans Grew 0.9% In January

The APRA Monthly banking statistics for January 2016 came out today. Whilst overall ADI lending for housing grew 0.6%, lending for owner occupation grew 0.9%, from $898 bn in December to $906 billion in January. Much of this will be refinancing of existing loans, and some first time buyer activity. Investment lending grew very slightly. However, there was a $1.4 bn adjustment between OO and investment loans, so the splits are not that reliable. So, whilst lending may be slowing a little, there was significant momentum in the market in January.  Total lending reached $1,424 bn, up by $8.1 bn.

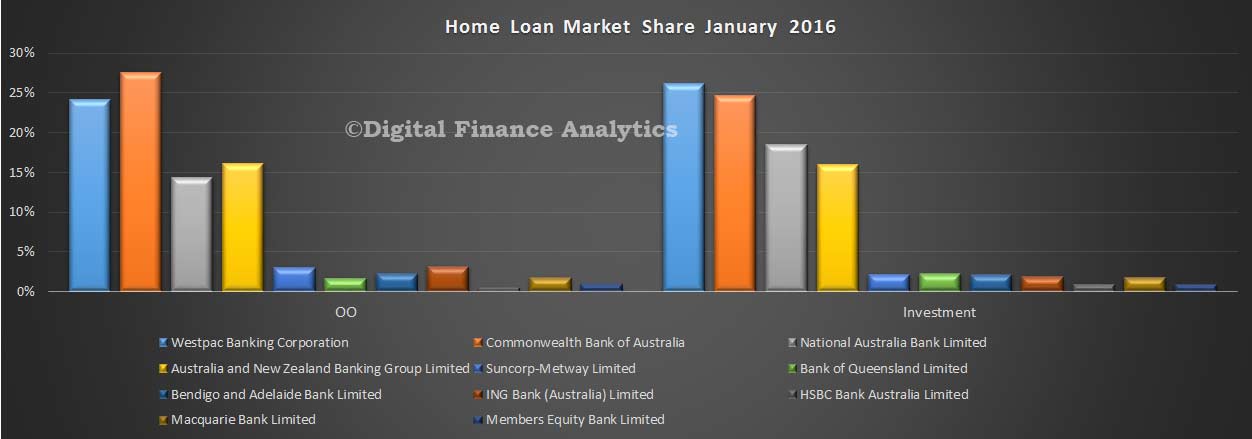
Looking at the individual banks, the market shares did not change that much, with CBA holding 27.6% of owner occupied loans, whilst Westpac holds 26.13% of investment loans.

APRA-Market-Shares-Home-Loans-Jan-2016The portfolio movements (which are not adjusted for reclassifications between OO and investment loans) highlights growth in OO loans across the board. Movements in investment loans is more patchy.

APRA-Home-Lending-Portfolio-Moves-Jan-2016For what it is worth (and we have consistently used the monthly data, adjusted where we can), we see that market growth in investment loans is now sitting at 2.14%, for the 12 months to January 2016. The big four are all below the APRA 10% speed limit. Others, for various reasons are still speeding.

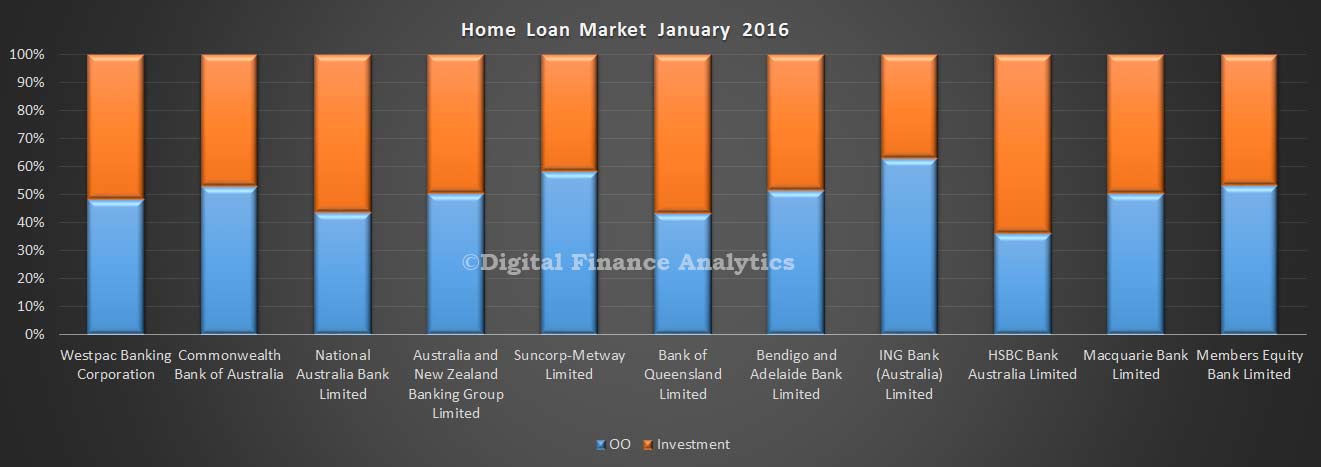
12M-Growth-Derived-Jan-2016The splits between OO and investment lending varies by lender, with HSBC, Bank of Queensland and NAB holding the larger proportion of investment loans, expressed as relative market shares.

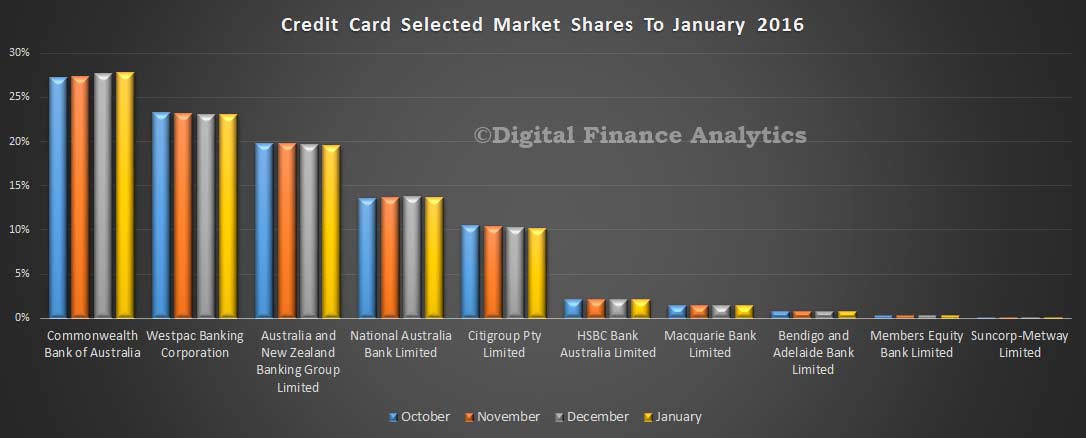
APRA-Home-Loan-SharesTuning to credit cards, total balances fell $747m in the month, to $41 billion. CBA is growing its relative share of cards, with 27.8% of the market.  NAB also grew slightly in relative terms, whilst ANZ and WBC fell a little.

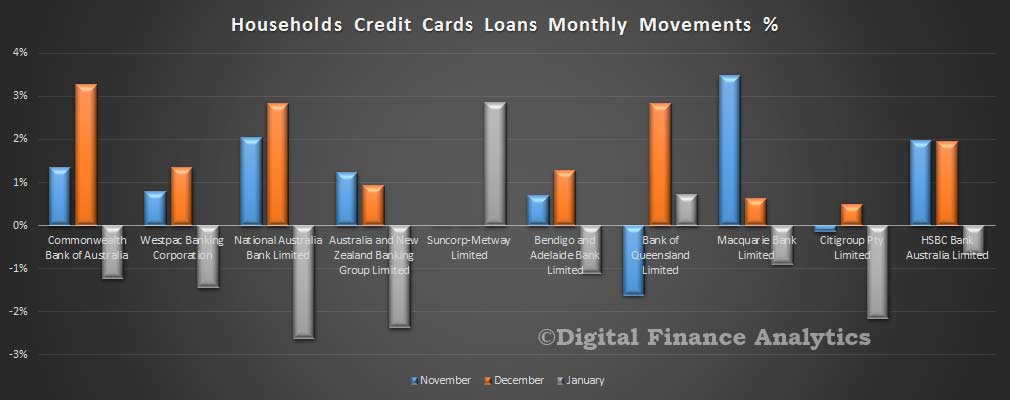
APRA-Cards-Shares-Jan-2016Looking at the monthly movements, we see that households are paying down loans they took over the Christmas.

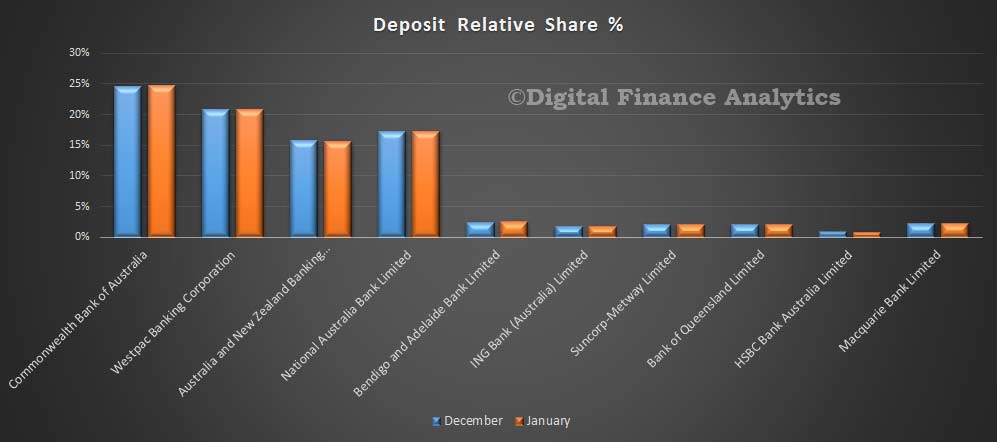
APRA-Cards-Monthly-Movements-Jan-2016Turning to deposits, total deposits grew 0.8% to $1.92 trillion. CBA grew its share a little, from 24.6% to 24.8% and remains the largest holder of deposits in Australia.

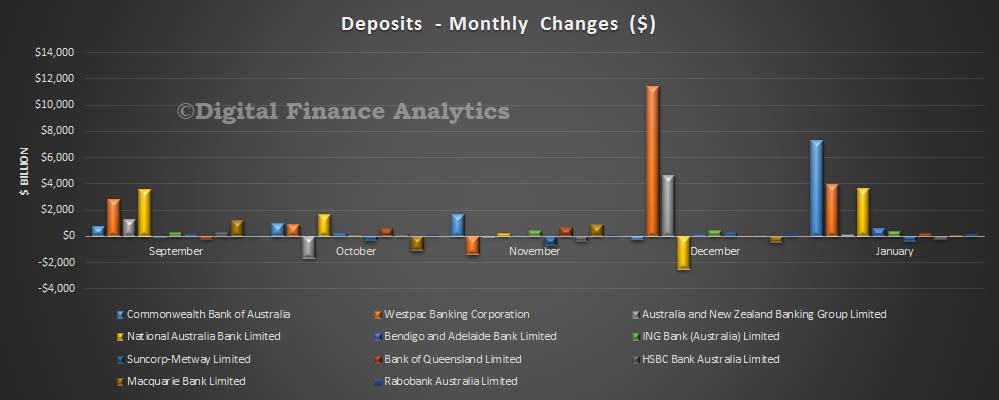
APRA-Deposits-Jan-2016-Share ANZ lost a little share in the month as it attracted less money in than the other three majors. CBA lifted net balances by $7.3 bn, compared with WBC’s $3.9 bn and NAB’s 3.6 bn.


APRA-Deposits-Monthly-Change-Jan-2016   Given the higher margins on overseas funding at the moment, with speads elevated thanks to a range of global uncertainties, local deposits are more valuable, and we expect to see some strong competition for balances in the months ahead.

OO Housing Finance Bounces Back – Refinance Anyone?

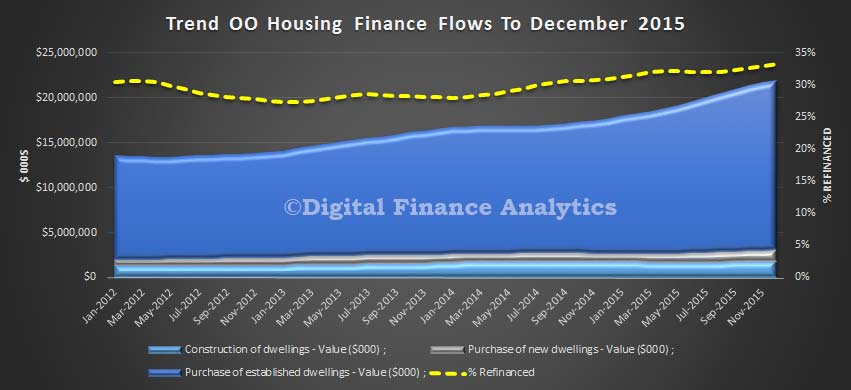
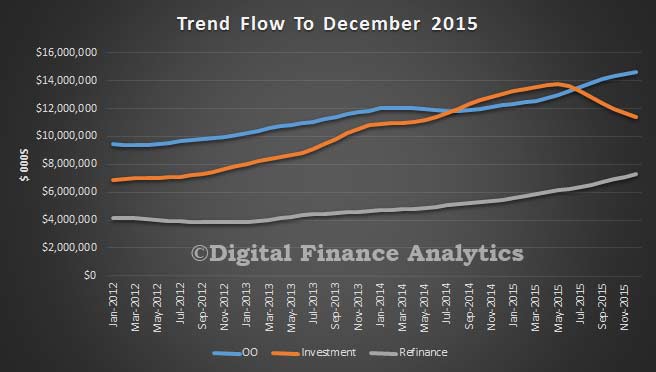
The latest ABS data to December 2015 shows that in the month, trend owner occupied lending grew 1.3%, seasonally adjusted, with $21.3 bn of loans being written.  Construction loans grew 1.4% ($1.9 bn), purchase of new dwellings grew 1.7% ($1.3bn) and purchase of established dwellings by 1.28% ($18.75bn). Refinance continued to grow, with 33% of loans written in the month churned, up 2.3% to $7.29bn.  Overall owner occupied lending, net of refinance grew just 0.8%.

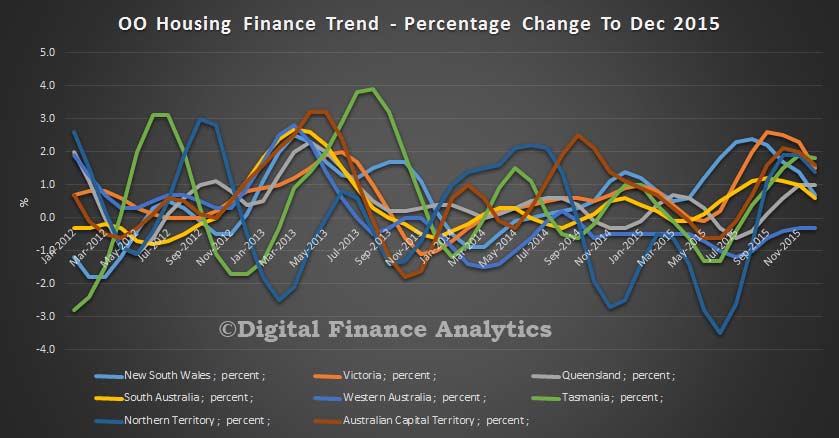
OO-Trends-Dec-2015Looking at state trends, VIC led the way, up 1.5%, QLD at 1%, NSW at 0.7%, SA 0.6%, and WA down 0.3%. But startlingly, TAS reported a rise of 1.8% and NT a rise of 1.4%. The ACT was 1.6% higher. So, WA apart, owner occupied lending grew in every state.

State-Trend-Change-Dec-2015Total finance, including investment loans grew by just 0.025%, investment loans fell 2.36% to 11.4 bn. We see the clear focus of lending is to owner occupied borrowers, and a massive focus on churning loans. We also see a significant rise in the number of fixed rate deals, as households lock in low rates, with the number of deals up 17.2%, whilst secured revolving loans fell 9.8%. This reflects the cheap loan special offers which are currently in the market.

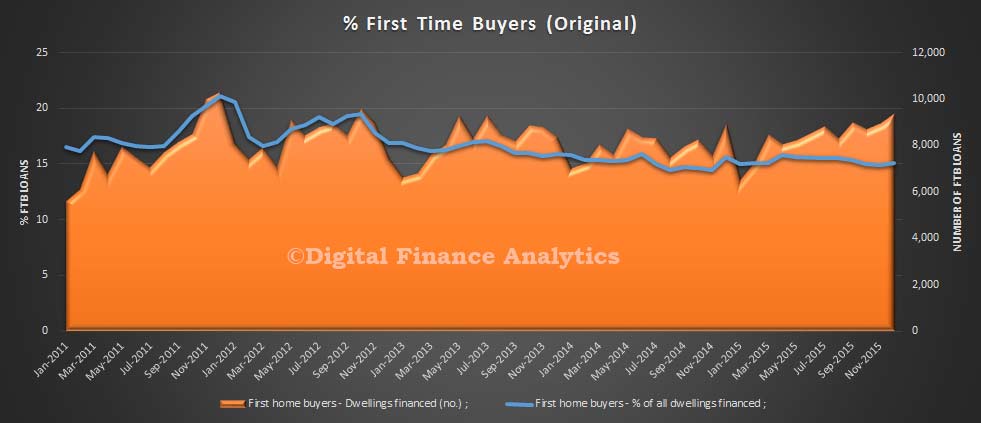
Trend-Flow-Dec-2015First time buyer OO loans grew in December, with a rise of 4.6% on the previous month to make up 15.1% of new loans. This is faster than for non-first time buyer loans, here the number of loans grew 3.1%. The average loan size fell a little in the month, reflecting tighter lending criteria. This is original data, not trend smoothed.

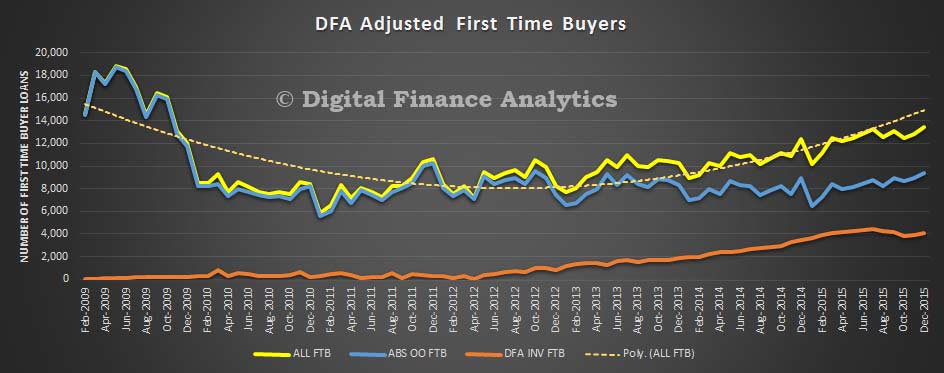
FTB-Orignal-Dec-2015Overlaying first time investors, from our surveys, overall first time buyers were more active, still wanting to get on the property ladder one way or the other. FTB investors grew by 6.5% in the month, after a couple of slow months before. Overall, about 14,000 first time buyer deals were done.

FTB-All-Dec-2015

Owner Occupied Home Lending Drives ADI’s

The latest data from APRA, the monthly banking stats to December, provide data on the stock of loans and deposits held by the banks. Total housing loans on book were $1.42 trillion, up 0.7% from last month. Within the mix, owner occupied loans grew 1% ($898 bn) and investment loans by 0.17% ($518 bn). There were no declared adjustments between owner occupied and investment loans this month (first clear result for several months).  Investment loans were 36.6% of book, still a big number.

The balance between $1.42 trillion and $1.52 trillion as reported today by the RBA relates to the non-bank sector.

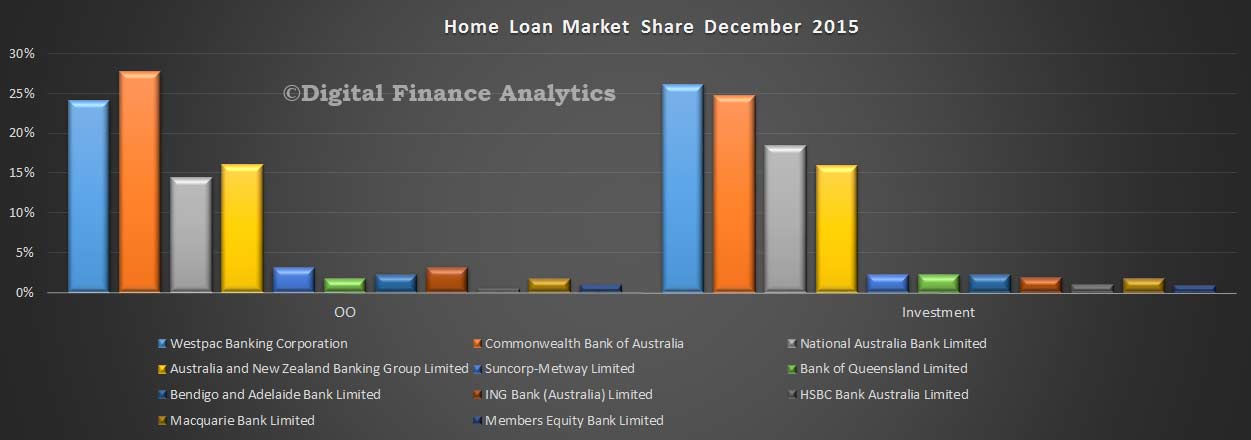
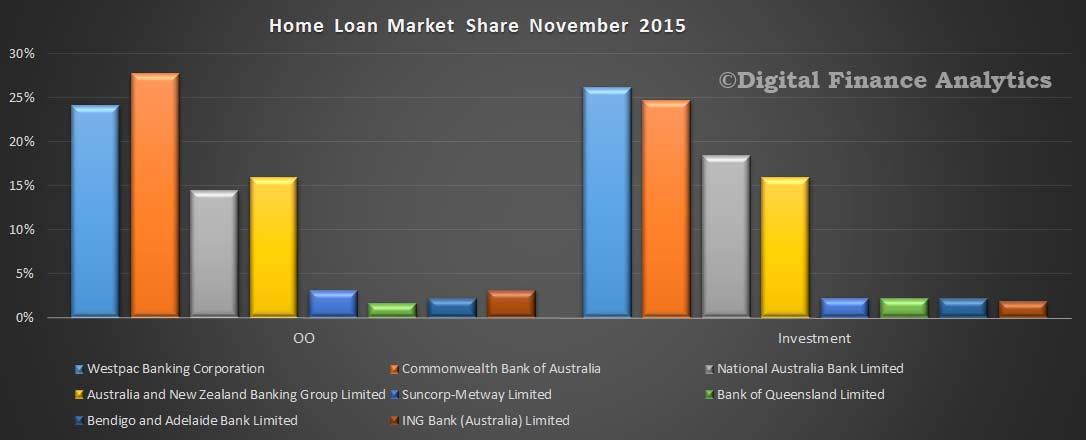
Looking at the individual lenders portfolios, CBA still has the largest owner occupied share, and Westpac the biggest share of investment loans.

Home-Loans-Dec-2015

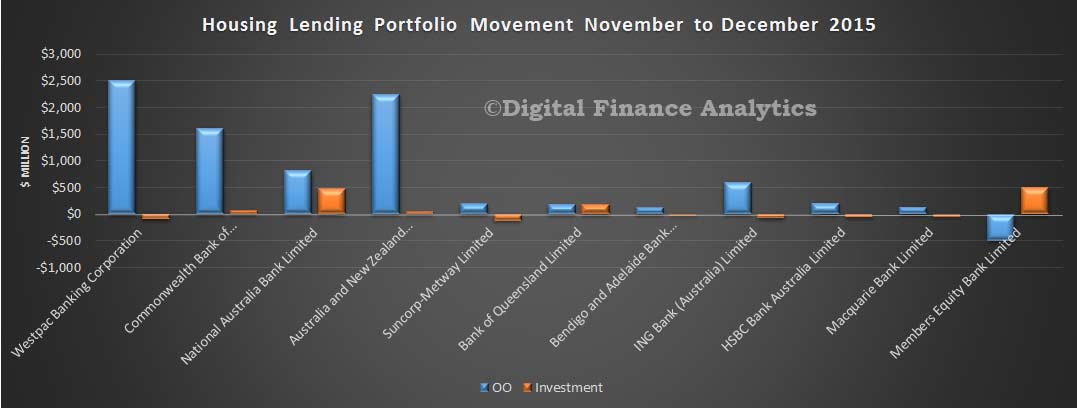
The main movements were in the owner occupied stream, with all the main lenders growing their footprint, other than Members Equity Bank who grew their investment loans.  Among the majors, NAB made (net) most investment loans.

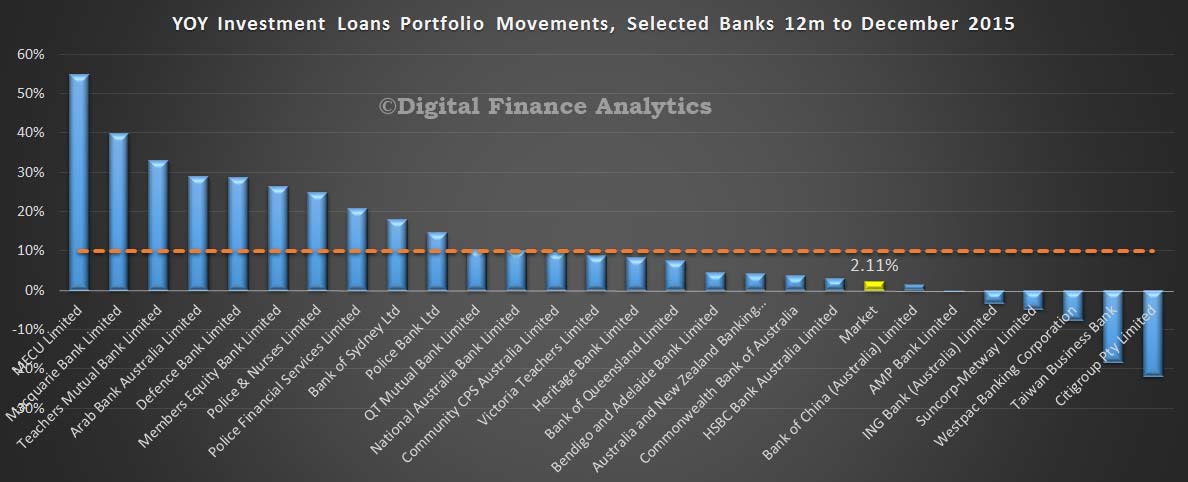
Home-Loan-Movements-Dec-2015If we look at the 12 month portfolio movements by bank, we see that the investment loans market since January has now settled at 2.1% (after all the various tweaks and adjustments). This is below the APRA 10% speed limit. Now most of the major lenders are at or below the 10% hurdle, through a number of other players are still well above. Some, like Macquarie are explained by acquisitions, others by relative lending growth alone.

Home-Loan-12M-Inv-Movements-Dec-2015

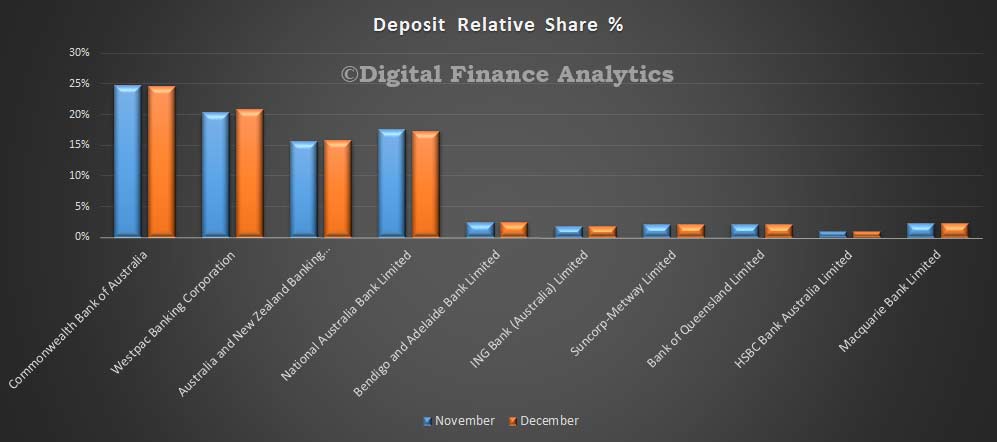
Turning to deposits, we see CBA still is the largest savings bank in Australia, though Westpac has been growing share, at the expense of NAB. Total deposits were $1.9 trillion, up $11 bn in the month – or 0.62%.  This is a larger rise than the previous two months.

Deposits-Dec-2015

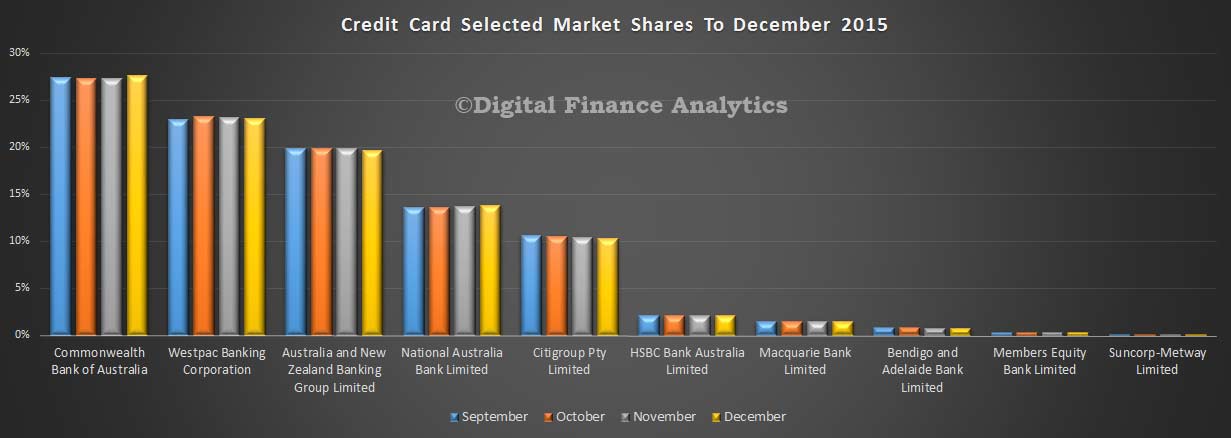
Looking at the cards portfolio, total balances were up slightly (thanks to Christmas) by $832 m to $42.2 bn. CBA lifted their share of cards balances, and they remain the largest cards player, followed by Westpac and ANZ Bank. We expect balances to fall in January as households repay their festive bloat.

Cards-Dec-2015

Home Lending Up in December 2015 to $1.52 trillion

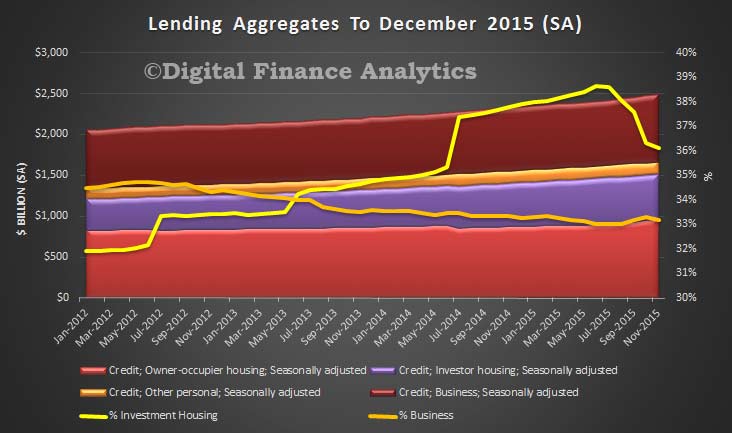
The RBA Credit Aggregates for December, released today, shows a continued rise in lending for housing, up 0.7% in the past month seasonally adjusted by $10.6 bn to $1.52 trillion. This includes all lending, including non-banks, seasonally adjusted. There are no reported series breaks this past month, so no abnormal shifts between investment and owner occupied loans . This is a rise of 7.1% over the past year.

RBA-Dec-2015The splits between owner occupied and investment lending shows that loans for owner occupation rose $10 bn, up 1.1%, to $967.7 billion. Loans for investment purposes also rose – just 0.09% or $0.49 billion to $546 billion, so investors are still in the market. The proportion of loans on book relating to investment lending has fallen again, to 36.1% from a high of 38.6% last year. This is still a big number, and higher that the levels which were thought to be a concern (as expressed by the regulators) last year, before recent swapping between categories. Remember the Bank of England is worried by their 16% share of investment loans – in Australia it is much higher!

Personal credit has fallen again, down 0.2% to $148 billion. But lending for business was only up 0.11%, or $0.94 billion to $826 billion. This represents a low 33.2% of all lending, down from 33.3% last month, and down from 34.7% in 2012. This continues to highlight the lack of investment in the grown engine of the economy – business – as compared to the easy money going towards housing. Structurally, we continue to have a problem, as housing growth is not productive and cannot lead to the right economic outcomes. Remember this is with interest rates at rock bottom.

We will review the APRA ADI data later.


Strong Home Lending Continued In November

The latest ABS data, on home lending, released today, continues to confirms the strong growth which was reported in the stock data already released by APRA and RBA. The more granular flow data for November shows that owner occupied lending grew by 1.7% from October to $21.6 billion, whilst investment lending fell 2.9% to $11.6 billion. Refinancing accounted for more than 21% of all loans, whilst investment loans fell to 44.3% of new loans (still a big number, but below the 50% peak we saw in early 2015).

Ref-and-Inv-Flows-PC-Nov-2015-We note that by value, loans for construction rose 1.8% ($1.83 bn), whilst purchase of new dwellings lifted 1.6% ($1.24 bn)  and purchase of existing dwellings rose 1.7% to $18.6 bn.

OO-Houisng-Nov-2015Refinanced loans rose 2.3% to $7.0 billion, and confirms the current focus of lenders trying to get existing borrowers to switch.

All-Housing-Flows-Nov-2015Looking at first time buyers, there was a 3.37% lift in the number of owner occupied borrowers (8,945) but there was a small fall in the relative proportion of borrowers, with first time buyers sitting at 14.9% (down 0.1%). Using data from our surveys, we overlay the first time buyers going direct to the investment sector, we see an additional 3,778 purchasers, down 1.3% from last month. Overall then, first time buyers are still active, despite high prices.

FTB-Nov-2015FTB-Tracker-Nov-2015Turning to the state changes, we see that momentum is slowing in NSW, thanks to falls in investment lending, but VIC is growing still, along with ACT and NT. Growth in QLD and WA is slower down 0.3% and 0.4% respectively.  Looking specifically at new home lending to owner occupiers, most were higher with NSW up 9.7%, VIC 8.2%, QLD 2.3% and SA 6.3%. Significantly though new home lending to owner occupiers was lower in Western Australia down 15.9% and Tasmania down 10.7%.

State-Change-Nov-2015Finally, it is worth noting that we have seen momentum in the wholesale lending sector (up 3.8%), and non-bank sectors (up 0.9%), whilst the banks have seen growth slowing slightly at around 1.8%. Building Societies appears to be performing less well, although there is a small improvement, with a fall of 4.3%.

Lender-Change-Nov-2015 Standing back, momentum across the sector continues, and given that demand for property remains strong (especially in the light of recent stock market volatility) we expect lending to continue to move higher – indeed we have seen a number of lenders reduce their rates for new owner occupied and lending business, in an attempt to gain share.  The property story is far from over, despite some falls in prices.

APRA Data Shows Investment Loans Slowing

The APRA monthly banking statistics to end November show that housing loans by ADI’s (a.k.a banks) rose by 0.8% to $1.41 trillion. This was driven by a 1.19% rise in owner occupied loans ($889 billion) and 0.14% rise in investment loans ($517 billion). As we reported, the RBA said that total loans were worth $1.51 trillion, the difference being the non-bank sector. There is still noise in the data (the RBA said that there was a switch of $1.9bn loans between investment and owner occupied loans in the month). Overall, investment lending is below the 10% speed limit.

Looking at individual banks data, Westpac still holds the highest value of investment loans, whilst CBA is the largest lender of owner occupied loans.

SharesByBanknov2015Looking at the relative splits between owner occupied and investment loans, HSBC, Bank of Queensland and Westpac have the highest proportion of investment loans.

BankSharesNov2015The monthly movements highlight that within the numbers there are still some funnies going on, including reclassification of loans.

MovementsNov2015

Lending Finance Shows NSW Investment Property Momentum Falling

The last piece of the finance data, from the ABS shows lending finance for October 2015. Two things of note (despite the noise in the data, as we have already discussed), first, investment housing lending is on the slide (down 3%), offset by a rise in owner occupied lending (up 2%), so overall lending for housing contained to rise a little. Second lending for business rose (up 1.3%). Investment loans were down to 36% of all housing, and lending for commercial (other than for property investment) rose from 43.8 to 44.2%.

All-Lending-Oct-2015Data for NSW, which is original data (no adjustments for trend or seasonality), showed a 5% rise in construction finance for investors, offset by a 33% fall in investment for existing property.  From this, it looks like the investment property party may just be over.

Oct-2015--NSW-Inv

Latest Housing Finance Data Shows Market Is Turning But Still Rising

The latest data from the ABS on housing finance for October 2015, continues to tell the story of the turning market, with investors slowing, and owner occupied loans still rising (and supported by growth in refinanced loans). It also contains a number of adjustments, so trends are hard to read.  But, do not be deceived, the market still has significant momentum, and overall volumes and values are still high.

Looking at the national monthly trend flows first, we see that in October total housing loans of $33.2 bn were written, up 0.04% from the previous month, or $12.9m. Note that significant home lending is still happening, though overall growth has slowed.

Within these numbers, $14.4bn owner occupied loans were written, a rise of 2.1%, or $291m; whilst $12.1bn of investment loans were written, down 3.1% or $386m. Refinancing grew 1.7%, of $109m and equated to $6.7bn in the month. Loans for new houses or for construction of new dwellings (across investment and OO), rose 0.5% to $3.8bn.
Housing-Oct-1Taking a longer, and state based view of  loans for new construction for owner occupation, there are significant variations. New home lending to owner occupiers increased by 7.8 per cent in New South Wales and was unchanged in the Norther Territory. In the other six states and territories, the number of loans to owner occupiers purchasing or constructing new homes decline in October 2015 when compared with October 2014: Tasmania (-28.6 per cent); Western Australia (-24.5 per cent); Australian Capital Territory (-20.9 per cent); Queensland (-9.2 per cent); Victoria (-6.0 per cent); and South Australia (-2.5 per cent).  Construction momentum is waning.

Of course, there is a whole load of noise in the data, with loan reclassifications so we need to treat the numbers with care, but the trend is clear now. These adjustments show clearly in the ADI stock trend data, which shows how the proportion of investment loans were adjusted up (thanks to the bank reclassifying loans to investment loans in the year from June 2014, and more recently households telling the banks their loans were NOT investment loans, see our earlier post on this, referring to the more reliable(?) RBA numbers. At a portfolio level, in original terms, ADI loans for all housing were up 0.53% to $1.44 trillion,  of which OO contributed $911bn, up 2.6% and investment loans $526bn, down 2.9%.

Housing-Stock-Oct-2015Turning to first time buyers, owner occupied loans fell 2.85%, making 15.1% of all new loans taken by first time buyers. The average FTB loan rose again from $351,800 last month to $355,700 this month. An astonishing rise, given flat incomes.

FTB-Oct-2015Finally, if we add back in the hidden first time buyers who are going direct to the investment sector (using data from the DFA surveys), we see that momentum here continues to weaken, with a fall of more than 7% is loans written this month, a fall from 4,147 in September to 3,835 in October.  Together first time buyer numbers fell 5.5%, from 13,100 to 12,534.

FTB-Adj-Oct-2015  To further muddy the waters, the ABS also made revisions:

In this issue revisions have been made to the original series as a result of improved reporting of survey and administrative data, and updated first home buyer modelled estimates. These revisions have impacted on:

  • First home buyers owner occupied housing for August 2015.
  • Investment housing for August 2015.
  • Housing loan outstandings to households; owner-occupied and investment housing: for periods from March 2014 to September 2015.

Monthly First Home Buyer statistics will be subject to future revision, as the modelled component is adjusted to reflect improved reporting by lenders.