Credit Looks for US to Realise Potential

Moody’s says today’s still underperforming US economy leaves plenty of room for significant improvement in 2017 without the unwanted side effect of significantly faster price inflation. The US economy may be far from realizing its full potential.

January 2017 marks the 91st month of the current economic recovery and yet the US economy’s rates of resource utilization leave considerable room for additional production. In terms of the latest three-month averages, only 75.2% of industrial capacity was in use, while payrolls approximated a relatively low 57.0% of the working-age population. When previous upturns were of similar vintage in October 1998 and June 1990, the industrial capacity utilization rate averaged 82.7% and payrolls averaged 59.9% of the working age population.

Will this be the first economic recovery since the 1930s where the capacity utilization rate’s moving three month average fails to reach the 80% mark, where the latter is typically associated with the sufficient utilization of potential industrial output? Thus far in the current upturn, this version of capacity utilization has risen no higher than the 78.6% of Q4-2014. Figure 1 indicates a good deal of room to grow for industrial capacity utilization and, thus, lends support to the possibility of faster than 3% real GDP growth. By comparison, real GDP has risen by only 1.8% annualized, on average, for the current recovery to date and not since 2005’s 3.3% has growth managed to reach 3% for an entire calendar year. (Figure 1.)

In a similar vein, late 2016’s relatively low ratio of jobs to the working-age population preserves the possibility of a fuller utilization of US labor resources that could supply a noticeably faster rate of economic growth. However, the recent absence of labor productivity growth limits the extent to which faster jobs growth can quicken economic growth. (Figure 2.)

Yes, late 2016’s comparatively low rates of resource utilization hint of considerable upside potential for US business activity. Nevertheless, whether such potential is realized depends on a far from assured quickening of expenditures. For one thing, the recent strengthening of the dollar exchange rate heightens the importance of an acceleration by US household spending, which requires improved prospects for employment income.

The critical role of household expenditures cannot be overemphasized. Regardless of the more favorable tax treatment of capital outlays, businesses are only likely to significantly increase their production capabilities if they are convinced of sufficiently profitable markets for new and existing products.

Thus, businesses are likely to heed the warning of slower household spending growth implicit in the dip by payrolls’ annual increase from Q1-2015’s cycle high of 2.2% to Q4-2016’s 1.6%. The last two times payrolls decelerated in a similar manner, recessions arrived within 18 months.

Jobs outlook suggests spreads are too thin

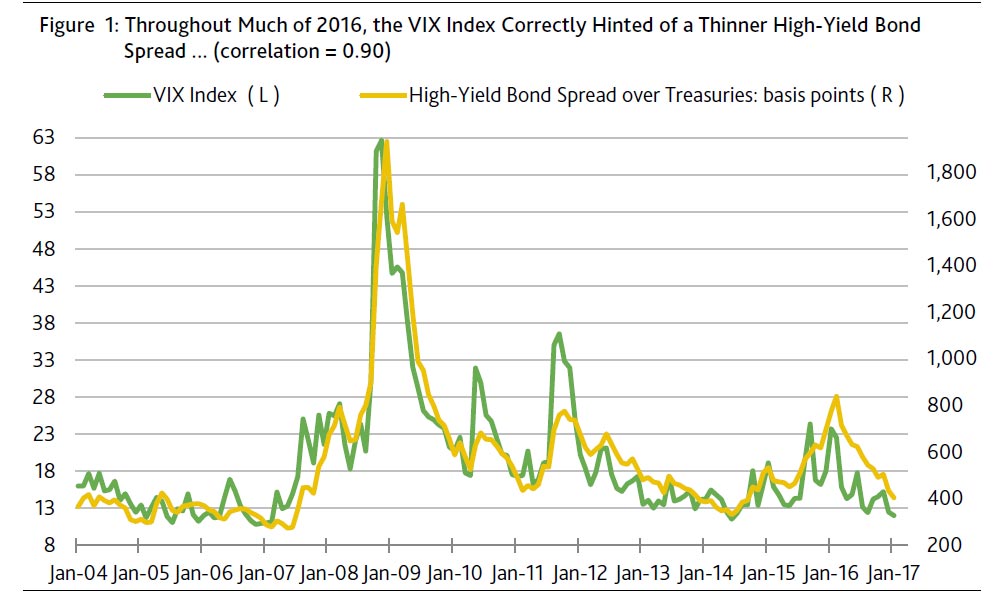
Corporate credit is now very much priced for faster economic growth that will require the fuller utilization of US productive resources. The correlation between the high-yield bond spread and the moving three-month average of payrolls’ monthly percent change is a strong 0.78. Fourth-quarter 2016’s average monthly increase by payrolls of 0.11% predicts a 531 bp midpoint for the high-yield bond spread.

Accordingly, January 11’s far thinner high-yield bond spread of 405 bp implicitly expects faster jobs growth. However, as inferred from the Blue Chip consensus expectation of a drop by payrolls’ average monthly increase from 2016’s 180,000 jobs to 2017’s 161,000 jobs, the high-yield spread may soon be closer to 500 bp than to 400 bp.

Unemployment rate overstates labor market tightness

As opposed to the unemployment rate, the ratio of payrolls to the working-age population may now be the better estimate of labor market utilization, owing to the current recovery’s large number of labor force dropouts. For example, when the unemployment rate previously first fell to Q4-2106’s 4.7% in March 2006 and November 1997, payrolls averaged 60.2% of the working age population, which was well above Q4-2016’s 57.0%.

As inferred from the unemployment rate’s statistical relationship with the ratio of payrolls to the working-age population since 1988, Q4-2016’s ratio of 57.0% is ordinarily accompanied by a jobless rate of 6.8%. Even after allowing for how an aging workforce exerts a downward bias to the ratio of payrolls to the working-age population, the 4.7% unemployment rate still probably overstates the degree of labor market tightening. (Figure 3.)

In addition to an atypically low labor force participation rate, the 4.7% unemployment rate overstates labor-market tightness because of a relatively high U6 unemployment, or under-employment, rate. When the jobless rate’s moving three-month average previously first fell to 4.7% in March 2006 and November 1997, the U6 under-employment rate averaged 8.4%, considerably lower than Q4-2016’s 9.3%.

Nevertheless, the US labor market is firming up, as seen in the yearly increase of the average hourly wage from the 2.5% of Q4-2015 to Q4-2016’s 2.7%. However, when the unemployment rate’s three-month average last fell to 4.7% in Q1-2006, average hourly earnings posted a comparable increase of 3.4%. During the previous cycle, the yearly increase of the average wage’s moving three-month average peaked at the 3.8% of Q3-2006. By the time the moving three-month averages of the jobless rate and the U6 under-employment rate bottomed simultaneously in May 2007 (at 4.4% and 8.1%, respectively), the average hourly wage’s annual increase had slowed to 3.4%.

Despite an earlier acceleration by the hourly wage’s moving yearlong average from the 2.0% of the span-ended September 2004 to the 3.7% of the span-ended March 2007, the annual rate of growth for the core PCE price index peaked at a relatively modest 2.4%. By comparison, the core PCE price index rose by 1.7% annually during the three-months-ended November 2016. The possibly unfinished strengthening of the dollar exchange rate will limit the upside for US price inflation and just might intensify the price deflation still afflicting a number of internationally traded goods.

Ratio of jobs to the working-age population outshines other possible inflation indicators

The market’s recent obsession with December’s 2.9% yearly jump by average hourly earnings may have been unwarranted. After all, the annual rate of core PCE price index inflation generated a meaningless correlation of 0.04 with the yearly percent change of the average hourly wage.

By contrast, the ratio of payrolls to the working-age population again offers useful insight regarding labor market tightness and inflation risk. Since 1992, the year-to-year percentage point change for the ratio of payrolls to the working-age population shows a correlation of 0.31 with the annual rate of core PCE price index inflation, where this and forthcoming comparisons employ moving three-month averages.

As far as predicting core PCE price index inflation, the ratio of jobs to the working-age population also outperforms both the unemployment and U6 under-employment rates. For example, the jobless rate and its year-to-year percentage point change showed weaker correlations of -0.22 and -0.24 with the annual rate of core PCE price index inflation, while the U6 under-employment rate posted comparably measured correlations of -0.23 and -0.22, respectively. Thus, expectations of a continued mild rise by the ratio of payrolls to the working-age population suggest only a limited upside for core PCE price index inflation.

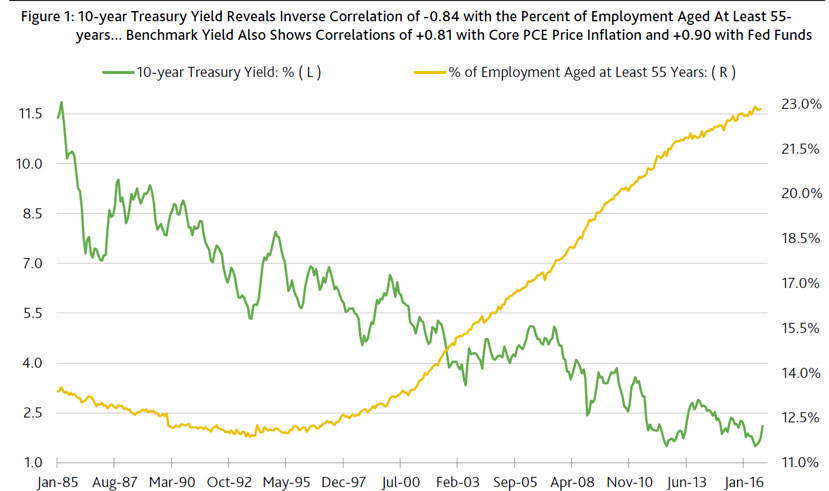
Consensus views on employment and industrial production favor a continuation of the Great Underutilization. Unless payrolls zoom ahead of recent forecasts, the midpoint for fed funds may finish 2017 no higher than 1.125%, while the 10-year Treasury yield spends most of the year under 2.5%. Only if the demand for US output delivers a big enough upside surprise might a substantially fuller utilization of resources help make America great again.

US Housing Finance Agencies Will Benefit from Cut in FHA Mortgage Insurance Premiums

Moody’s says on Monday, the US Department of Housing and Urban Development (HUD) announced that the Federal Housing Administration (FHA) will reduce by 25 basis points insurance premiums that borrowers pay on single-family mortgages. The premium cut is credit positive for US state Housing Finance Agencies (HFAs) because it will make FHA-insured mortgage loans more affordable to borrowers and increase HFA loan originations. The premium reduction will apply to new loans closing on or after 27 January.

HFAs are charged with providing and increasing the supply of affordable housing in their respective states for first-time homebuyers. The FHA, unlike other mortgage insurance providers, insure loans with loan-to-value ratios of up to 97%, which is key to the HFA lending base, given that first-time homebuyers often have limited funds for down payments.

The 25-basis-point decrease in the FHA’s insurance premium, which we expect will save new homeowners as much as $500 a year, also increases the competitiveness of HFA mortgage products. A lower FHA cost will attract more borrowers and stimulate stronger FHA loan originations at a time when mortgage interest rates are rising. As of 30 June 2016, FHA mortgage insurance provided the biggest share of the insurance on HFA pools, constituting approximately 38% of Moody’s-rated HFA whole-loan mortgages (see Exhibit 1), compared with 17% of mortgages utilizing private mortgage insurance.

HFA portfolio performance will strengthen because more loans will benefit from FHA insurance coverage. FHA insurance offers the deepest level of protection against foreclosure losses relative to other mortgage insurers because they cover nearly 100% of the loan principal balance plus interest and foreclosure costs. Additionally, the FHA provides the strongest claims-paying ability relative to private mortgage insurers. Although private mortgage insurers maintain ratings of Baa1 to Ba1, FHA insurance is backed by the US government.

The reduced FHA premiums will also benefit HFA to-be-announced (TBA) loan sales, which are secondary market sales using the Ginnie Mae TBA market. All loans utilizing Ginnie Mae must have US government insurance, and the FHA provides a substantial share of this insurance. Higher TBA sales will increase in HFA margins given that TBA sales have been a major driver of loan production and volume, contributing to an all-time high 17% margin in fiscal 2015, which ended 30 June 2015 (see Exhibit 2).

Delayed Completion of Basel 3 Reform Is Credit Negative for Banks

According to Moody’s the 3rd January announcement from the Basel Committee on Banking Supervision (BCBS) that the final decision on the completion of the Basel 3 reform (also referred to as Basel 4) has been postponed, is credit negative for Banks. The delay could also dent investors’ confidence in banks’ capital ratios and result in higher cost of funding.

The scheduled January meeting of the Group of Central Bank Governors and Heads of Supervision (GHOS) to agree on final capital regulations was postponed because of the lack of agreement on calibrating parameters for the use of internal capital models. The protracted process is credit negative for banks and signals the supervisors’ difficult reach for a consensus on adopting rules for a common/global capital framework, which is critical to preserve a level playing field.

The delay could also dent investors’ confidence in banks’ capital ratios and result in higher cost of funding.

GHOS’ decision to postpone the meeting is unsurprising given differing views among BCBS members. The BCBS is striving to define a revised framework that fairly reflects risks and does not result in “significant” capital increases. Officials from EU countries including France and Germany and the European Commission are worried about choking off bank lending to economies where loans are the primary form of corporate finance. Although what would constitute a significant capital increase has not been quantified, BCBS Chairman Stefan Ingves last month acknowledged that this objective does not mean avoiding any increase for any bank and it may result in significant increases at some banks.

BCBS members agree on the overarching objective, which is to restore confidence in banks’ calculation of their risk-weighted assets (RWAs). That means achieving greater consistency and reducing variability in the calculation methodology for RWAs. The BCBS seeks to constrain the benefit of modelling techniques: in some cases, supervisors consider that the models too frequently result in low capital requirements and the BCBS is specifically targeting banks that have developed aggressive modelling techniques. However, defining the threshold at which such capital benefits become unacceptable is proving thorny for BCBS.

BCBS has a consensus on the need to get rid of unjustified variability, yet lacks a consensus on the acceptable level of difference between the “standardized” measure of risks and banks’ internal model estimates. Banks will be required to assess their risks under both methods and the general floor, which will be set between 60% and 90% of standardized risk weights, will determine the benefits risk modelling could bring: the lower the floor, the greater banks can benefit from models’ outcomes. Those regulators who place greater trust in banks’ internal models favor a lower floor while others, based on well-documented failures that occurred during the financial crisis, argue the standardized approach should drive the outcome, and therefore prefer a higher floor. The more intensive use of models by EU banks makes them sensitive to the floor.

The final decision on the general floor will attract a lot of attention from investors. If the general floor is set at a high level (close to 90%), the GHOS will have been relatively conservative; even more so if the implementation period is short. Were the floor to be set closer to 60% with a long transition phase, it would indicate a more permissive stance. However there are also many technical parameters that are critical to form a view on the framework’s toughness (or lack thereof); for example, floors could be imposed at the model level (setting a minimum level of probability of default or loss given default).

For now, the absence of an agreement and the BCBS’ difficulties in clinching a deal continue to fuel investors’ lack of confidence in RWAs and hence in capital ratios and skepticism towards the adoption of harmonized rules.

Rating Revisions Dispute Thin Spreads – Moody’s

Interesting piece from Moody’s today which warns:

Do not confuse the stunning rally by high-yield bonds since early 2016 with a commensurate enhancement of the fundamentals governing high-yield credit quality. Be aware of how the same overvaluation that now inflates share prices may also be responsible for an exaggerated narrowing of high-yield spreads.

According to almost every explanation of the high-yield bond spread, a recent composite speculative-grade bond yield of roughly 6% now undercompensates investors for default risk. The accompanying high-yield bond spread of 404 bp was the thinnest since the 396 bp of September 23, 2014. However, September 2014’s 2.2% EDF (average expected default frequency) metric for US/Canadian high-yield issuers was significantly lower than the 3.6% of January 4, 2017. Indeed, the combination of the 3.6% high-yield EDF and its -80 bp drop of the last three months predicts a 450 bp midpoint for the high-yield bond spread that exceeds its recent 404 bp.

Of all the major drivers of the high-yield bond spread, only an exceptionally low VIX index supports the possibility of even less compensation for default risk. More specifically, the recent VIX index of 12.0 predicts a 360 bp for the high-yield bond spread. (Figure 1.)

Market behavior of the past year suggests that the VIX index will continue to give direction to the high-yield bond spread. Nevertheless, high-yield spreads could widen amid a climb by the market value of US common stock if a narrowly focused equity rally is incapable of reversing a worsening outlook for high-yield defaults.

Downgrades jump relative to Q4-2016 rating changes

Fourth-quarter 2016’s widening of the gap between high-yield downgrades and upgrades was very much at odds with a pronounced narrowing by the high-yield bond spread. Downgrades supplied 68% of the number of credit rating changes affecting US high-yield companies in 2016’s final quarter. Previously, after dropping from Q1-2016’s current cycle high of 82% to Q2-2016’s 62%, downgrades’ share of US high-yield credit rating revisions would then sink to Q3-2016’s 54%.

The latest upswing by the relative incidence of high-yield downgrades cannot be ascribed to the oil and gas industry. To the contrary, the relative incidence of high-yield downgrades actually increased after excluding oil and gas related revisions largely because of Q4-2016’s financially-driven, as opposed to fundamentally-based, oil and gas company upgrades. More specifically, downgrades’ share of high-yield credit rating revisions excluding all changes closely linked to oil and gas would soar from Q3-2016’s 48% to Q4-2016’s 70%, where the latter was the highest such ratio since the 72% of Q1-2016.

When comparing the US high-yield rating revisions of 2016’s third- and fourth-quarters, a -48% plunge in the number of upgrades stands out. By contrast, the number of high-yield downgrades barely dipped by -4%.

After excluding revisions that were purely event driven, the number of high-yield upgrades attributed to improved fundamentals sank by -46% from the third to the fourth quarter, while downgrades stemming from worsened fundamentals edged higher by 1%.

Spreads may widen unless net downgrades subside

When the high-yield bond spread averaged 379 bp during the year-ended September 2014, not only were fundamentally driven high-yield downgrades -40% fewer, on average, compared to Q4-2016’s pace, but fundamentally-driven upgrades were +29% more numerous. Moreover, in terms of quarterly averages for all US high-yield credit rating changes, the year-ended September 2014 showed -29% fewer downgrades and +41% more upgrades compared to Q4-2016’s results. And yet the high-yield spread is now the narrowest since September 2014?

Notwithstanding the jump by downgrades’ share of US high-yield credit rating revisions both with and excluding oil and gas related changes, the high-yield bond spread still narrowed considerably from a Q3-2016 average of 551 bp to Q4-2016’s 477 bp. Moreover, as noted earlier, January 4, 2017’s high-yield bond spread of 404 bp was the thinnest since September 2014, where the latter was at the end of the just cited yearlong span of a much lower ratio of downgrades to upgrades.

The record warns of a wider high-yield bond spread unless fourth-quarter 2016’s excess of high-yield downgrades over upgrades narrows substantially. As statistically inferred from the relatively strong correlation of 0.80 between the high-yield bond spread’s quarter-long average and the moving two-quarter ratio of net high-yield downgrades to the number of high-yield issuers, H2-2016’s ratio favors a 536 bp midpoint for the high-yield bond spread. Moreover, if the net high-yield downgrades of 2016’s final quarter persist through the end of September 2017, the projected midpoint for the high-yield spread widens to 560 bp. (Figure 2.)

Equity strength enhances credit quality

The fact that the high-yield spread is now much narrower than what might be inferred from the recent excess of high-yield downgrades over upgrades underscores the critical importance of today’s superb financial market conditions to the current thinness of spreads. The considerable support now supplied to the high-yield bond market by an exceptionally low VIX index of 12.0 cannot be overstated. Once financial market conditions deteriorate, the high-yield bond market’s vulnerabilities will become apparent.

Nevertheless, today’s ample amount of systemic liquidity can facilitate a strengthening of high-yield credit quality. Injections of common equity capital enhance corporate credit quality either by (i) deepening the capital base that shields creditors or (ii) funding the retirement of outstanding debt.

Common equity capital is more likely to be secured at an attractive cost during a broad based equity rally. When the US equity market was flat to lower during the six-months-ended March 2016, only two upgrades were ascribed to injections of common equity capital. However, a subsequent rally by US shares has helped to boost the number of common-equity injection upgrades to the 32 of the final nine months of 2016.
In addition, a well-functioning equity market also boosts the number of upgrades stemming from mergers, acquisitions and divestments. After averaging 23 per quarter during the year ended September 2015, the number of upgrades linked to M&A slumped to 12 per quarter amid the soft equity market of the six-months-ended March 2016. Thereafter, stocks thrived during the final nine months of 2016 and the number of upgrades attributed to M&A rebounded to 24 per quarter, on average. Of special importance to financially-stressed high-yield issuers is how broad stock market rallies often facilitate asset divestitures that fund the retirement of outstanding debt.

Credit quality worsened amid huge equity rally of 1998-2000

The breadth of an equity market rally matters. Despite the 18.5% average annual surge by the market value of US common stock during the two years ended March 2000, the US high-yield default rate climbed up from March 1998’s 2.7% to March 2000’s 6.3%, the moving two-quarter ratio of net high-yield downgrades to the number of high-yield issuers soared higher from Q1-1998’s -2.5% to Q1-2000’s +7.7%, and the high-yield bond spread widened from Q1-1998’s 338 bp to Q1-2000’s 522 bp.

Instead of benefiting from the very strong showing by the market value of US common stock, the high-yield bond market was weighed down by the accompanying -5.9% average annual decline incurred by Value Line’s geometric stock price index, which offers insight regarding the breadth of an equity market rally. Despite the equity market’s outsized gains of the two-years-ended March 2000, the gains were narrowly focused according to the slide by the Value Line index. By contrast, the 17% surge by the Value Line index from Q1-2016 to Q4-2016 was actually greater than the accompanying 14% increase by the market value of US common stock.

As revealed by the statistical record since 1994, the high-yield bond spread’s year-over-year change in basis points shows a stronger inverse correlation of -0.82 with the yearly percent change of the Value Line index relative to its comparably measured correlations of -0.76 with the Russell 2000 stock price index and -0.67 with the market value of US common stock.

Moreover, another possibly revealing aspect of 1998-2000’s equity rally was how it occurred despite a relatively high VIX index. Though the methodology determining the VIX index has since changed, after advancing from a 1993-1996 average of 13.9 to March 1998’s 20.2, the VIX index averaged an even higher 22.7 in March 2000.

In conclusion, an extension of the ongoing high-yield rally may require a further overvaluation of the US’s already richly priced equity market. Until downwardly revised earnings outlooks proliferate, the path of least resistance for share prices may be higher. Thus, high-yield bond spreads may continue to ignore the less than favorable trend of credit rating revisions.

US Federal Reserve Rate Hike Is Credit Positive for Housing Finance Agencies

Moody’s says following the US Federal Reserve raise of its short-term interest rate by 25 basis points, the first time the Fed has increased the rate since December 2015, when it was raised to 0.25% from 0%, where it had been for seven years. Although the increase is small, the Fed’s decision is credit positive for housing finance agencies (HFAs) in aggregate because higher interest rates boost their investment earnings, drive profit margins and present opportunities to grow loan portfolios and rebuild balance sheets.

As of fiscal year-end 2015, roughly 7.2% of HFAs’ assets were held in cash and cash equivalents, which will immediately benefit from the rate increase and boost investment earnings. Historically, HFA profitability has closely tracked investment earnings. Between 2007 and 2009, the steep drop in interest rates led to a decline in HFA profitability. Since then, low interest rates have curtailed profits, although HFA earnings have recovered owing to selling mortgage-backed securities in the secondary market and savings from bond refundings. Now, profit margins should expand with the higher interest rates boosting investment earnings. We project that HFA sector-wide profit margins will increase by 5% if investment income doubles from 2015 levels and by 9% if investment income triples (see Exhibit 1). Actual results will vary among the HFAs.

As interest rates rise, HFAs will be challenged by higher interest expense on both their hedged and unhedged variable-rate debt. However, increased investment earnings on cash held by HFAs combined with the interest rate swaps on the hedged variable rate debt will alleviate the effect of the higher interest costs. HFAs can also use cash to redeem unhedged variable-rate bonds if interest rates become too high. As Exhibit 2 shows, the cash and cash equivalents that HFAs had at fiscal year-end 2015 were equal to 2.7x the amount of unhedged variable-rate debt. Higher interest rates also mean HFAs’ swap termination costs will decline, allowing HFAs to terminate swaps more economically.

An increase in mortgage rates (close to 6% or higher) would also allow HFAs to grow their loan portfolios. Although mortgage rates are not immediately affected by short-term interest rates, changes affect long-term mortgage rates. Demand for HFA mortgages is driven by the attractiveness of rates on HFA loans relative to those on conventional mortgages. With rates on conventional mortgages so low, HFAs have found it difficult to originate loans over the past seven years. With an increase in interest rates, fewer borrowers could obtain a mortgage from a conventional lender at a lower rate than from an HFA. Higher loan originations, coupled with issuance of tax-exempt bonds, would rebuild HFA balance sheets. In the past few years, HFAs have financed loans primarily through selling mortgage-backed securities in the secondary market rather than bond financing.

Pressure mounting on bank assets: Moody’s

From InvestorDaily.

Australian bank asset quality deteriorated mildly from an “exceptionally strong” position during the second half of 2016, according to a new report by Moody’s.

While low interest rates and stable employment will continue to support the assets of the major banks, gradual pressure is beginning to mount, the ratings house said.

Further stress in resource-related sectors and regions of Australia will see banks’ assets continue to weaken, driven primarily by declining investment and lower commodity prices.

In addition, the rising settlement risk for residential property developments, driven by tighter lending criteria and reduced fund flows from China, will weigh on the quality of bank assets, Moody’s said.

Finally, continued stress in the dairy sector is disproportionately affecting the major banks’ New Zealand subsidiaries.

However, Moody’s said the banks are working to mitigate the headwinds by tightening their lending criteria to the aforementioned sectors as well as increasing provisioning in anticipation of further deterioration.

“The major banks are also less likely to be exposed to foreign shocks, which could impact asset quality, following the reduction in their international exposures to Asia and the United Kingdom,” the ratings house said.

“On a positive note, Australian banks are increasingly well capitalised to absorb any adverse shocks, as evidenced by APRA’s implementation of higher residential mortgage credit risk weights for the banks using the advanced internal ratings-based (AIRB) model for capital calculations starting on 1 July 2016.

“The major banks use AIRB and their capital ratios were neutralised as a result of their capital raisings in 2015.”

China’s Proposal to Revise Banks’ Off-Balance-Sheet Exposure Regulations

Moody’s says on 23 November, the China Banking Regulatory Commission (CBRC) published a consultation paper that aims to tighten regulations for commercial banks’ off-balance-sheet activities, which have grown rapidly in recent years. If implemented, these measures would be credit positive because they would reduce risks in the banking system and curtail incentives to engage in the regulatory arbitrage that has accelerated the growth of China’s shadow banking activities.

moodys-chinaThe proposed guidelines provide a more comprehensive set of definitions for off-balance-sheet exposures to better capture the latest innovations. When the CBRC formulated the current regulations in 2011, they mainly addressed the guarantee and commitment businesses. The new rule will expand to include entrusted services (which includes entrusted loans and investment, non-guaranteed wealth-management products, agency transactions, agency issues and bond underwriting) and intermediary services (including agency collection and payments, financial advisory and asset custody). These new services have grown rapidly in recent years, raising concerns about the expansion of China’s shadow banking system.

We estimate that the shadow banking sector grew by an annualized rate of 19% in the first half of 2016 to RMB58.3 trillion, or 80% of GDP, fueled predominately by the issuance of wealth management products. A China Banking Wealth Management Registration System report showed that RMB20.18 trillion of the RMB26.28 trillion of outstanding wealth management products at the end of June 2016 were non-guaranteed products usually kept off the balance sheet of the originating or distributing bank. By remaining off balance sheet, banks have been able to circumvent regulations on loan quotas and limits and dodge capital and provision requirements.

The proposed new guidelines require banks to set provisions on impairment losses on off-balance-sheet assets and retain risk-based capital on such assets. Although many wealth management products are off balance sheet, customers perceive banks as having provided an implicit guarantee for these products. The new rule would increase regulatory capital requirements that better capture banks’ actual credit risk.

The revised guidelines also ask for more detailed disclosure and more robust risk management of off-balance-sheet exposures, and banks would have to establish risk limits for off-balance-sheet exposures. Although the People’s Bank of China plans to include off-balance-sheet items in its macro-prudential assessment and the CBRC in July issued new draft rules on banks’ wealth management products, the new proposal offers a more comprehensive regulatory framework and complements other measures already in effect. The tighter rules will help contain off-balance-sheet risks and improve financial system transparency.

Banks with higher off-balance-sheet exposures will be most affected by the new regulation. Small and midsize banks will likely be most affected by the revised measures because they have been the more active issuers of wealth management products, which at some banks have become a key revenue source.

Although the revised rules focus on general risk-management principles, they fall short in providing details on actual execution, and leave a few key questions unanswered. For example, it remains unclear which off-balance-sheet assets’ credit risks are deemed retained by the banks themselves. Also lacking are specifics about the supervision for the risk conversion factor of off-balance-sheet assets or any details on the level of capital and reserves required. Additionally, a lack of uniformity across banks remains because banks’ boards of directors are responsible for approving off-balance-sheet business, risk management and imposing risk limits. Consequently, implementation by each bank will vary.

Aging Boomers May Stymie Trumponomics

Moody’s says not only did the wide majority of experts incorrectly predict the outcome of the US Presidential election, pundits also were far off the mark regarding how markets might react to an improbable Donald J. Trump victory. Instead of conforming to pre-election expectations of an equity market sell-off and lower interest rates, both share prices and bond yields have soared since Trump’s victory. Whether they remain higher depends on a widely anticipated acceleration by business sales vis-a-vis employment costs that may not materialize.

economics-pic

As inferred from recent market performance, the economic, taxation, and regulatory policies of the past eight years curbed business activity considerably and, by doing so, reined in the growth of attractive job opportunities. To the degree existing policies limited US business activity, they very much facilitated Donald Trump’s Presidential upset. Perhaps, “secular stagnation” is partly the offshoot of suboptimal government policies that helped to slash US real GDP’s average annual growth rate from the 3.3% of the 10-years-ended 2006 to the 1.3% of the 10-years-ended 2016.

Nevertheless, unprecedented demographic change that is beyond the scope of an immediate government remedy is one of the major drivers of “secular stagnation”. The aging of the US population complements the deceleration of growth quite nicely.

When the US economy grew by 3.3% annually during the 10-years-ended 2006, the number of Americans aged 65 years and older rose by 310,000 annually, on average, while the number aged 16 to 64 years — a proxy for the working-age population — expanded by a much greater 2.36-million annually. By the 10-years-ended 2016, the average annual increase in the number aged at least 65 years soared to 1.28 million as the annual addition to the working-age population sagged to the same 1.28 million.

Notwithstanding the likely implementation of more stimulatory policies, US growth during the next 10-years-ended 2026 will still be constrained by projected average annual increase of only 470,000 for the number of 16- to 64-year old Americans, which is far less than the forecasted average annual addition of 2.05 million to the ranks of those 65-years and older.

If, as expected, the US working-age population grows by 0.5% annually during the next 10-years, then a likely range of 1.0% to 1.5% for the average annual rate of labor productivity growth suggests that US real GDP will increase by between 1.5% and 2% annually through 2026, which is much slower than its 3.2% average annualized increase of the 25 years ended 2006.

Older workforce may keep 10-year Treasury yield under 3% to 5% range. In addition to the overall population, the US workforce is also getting older in a manner never seen before. Since June 2009’s end to the Great Recession, the cumulative 8.5% growth of household-survey employment was unevenly split between a 3.9% increase in the number of employees aged less than 55 years and a 28.0% surge for the employment of Americans aged at least 55 years.

If employment growth remains skewed toward older workers, part-time workers will probably constitute an above-trend share of employment, while the growth of both personal income and household spending will be slower than otherwise. The underlying growth of both income and spending slowed as the share of workers aged at least 55 years soared from October 1996’s 12.1% to October 2016’s 22.8% of total US employment.

Some now warn of an impending climb by the 10-year Treasury yield to a range of 3% to 5%. However, an older workforce weighs against a much higher benchmark Treasury yield. An older workforce and an aging population are expected to limit the upsides for inflation risk, private-sector borrowing, and household expenditures growth by enough to prevent the 10-year Treasury yield from becoming stuck in a range of 3% to 5%.

Credit Markets Review and Outlook

As illustrated by Figure 1, the 10-year Treasury yield maintains a strong correlation of -0.84 with the share of employment aged at least 55 years. Getting to a forecast midpoint of 3% for the 10-year Treasury requires that the employment of Americans aged at least 55 years drop from October 2016’s 22.8% to roughly 20% of total employment. Such a rejuvenation of US employment is highly unlikely. The impossibility of making America young again renders it all the more difficult to make America great again. (Figure 1.)

trump-boomers
Equity rally helps to drive benchmark yields sharply higher

Thus far, earnings-sensitive markets view the Republican sweep of the House, Senate, and Presidency positively. Since November 8’s election, the market value of US common stock was recently up 1.9%. Moreover, after the VIX index’s average soared from October 2016’s 14.6 points to the 20.0 points of November’s first eight days, this equity market “fear factor” subsequently dropped to a recent 14.6. The latter has been statistically associated with a 430 bp midpoint for the high-yield bond spread, which was thinner than November 9’s band of 508 bp.

The post-election equity rally stems from improved prospects for business activity and profits. The Republican sweep boosts the odds favoring a fiscal stimulus package that includes lower tax rates on personal and corporate income, as well as stepped-up infrastructure spending. Moreover, a much reduced rate of taxation on the repatriation of corporate cash held overseas is probable.

In addition, business operating costs are likely to be effectively reduced by the repeal of the Affordable Care Act and a broad-based easing of federal regulations. On the regulatory front, Bloomberg reports that Trump’s Financial Services Policy Implementation team will devise a strategy that aims to dismantle 2010’s Dodd-Frank Act. Expectations of both Dodd-Frank’s demise and Fed rate hikes have driven the KBW index of bank stock prices up by more than 9% since November 8.

Nevertheless, upwardly revised outlooks for business activity and corporate earnings quickly drove the 10-year Treasury yield up by 27 bp from November 8’s close to a recent 2.13%. Not since January 2016 has the 10-year Treasury yield been this high.

Recent auctions of new 10- and 30-year Treasury bonds were weak. The 2.22:1 bid-to-cover ratio for November 9’s $23 billion auction of 10-year Treasury notes was the lowest since March 2009. In addition, foreign participation was weak at both sales. Trump’s surprising victory may have temporarily scared off foreign buyers of US Treasuries.

Nevertheless, the dollar exchange rate has climbed higher since the election. The recent widening of the yield spreads between US Treasuries and the sovereign government bonds of other advanced economies may help to further firm the dollar exchange rate, where expectations of an even stronger dollar may contain Treasury yields by (i) reducing inflation expectations, (ii) boosting foreign purchases of US Treasuries, and (iii) lowering the outlook for US corporate earnings.

Credit Markets Review and Outlook

Despite a costlier dollar exchange rate, industrial metals prices have soared. On November 9, Moody’s industrial metals price index was up by 29.4% from a year earlier.

However, the still relatively modest pace of global industrial activity questions the sustainability of the latest surge by base metals prices. Perhaps, speculative buying in anticipation of a lively rejuvenation of global industrial activity now drives base metals prices higher. If the world’s consumers fail to cooperate and spending does not rise by enough to support costlier base metals, base metals price deflation will return.
Given the persistent price deflation afflicting tangible consumer goods, manufacturers will have difficulty passing on higher materials costs to final product prices. In October, the annual rates of price deflation were -2.3% for the consumer durable goods’ component of the PCE price index and -0.6% for the core consumer goods price index. The underutilization of the world’s production capabilities should continue to contain prices of internationally tradable products regardless of forthcoming stimulus and deregulation.

A fundamentally excessive climb by Treasury bond yields could sink share prices and widen spreads. Thus, credit-sensitive activity may offer insight as to how high interest rates might climb. In view of how unit home sales recently slowed amid a less than 3.5% mortgage yield, an impending climb by the mortgage yield to a range of 3.75% to 4% risks an outright year-over-year contraction by home sales.

Overblown Inflation Fear Roils Markets – Moody’s

Thus far, according to Moody’s, US financial assets have fared poorly during the fourth quarter. Fear of a fundamentally unwarranted climb by Treasury yields has weighed on the performance of earnings-sensitive securities.

USA-Economy-Pic

The latest climb by the 10-year Treasury yield from a September 2016 average of 1.63% to a more recent 1.81% has been ascribed to expectations of a series of Fed rate hikes in response to a possibly much faster than 2% annual rate of CPI inflation. Though the current bout of inflation anxiety may be overblown, holders of earnings-sensitive securities worry about long-term borrowing costs reaching burdensome levels. In addition, higher yielding Treasury securities will drive up the returns investors demand from other assets. And, the surest way to boost an asset’s future prospective return is to lower its current price.

Since the end of September, the market value of US common stock was recently down by -4.0%. The accompanying -7.3% dive by the Russell 2000 stock price index shows that the prospective loss of liquidity to higher interest rates may weigh more heavily on small- to mid-sized companies.

For businesses incurring flat to lower sales volumes, higher borrowing costs make absolutely no sense. It should be noted that the NFIB’s survey of small businesses found that the net percent of polled firms reporting a three-month increase by sales volumes sank from the -5.5 percentage points, on average, of the year-ended June 2016 to the -7.8 points of Q3-2016. (When the net percent is negative, the number of surveyed firms incurring a decline by sales volumes tops the number reporting an increase.)

Only once during the current recovery has the sales volume statistic’s moving three-month average achieved a positive reading — the +1.1 points of the three-months-ended May 2012. For the current recovery, the sales volume index has averaged a woeful -9.4 points, which was worse than its insipid +1.0 point average of 2002-2007’s upturn.

Housing-sector share prices plunge

The fourth-quarter-to-date’s -8.0% plunge incurred by the PHLX index of housing-sector share prices reflects considerable worry over a possible ascent by benchmark yields that will stifle housing activity. Markets remember all too well how a climb by mortgage yields during the “taper tantrum” of 2013 reduced home sales.

Yes, the 10-year Treasury yield could jump up to 2% or higher, but its stay will be limited if housing buckles under the weight of higher mortgage yields. The fact that housing did not get more of a boost from a -50 bp drop by the 30-year mortgage yield from a Q3-2015 average of 3.95% to the 3.45% of Q3-2016 warns of an annual contraction by home sales if the 10-year Treasury yield remains above 2%.

Housing’s muted response to a less than 3.5% 30-year mortgage yield suggests only a limited upside for the 10-year Treasury yield. After surging by +16.1% year-over-year during the year-ended June 2016, dollar outlays on single family home construction dipped by -0.8% year-over-year during Q3-2016.

In addition, the year-over-year percent increase for unit sales of new and existing homes slowed from the 4.9% of 2016’s first half to the 1.6% of the third quarter. Looking ahead, a slowdown by the annual rise for the index of pending home sales from first-half 2016’s 1.7% to the third quarter’s 1.2% signals a slowing by home sales that risks deteriorating into an outright contraction if mortgage yields jump higher.

Inflation worries overlook deep pockets of deflation

Forecasts of a 10-year Treasury yield noticeably above 2% are derived from expectations of faster price inflation. Nevertheless, exaggerated fears of faster price inflation have surfaced at various times during the current recovery. Remember those earlier off-the-wall predictions of Weimar-like hyperinflation for the US economy? Forecasts of persistently rapid price inflation have proven to be so very wrong largely because US consumers have lacked the cash needed to fund runaway price inflation. In addition, the aging of both the US population and the US workforce add to the difficulty of sustaining accelerations by consumer prices.

Price inflation now lacks breadth. If the Fed decides to fight headline inflation, the plight of those having exposure to tangible consumer goods is likely to worsen. Third-quarter 2016’s PCE price index rose by 1.0% annually, which was well under the Fed’s 2% target for PCE price index inflation. Moreover, the third-quarter’s yearly pace for the Fed’s preferred index of consumer prices contained major pockets of consumer-goods price deflation.

For example, Q3-2016’s price index for durable consumer goods was down by -2.3% from a year earlier, while the price index for consumer nondurable goods fell by -1.3% annually. By contrast, the consumer services’ component of the PCE price index rose by 2.3% annually. Thus, consumer service price inflation explains Q3-2016’s 1.7% annual increase by the core PCE price index, which excludes food and energy prices.
Many fret over an increase by the annual rate of core CPI inflation from September 2015’S 1.9% to September 2016’s 2.2%. However, that quickening was largely the consequence of an increase by core consumer service price inflation from 2.7% to 3.2% that differed radically from an accompanying deepening of core consumer goods price deflation from -0.5% to -0.6%.

The rise by the annual rate of core consumer service price inflation was driven by increases in (i) medical-care service price inflation from September 2015’s 2.4% to September 2016’s 4.8% and (ii) shelter cost price inflation from 3.2% to 3.4%. Excluding shelter costs, the annual rate of core CPI inflation rose from September 2015’s 1.0% to a still very low 1.3% for September 2016.

Shelter cost inflation may peak soon

Recent data favor a slowing of shelter cost inflation from September’s 3.4% annual pace. The National Multifamily Housing Council (NMHC) compiles an index describing the tightness of apartment market conditions for the US. The rate of change for apartment rents tends to respond with a lag of 12 to 15 months following a major swing by the index of apartment market tightness.

After most recently peaking at the 89.7 of Q1-2011, the apartment market tightness index has subsequently plunged to the 28.0 of Q3-2016. The latter was the index’s lowest reading since the 20.0 of Q2-2009, or the final quarter of the Great Recession. (Figure 1.)

moodys04novEach previous drop by the apartment market conditions index to a reading of less than 30 was followed by a significantly slower rate of growth for rents and, in turn, the shelter cost component of the core CPI. For example, in response to Q2-2009’s ultra-low apartment conditions index, the average annual rate of rent inflation sank from the 3.1% of 2009’s first half to the 0.2% of April 2010 through December 2010. Thus, rent inflation is likely to slow noticeably from Q3-2016’s 3.7%.

Other forthcoming sources of consumer price disinflation include autos (owing to a glut of used vehicles and sweetened sales incentives) and restaurant meals (stemming from an excess supply of eateries).

In summary, if Treasury yields extend their latest climb absent indications of much improved profitability, the recent sell-off of high-yield bonds may continue. After bottoming at October 25’s 6.10% — the lowest reading since May 2015 — the composite speculative-grade bond yield rapidly ascended to November 2’s 6.63%. In response, the accompanying high-yield bond spread widened from 478 bp to 531 bp. The latter is very close to the spread’s predicted value of 529 bp mostly because of the return of an above-trend VIX index. To the degree Treasury yields rise faster than what is warranted by business activity, higher yields practically assure lower prices for equities and lower-grade corporates.

Germany Tightens Residential Mortgage Lending

Moody’s says last Tuesday, German stock exchange gazette Börsen-Zeitung reported that Germany’s Ministry of Finance had proposed a draft law aimed at tightening residential mortgage lending market regulations. Once enacted, German Financial Services Authority BaFin would be authorised to tighten residential mortgage loan origination criteria to prevent house prices from overheating. This would be credit positive for mortgage Pfandbriefe (covered bonds) and residential mortgage-backed securities (RMBS) because it would reduce the risk of households taking on excessive debt during times of inflated house prices.

The proposal comprises four components: a maximum loan-to-value (LTV) ratio, a minimum loan amortisation requirement, a maximum debt-service-to-income (DSTI) ratio and a maximum debt-to-income (DTI) ratio. The finance ministry’s proposal follows the German Financial Stability Committee’s 2015 recommendation to the German government to develop instruments to regulate residential mortgage loan origination.
The government’s proposal would only affect newly originated residential mortgage loans because of a grandfathering rule. Therefore, the credit strength of covered bond programmes and RMBS would improve over time, particularly by reducing borrower default, where a maximum LTV ratio will fall below currently LTV ratios.

Exhibit 1 provides an overview of Moody’s-rated German mortgage Pfandbriefe in which the residential mortgage loan portion exceeded 50% of total cover pool assets as of 30 June 2016. Covered bondholders of ING DiBa’s mortgage Pfandbriefe would benefit the most from a maximum LTV ratio because its cover pool has the highest share of residential mortgage cover assets (97.9%) and the highest weighted average whole-loan-to-lending-value5 ratio (99.6%). Based on lending values, 32.2% of ING DiBa’s residential mortgage cover assets have a whole-loan-to-value ratio above 100%.

moodys-germanyThe whole-loan-to-value ratio is not only an important driver of the probability of borrower loan defaults, but also of recoveries following a borrower’s default. If the BaFin were to set the maximum loan-to-lending value ratio above 60%, Pfandbriefe would not benefit from improved recoveries following borrower default. This is because under the Pfandbrief Act covered bonds may only be issued against loans backed by up to 60% of the property’s lending value. However, the Pfandbrief Act does not limit how much borrowers can borrow against a property. The same applies to the typical eligibility criteria of an RMBS transaction. Therefore, and because lending to residential borrowers has steadily increased since 2010 (see Exhibit 2), a maximum DTI ratio would be credit positive for mortgage Pfandbriefe and German RMBS. This is particularly applicable in the current low interest rate environment, where borrowers’ affordability for large loans has substantially improved.

moodys-germany-2