Basel Committee Guidelines on Prudential Treatment of Problem Assets

Moody’s says the newly released Basel Committee Guidelines on Prudential Treatment of Problem Assets Are Credit Positive for Banks.

Last Tuesday, the Basel Committee on Banking Supervision (BCBS) published Guidelines on the prudential treatment of problem assets (definition of nonperforming exposures and forbearance). The guidelines address the current absence of a common and internationally applicable definition of nonperforming exposures and forbearance and will help harmonize the definition and treatment of banks’ problem loans, a credit positive for banks.

Uniformity across jurisdictions and banks will reduce discrepancies in the recognition and treatment of problem assets. Uniformity will also make international comparisons of banks’ nonperforming exposures, loss recognition and provisioning less challenging.

The BCBS definition of nonperforming exposures is not a substitute for the regulatory classification of defaulting assets and the accounting definition of impaired assets, but supplements these other designations. The BCBS definition extends the nonperforming categorization to all exposures (excluding trading book and derivatives) that are more than 90 days past due or where there is evidence that a full repayment is unlikely.
The scope is wider than under regulatory standards, where default is recognized only after 180 days past due for exposures secured by real estate and exposures to the public sector. It also goes beyond the accounting concept of credit-impaired exposures defined in International Financial Reporting Standard No. 9.5 In addition, nonperforming exposures can be re-categorized as performing only after standards on debt repayment and a debtor’s creditworthiness are met. The re-categorization rule will increase the stock of nonperforming exposures for some banks under this measure.

As shown in the exhibit below, forbearance is defined as a concession granted on exposures where counterparties have financial difficulties, and which the bank would not otherwise have considered. Concessions can take various forms, including extension of term, rescheduling and interest rate reduction. Forbearance is a newly identified concept that can apply to performing or nonperforming exposures. A forborne exposure can return to normal status only if all payments have been made during a probation period of one year and the debtor has resolved its financial difficulty.

In the European Union (EU), similar standards became effective in September 2014. The implementation of these new standards was a critical step in the recognition and treatment of problem assets by EU banks. At the implementation date, the ratio of nonperforming exposures on gross loans published by EU banks was 7%, one percentage point higher than the ratio of impaired and past-due loans, and subsequently decreased to 5.1% in December 2016. The ratio of forborne exposures was 3.2% as of the same date.

An international standard for nonperforming and forborne exposures will require cross-border banks to implement a common definition of problem assets, forcing them to address rising risks in timely manner. It will translate into some disclosure requirements whereby banks will have to publish amounts of nonperforming and forborne exposures, allowing market participants to compare banks’ problem assets, risk provisioning and credit loss recognition. This guideline is key for a harmonized framework to assess asset risk, but it does not address other sources of discrepancies, such as the definition of default, which makes the comparison of banks’ risk-weighting calculation challenging.

Bond Yields Will Fall When the Equity Bubble Bursts

From Moody’s.

Stocks are not cheap. Thus, equities are vulnerable to a deep slide in the event profits contract or interest rates undergo a disruptive climb. The latter would probably include an increase by the 10-year Treasury yield to at least 2.75%.

However, for now, benchmark bond yields have moved in a direction opposite to that taken by the federal funds rate. In spite of the December 2016 and March 2017 rate hikes, the 10-year Treasury yield eased from mid-December’s 2.6% to less than 2.4%.

The drop by the 10-year Treasury yield following two Fed rate hikes was in response to reduced expectations for GDP growth that partly stemmed from the diminished likelihood of meaningful fiscal stimulus. The Blue Chip consensus now looks for nominal GDP growth of 4.3% in 2017, which is only a bit above early November 2016’s pre-election forecast of 4.2%. In view of how the 10-year Treasury yield averaged 1.82% during the 10 trading days ending with Election Day, the 10-year Treasury might conceivably dip under 2.25% barring an upwardly revised outlook for nominal GDP.

Next correction of overvaluation will trigger a “flight to quality”
US equities remain untenably overvalued. The market value of US common equity now resides at a multiple of pretax profits from current production that was unheard of prior to 1998. More specifically, the ratio of the market value of US common stock to yearlong pretax operating profits rose to 11.5:1 in Q4-2016, which was the highest such ratio since Q2-2002’s 12.5:1. After averaging 14.8:1 in 1999, common equity’s market value crested at a record 17.3-times profits in Q3-2000. (Figure 1.)

In addition, stocks are richly priced relative to corporate revenues. As of Q2-2015, the market value of US common stock rose to a cycle high of 218% of corporate gross-value-added, where the latter is a proxy for total corporate revenues. Second-quarter 2015’s ratio for the market value of common equity to corporate gross-value-added (GVA) was the highest since the 225% of Q3-2000. Earlier, the market value of equity peaked at a record high 231% of corporate GVA in Q1-2000. During 2002-2007’s business cycle upturn the ratio failed to reach 200% and the market value of common stock crested at 185% of corporate GVA in Q2-2007. After falling to Q1-2016’s 192%, the market value of common stock has since risen to 214% of corporate GVA in Q4-2016. The latter surpasses all ratios prior to Q2-1999’s 215%. (Figure 2.)

Today’s very high valuation of equities vis-a-vis both profits and revenues does not preclude even richer share prices, but it does warn of substantially lower valuations in the event of an adverse shock. Moreover, a deep drop by equity prices will quickly prompt a ballooning of high-yield bond spreads, which currently undercompensate for long-term default risk.

An eventual bursting of the equity bubble will diminish systemic liquidity. In turn, much costlier financial capital will prompt an increase in defaults. No longer will a relaxation of loan covenants, injections of common equity capital, and the liquidation of business assets provide badly needed relief to distressed borrowers. (Figure 3.)

Thus, when the equity bubble bursts, both the federal funds rate and Treasury bond yields will fall. Though unsustainably high benchmark interest rates may precipitate the bursting of an equity bubble, the ensuing deflation of the bubble will drive benchmark rates sharply lower. The bursting of the equity bubbles of 1987 and 1999-2000, the high-yield and commercial real estate bubbles of 1989-1990, and the housing bubble of 2004-2006 were followed by substantially lower benchmark interest rates.

Consensus outlook on rates contradicts fundamentals

Currently, the consensus expects interest rates to rise steadily at least through year-end 2018. The three-month Treasury bill rate is projected to climb from a recent 0.80% to 2.0% by Q4-2018, while the 10-year Treasury is expected to ascend from just under 2.4% to 3.3%. These forecasts implicitly assume that the equity bubble will not burst into 2018’s final quarter. In other words, the consensus senses that the considerable downside risk of an overvalued equity market will not be realized, notwithstanding the projected return of a quarter-long average of more than 3% for the 10-year Treasury yield for the first time since Q2-2011’s 3.21%. The latter proved unsustainable partly because real GDP growth failed to conform to early June 2011’s consensus expectations of 2.6% for 2011 and 3.1% for 2012. Instead, real GDP rose by merely 1.6% in 2011 and 2.2% in 2012.

Not only did the consensus exaggerate business activity’s forthcoming pace, the consensus also extrapolated too much about future inflation from mid-2011’s speeding up of consumer price inflation. Second quarter 2011’s 4.1% annualized surge by PCE price index inflation was the fastest since 2008 and included a 2.5% advance by the core PCE price index. However, by 2011’s final quarter the sequential annualized rate of inflation had eased to 1.4% for the PCE price index and 1.6% for the core PCE price index.

Having badly overstated near-term economic growth and inflation risk, the consensus would grossly overstate the 10-year Treasury yield’s trajectory. As of early June 2011, the consensus had projected a 3.7% average for Q4-2011’s 10-year Treasury yield, which was well above the actual 2.05%. The miss for Q4-2012’s 10-year Treasury yield was even greater, as the actual yield of 1.71% came in well under the predicted 4.4%.

Core consumer goods price deflation will continue

Today’s consensus has yet to fully appreciate the low-inflation implications of a continued stay by consumer goods price deflation excluding energy products. As millions of late model vehicles come off lease during the next several years, a glut of used cars can be expected to put downward pressure on the prices of new vehicles. Moreover, the loss of demand as inferred from Q1-2017’s -1.4% yearly decline by unit sales of light motor vehicles will reinforce the auto industry’s loss of pricing power.

Worse yet, the inability of very attractive sales incentives to boost car purchases materially does not bode well for auto prices. March’s seasonally-adjusted unit sales fell by -5.4% from February despite sales incentives that averaged 10.4% of the sticker price, which was the highest such percentage since 2009 according to JD Power and Dow Jones.

Elsewhere, reports have surfaced telling of a US retailing giant’s intention to pressure an e-commerce behemoth with more aggressive price discounting. And, for the first time in a long while, a leading producer of non-durable consumer goods will cut prices in order to better compete with recent start-ups.

The progression of communication and manufacturing technologies will continue to contain price inflation. Consider how advancements in oil & gas drilling technology have diluted OPEC’s once unrivalled pricing power.

Consensus forecast of interest rates seems too high

Only if US real GDP growth approaches 3% on a recurring basis might the current consensus 10-year Treasury yield forecast of a 2.8% average for 2017’s second half and 3.1% for yearlong 2018 prove correct. Given the problematic outlook for proposed fiscal stimulus, so rapid a rate of economic growth is unlikely. In the event the 10-year Treasury yield somehow approaches 3% absent a sufficient upward revision of the outlook for operating profits, then a likely deflation of the equity bubble would quickly drive the benchmark Treasury yield well under 3%.

Is revenue-neutral fiscal stimulus an oxymoron? Too much may have been made of the stimulatory powers of revenue-neutral fiscal stimulus. In response to the Great Recession of 2008-2009, fiscal stimulus was enacted that was far from revenue-neutral. For example the moving yearlong US federal budget deficit widened from year-end 2007’s -$371 billion (or -2.9% of GDP) to -$1.417 trillion (or -9.7% of GDP.

Nevertheless, real GDP’s reaction to the massive injection of fiscal stimulus was quite muted. Instead of growing by at least 3% to 4% annually, real GDP rose by a mild 2.5% in 2010. Moreover, 2011 saw real GDP growth sag to 1.6%.

What was striking was the inability of economic activity to capitalize more on 2010’s very low rates of resource utilization. For example, 2010’s yearlong averages were 9.6% for the unemployment rate, 16.7% for the U6 underemployment rate, and 73.6% for the rate of industrial capacity utilization. By contrast, February 2017’s rates of 4.7% for unemployment and 9.2% for U6 underemployment.

Whatever fiscal stimulus emerges in late 2017 or 2018 probably will not be enough to assure a 3% annual increase by yearlong real GDP. In turn, the likelihood for higher short- and long-term interest rates is less than the consensus now believes.

Australia’s Limits on Interest-Only Mortgages Will Curb Riskier Lending

Moody’s says last Friday, the Australian Prudential Regulation Authority (APRA) announced new measures to restrict growth in riskier mortgage loans, including limiting the origination of interest-only mortgages, particularly those with high loan-to-value (LTV) ratios. On Monday, the Australian Securities Investments Commission (ASIC) announced that it will closely monitor lenders and mortgage brokers to ensure they are not inappropriately recommending more expensive interest-only loans to borrowers.

The new measures are credit positive for Australian banks, residential mortgage-backed securities (RMBS) and covered bonds because they will curb growth in riskier mortgage loans amid rising house prices and high household indebtedness. The measures include limiting the flow of new interest-only mortgages by banks to 30% of total new residential mortgage lending. Banks also will be required to have internal limits on the volume of interest-only lending at LTV ratios of more than 80% and ensure that there is strong justification for any interest-only loan with an LTV of 90% or more.

Interest-only loans accounted for 38% of total housing loan approvals in December 2016 and for more than 30% of total housing-loan approvals every month since June 2009 (see Exhibit 1). Housing investment loans, which are often interest-only loans, accounted for 35% of total housing loan approvals as of December 2016. In the RMBS sector, interest-only loans account for 35% of the mortgages backing the deals we rate.

We expect banks to raise interest rates on interest-only loans to reduce growth in this segment and support their net interest margin from ongoing price competition for lower-risk loans and stable deposits. When APRA introduced limits on housing investment loans in December 2014, banks responded by raising interest rates on such loans. In addition to the new limits on interest-only loans, APRA instructed banks to ensure that growth in housing investment loans remains “comfortably” below the 10% limit introduced in December 2014. APRA advised that banks will no longer have leeway to exceed this growth speed limit and that any breach will immediately prompt a review of the offending bank’s capital requirements. This contrasts with APRA’s original guidance, under which the 10% cap was not a hard limit.

APRA also announced that it would monitor the warehouse facilities that banks use to fund non-bank lenders. APRA does not regulate non-bank lenders, but monitoring the warehouse facilities will effectively allow the regulator to influence non-banks’ mortgage underwriting standards and promote the overall stability of the financial system. Non-bank lenders have increased housing investment lending since the introduction of the 10% limit on such loans (see Exhibit 1).

Although the APRA’s and ASIC’s measures add a layer of protection against a house price correction for banks, RMBS and covered bonds, it remains to be seen how effective these measures will be amid moderating house price appreciation, particularly when low interest rates continue to support housing demand. As Exhibit 2 shows, house prices have continued to rise, despite previous measures to slow the housing market.

APRA’s and ASIC’s latest measures and interest rate increases by banks on interest-only loans will slow demand for housing, but we continue to expect house prices in Australia to rise amid low interest rates. Although low interest rates will continue to support borrowers’ capacity to service their debt, rising house prices, in combination with high household leverage and low wage growth, remain risks for banks, RMBS and covered bonds.

Basel Committee’s Adverse Assessment of G-SIBs Risk-Reporting Practices Is Credit Negative

Moody’s says last Tuesday, the Basel Committee on Banking Supervision reported that most global systemically important banks (G-SIBs) have an unsatisfactory level of compliance with the Basel Committee’s principles for effective risk data aggregation and risk reporting.

This assessment is credit negative for G-SIBs because it signals that most still do not have the appropriate quality of risk management practices and decision-making processes that the Basel Committee identified as important following the 2007-09 global financial crisis. The Basel Committee indicated that it is critical for banks and their supervisors to make the full and timely implementation of its principles a priority.

The Basel Committee cited a wide range of examples in which G-SIBs failed to meet the principles. These examples include the following:

  • A lack of structured policies and frameworks to consistently assess and report risk data aggregation and risk reporting implementation activities to the board and senior management.
  • Risk data aggregation and risk reporting policies not approved or fully developed across the global organization.
  • Incomplete IT infrastructure projects aimed at improving data quality and controls by unifying disparate or legacy IT systems
  • Various data quality control deficiencies in areas such as reconciliation, validation checks and data quality standards.
  • Treating implementation of the principles as a onetime compliance exercise rather than a dynamic and ongoing process.
  • Incomplete integration and implementation of bank-wide data architecture and frameworks (e.g., data taxonomies, data dictionaries and risk data policies).
  • An overreliance on manual processes and interventions to produce risk reports, which risk inhibiting a G-SIB’s ability to produce reports quickly in crisis situations.
  • Difficulties in executing and managing complex and large-scale IT and data infrastructure projects, such as resources and funding issues and deficiencies in project management.
  • Static risk management reporting frameworks that do not take full account of strategic planning decisions such as risks pertaining to merger and acquisition activities.
  • An inability to monitor emerging trends through forward-looking forecasts and stress tests.

According to the Basel Committee, half of the G-SIBs were materially non-compliant with, or had not implemented, the principle for the design, building and maintenance of a data architecture and IT infrastructure that fully supports risk data aggregation capabilities and risk-reporting practices. More than half of the G-SIBs involved in the Basel Committee’s assessment were largely or fully compliant with each of the other principles. The report provides details of compliance among the G-SIBs but does not identify specific compliance details of each G-SIB.

The Basel Committee’s report focused on 30 global banks from around the world that were designated as G-SIBs in 2011 or 2012 and which were subject to a January 2016 implementation deadline.

The key challenges that G-SIBs faced when implementing the principles were technical issues and problems determining materiality thresholds. Only one G-SIB achieved full compliance with all principles by the January 2016 deadline, and the committee expected another to have achieved full compliance by the report’s publication date last Tuesday. The Basel Committee expects 24 G-SIBs to achieve full compliance by the end of 2018, while it does not expect four to be fully compliant until a later date.

Supervisors plan to communicate details of the assessment results to G-SIBs’ boards of directors and senior management by June 2017. Supervisory measures that are available include requests for specific remediation action plans and deadlines, independent reviews, increasing supervisory intensity, imposing capital add-ons and restricting business activities.

Deutsche Bank’s To Raise €8 Billion Capital And Tweaks Strategy

From Moody’s

On Sunday, Deutsche Bank AG announced an €8 billion fully underwritten common equity capital raise and some major course corrections to its 2020 strategic plan. These measures, on top of the firm’s progress in de-risking its balance sheet, are positive for DB bondholders. Most importantly, the capital raise gives DB more time and financial leeway to achieve the revised 2020 plan, although sustainable improvement to the bank’s credit strength and ratings will depend on the success of its ongoing reengineering. With plenty for management still to do, capital and liquidity protection and strong strategic execution will continue to drive DB’s creditworthiness this year.

The fully underwritten €8 billion equity capital raise will increase DB’s fully loaded common equity Tier 1 ratio by about 200 basis points to more than 14% pro forma as of year-end 2016, significantly improving its capital position relative to its closest global investment bank peers, especially considering the reduction in tail risk resulting from a settlement with the US Department of Justice announced in late 2016.

The capital raise is a powerful response to the challenges DB faced in 2016, and will allow the bank to pursue business and revenue growth more assertively following losses in 2016 that hindered efforts to strengthen and stabilize profitability and led to some customer and counterparty attrition. The settlement with the Justice Department has helped alleviate concerns, and momentum has picked up in many businesses this year, aided by improved market conditions.

Along with the capital raise, DB announced five key components to the latest recalibration of its strategic plan. They are the following:

  • Retain, rather than dispose of, Deutsche Postbank AG and merge it with DB’s domestic operations, thereby eliminating the Postbank ring-fencing, which would make retail liquidity more fungible and increase the potential for cost efficiencies
  • An initial public offering of a minority stake in Deutsche Asset Management to provide a new share currency that DB can use for retention and recruitment of investment management talent and for potential expansion
  • Reconfigure the existing Global Markets, Corporate Finance and Transaction Banking businesses into a single Corporate and Investment Banking division to generate additional cost savings and pursue a strategy more focused on cross-selling to real economy corporate clients
  • Some senior management changes, including the creation of two deputy CEO positions
  • Board approval of upcoming Additional Tier 1 coupons and an intention to reinstate the common dividend at a rate of €0.11 per share in May 2017

Management indicated further restructuring costs of approximately €2 billion through 2020 and a plan to establish a legacy portfolio of approximately €46 billion of risk-weighted assets, mostly in the form of legacy rates and credit positions and other non-core assets.

The decision to retain, rather than dispose of, Postbank is a major strategic reversal. If approved by regulators, the plan to integrate Postbank into DB’s existing German private and commercial banking and wealth management businesses may eventually bring bondholder benefits in the form of fungible liquidity across the bank, and a greater contribution of earnings from German retail banking, bringing more balance to the business mix. Streamlining and refocusing these businesses will help DB build leaner, more profitable franchises that more closely match its long-term strategic goal to simplify and de-risk the bank while revitalizing its operating platform and processes.

At this stage, however, we think large cost savings will prove difficult to achieve. In 2016, DB reported an 84% cost-to-income ratio for Postbank and an 83% cost-to-income ratio for the Private, Wealth & Commercial Clients segment, illustrating the formidable execution challenge the bank will face to reach its 65% target. The task is further complicated by the fact that Postbank owns BHW, a savings and loan association whose business model is particularly challenged by the low interest rate environment.

Germany’s Overvalued Real Estate Market Poses Risks for Banks and RMBS

From Moody’s

Last Monday, the Deutsche Bundesbank, Germany’s central bank, reported that residential real estate prices in German cities are overvalued by 15%-30% relative to fundamental measures of value, with the large cities at the upper end of the range (see Exhibit 1). Such overvaluation is credit negative for banks with concentrated retail mortgage books in urban areas, banks with large retail mortgage franchises and residential mortgage-backed securities (RMBS). Overvaluation creates the risk of losses if foreclosed properties backing mortgage loans are sold after a fall in house prices. The credit effect for covered bonds is limited owing to the statutory protection provided by Germany’s covered bond law (Pfandbrief Act).

For banks, the risk lies in their exposure to retail mortgages if a price correction occurs once interest rates rise materially, along with an acceleration in new housing loans originated in the past two years and margins that have shrunk. Although the combination of these factors in and of themselves do not immediately lead to higher defaults owing to the long-term fixed-rate nature of German residential mortgages, a lower recovery value following a price correction in a foreclosure would require the banks to increase cash provisions on defaulted exposures.

Bundesbank data also show that over the past two years, German banks have increased their new lending volumes by 20% versus the average origination volume during 2009-14 (see Exhibit 2). Hence, if residential property prices were to fall following an increase in interest rates or because of supply-demand imbalances, banks would face meaningful loan-loss provisions in case of default. If residential property prices were to retreat to 2010 levels, we would expect the share of loans with loan-to-value ratios (LTV) of more than 100% to increase to more than 40% of all outstanding mortgages.

RMBS would be negatively affected if house prices were to correct because loss severities (the proportion of the loan not covered by the proceeds from selling the property) would rise. German RMBS typically contain loans originated at high LTVs of 90%,6 on average, with some at above 100%. Deleveraging and house price increases in recent years have resulted in current market price LTVs averaging 55%.7 However, this ratio is primarily driven by one transaction (Pure German Lion RMBS 2008). For instance, EMAC-DE transactions and Kingswood Mortgages have LTVs of 80% on average.

The mortgage covered bonds of Sparkasse KoelnBonn and Hamburger Sparkasse (all rated Aaa) are most exposed to a potential correction of urban residential real estate prices. Both programs have a large share of residential and multifamily mortgage loans in the cover pools, and these issuers focus mortgage loan underwriting on urban areas. Nevertheless, German Pfandbrief are well protected against a potential fall in house prices. The 60% loan-to-lending-value threshold prescribed in the Pfandbrief Act ensures that only loan parts equal to the first 60% of a property’s lending value (defined in the act as the long-term sustainable property value excluding any speculative price components) are eligible for cover pools. The Pfandbrief Act also stipulates that property valuations are not adjusted upward after loan origination in case of property price increases, providing a buffer against price declines if borrowers default on their mortgage loans.

Low VIX and Thin Spreads Could Be on Thin Ice

From Moody’s.

The February 1 FOMC meeting minutes noted two interrelated developments. First, the narrowing by “corporate bond spreads for both investment- and speculative-grade firms” to widths that “were near the bottom of their ranges of the past several years.” Secondly, some FOMC members were struck by how “the low level of implied volatility in equity markets appeared inconsistent with the considerable uncertainty attending the outlook for such policy initiatives.”

Thus, some high-ranking Fed officials sense that market participants are excessively confident in the timely implementation of policy changes that boost after-tax profits. And they may be right, according to Treasury Secretary Steven Mnuchin’s recent comment that corporate tax reform legislation may not be passed until August 2017 at the earliest. The ongoing delay at remedying the Affordable Care Act warns of a possibly even longer wait for corporate tax reform and other fiscal stimulus measures.

Treasury bond yields declined in quick response to the increased likelihood of a longer wait for fiscal stimulus. Lower benchmark yields will lessen the equity market’s negative response to any downwardly revised outlook for after-tax profits. Provided that profits avoid a replay of their year-to-year contraction of the five quarters ended Q2-2016 and that interest rates do not jump, a deeper than -5% drop by the market value of US common stock should be avoided.

The importance of interest rates to a richly priced and supremely confident equity market cannot be overstated. In fact, the rationale for an unduly low VIX index found in the FOMC’s latest minutes contained a glaring error of omission. Inexplicably, no mention was made of how expectations of a mild and thus manageable rise by interest rates have helped to reduce the equity market’s perception of downside risk. An unexpectedly severe firming of Fed policy would doubtless send the VIX index higher in a hurry.

Moreover, the FOMC’s latest minutes failed to comment on the close linkage between the now below-trend spreads of corporate bonds and an exceptionally low VIX index. As inferred from long-term statistical relationships, the VIX index now supports the possibility of corporate bond yield spreads that are much narrower than what is suggested by the default outlook. For the purpose of quantifying the latter, an aggregate version of expected default frequencies will be employed.

VIX Index and high-yield EDF metric differ on risk

Though the calculations of both the VIX index and EDF (expected default frequency) metrics are sensitive to asset price volatility, the messages delivered by each measure of risk can differ significantly. The 0.72 correlation between month-long averages of the VIX index and the aggregate EDF metric of US/Canadian high-yield issuers is statistically significant, but it is also far from perfect. For example, despite their relatively strong positive correlation, the VIX index and the high-yield EDF occasionally move in different directions.

Since the January 1996 inception of the average high-yield EDF metric, the medians during business cycle upturns were 3.7% for the high-yield EDF and 17.9 for the VIX index. Recently, the high-yield EDF nearly matched its median of all recovery months since December 1995, while a VIX index of less than 13 was well under its comparably measured median. In other words, the high-yield EDF metric senses a good deal more financial market risk than the VIX index does.

By way of simple regression analysis, the high-yield EDF metric now predicts an 18.3 midpoint for the VIX index, which is far above a recent reading of 12.2. Conversely, the VIX index predicts a 2.7% midpoint for the high-yield EDF metric that is less than the actual EDF of 3.7%.

The two broad measures of risk also now predict two vastly different midpoints for the US high-yield bond spread. Compared to the high-yield spread’s recent 384 bp, the VIX index predicts a midpoint of 365 bp which is much thinner than the 462 bp predicted by the recent high-yield EDF and the EDF’s three-month trend.

Both cannot be right. Nevertheless, the modest outlook for 2017’s profits from current production suggests that the EDF’s predictions for the VIX index and the high-yield spread may prove to be more accurate than the VIX index’s projections for the high-yield EDF metric and spread. However as noted earlier, the realization of modest profits growth may be sufficient for the purpose of warding off a deep slide by share prices provided that the effective fed funds rate finishes 2017 no higher than 1.13%, while the 10-year Treasury yield’s annual average for 2017 is no greater than 2.6%.

Leveraging Will Survive Corporate Tax Reform – Moody’s

Moody’s says analysts from a major bank believe that reducing the top corporate income tax rate from 35% to 20% will slow the average annual increase of US industrial company debt over the next 10 years from nearly 5% without a tax cut to roughly 2% with the tax cut.

However, what happened after the slashing of the top corporate income tax rate from 1986’s 46% to 1987’s 40% and, then, to 1988’s 34% questions whether prospective tax cuts will more than halve the growth of corporate debt over the next 10 years.

Nevertheless, business borrowing is likely to be noticeably lower if business interest expense is no longer tax deductible. Such tax-reform induced reductions in business borrowing will be most prominent among very low grade credits and during episodes of diminished liquidity, extraordinarily wide yield spreads for medium- and low-grade corporates, and exceptionally high benchmark borrowing costs.

The top corporate income tax rate probably will be cut from i 35% to either the 20% proposed by House Republicans or to the 15% offered by Trump’s team. Assuming, for now, the continued tax deductibility of corporate interest expense, a lower corporate income tax rate increases the after-tax cost of corporate debt. However, a reduction by the corporate income tax rate may add enough to after-tax income to more than offset the burden of a higher after-tax cost of debt. In addition, today’s relatively low corporate borrowing costs will mitigate the increase in the after-tax cost of debt stemming from a lowering of the corporate income tax rate.

Corporate debt sped past GDP and revenues despite tax cuts of 1987-1988
Thus, a lowering of the top corporate income tax rate probably will not have much of a discernible effect on corporate borrowing. Despite the lowering of the corporate income tax rate from 1986’s 46% to 34% by 1988, the ratio of debt to the market value of net worth for US non-financial corporations rose from 1986’s 38.6% to a mid-1994 high of 51.1%. Moreover, from year-end 1986 through year-end 1989, non-financial corporate debt advanced by 9.6% annually, on average, which was much faster than the accompanying average annual growth rates of 7.2% for nominal GDP and 7.0% for the gross value added of non-financial corporations.

The supposed de-leveraging effect of corporate income tax cuts was further challenged by how debt outran both the economy and business sales despite still elevated corporate borrowing costs. For example, Moody’s long-term Baa industrial company bond yield barely fell from 1986’s 10.73% average to the still costly 10.55% of 1987-1989, while a composite speculative-grade bond yield actually rose from 1986’s 12.44% to the 13.05% of 1987-1989.

It should be noted that the increase in the after-tax cost of debt was greater following 1987’s corporate income tax cut because of the much higher corporate bond yields of that time and yet corporate debt still grew rapidly. In stark contrast, recent yields of 4.74% for the long-term Baa-grade industrials and 5.96% for speculative-grade bonds are substantially lower, which, in turn, lessens the degree to which corporate income tax cuts discourage balance-sheet leveraging.

Is Overvaluation Risk Real?

From Moody’s.

VIX Is Low, Overvaluation Risk Is Not

Overvaluation does not preclude an even higher market value of common stock relative to current and expected corporate earnings. Moreover, provided that the now extraordinarily low VIX index stays under 11.8, a further narrowing by corporate bond yield spreads is likely. However, an increasingly overvalued equity market favors a higher VIX index.

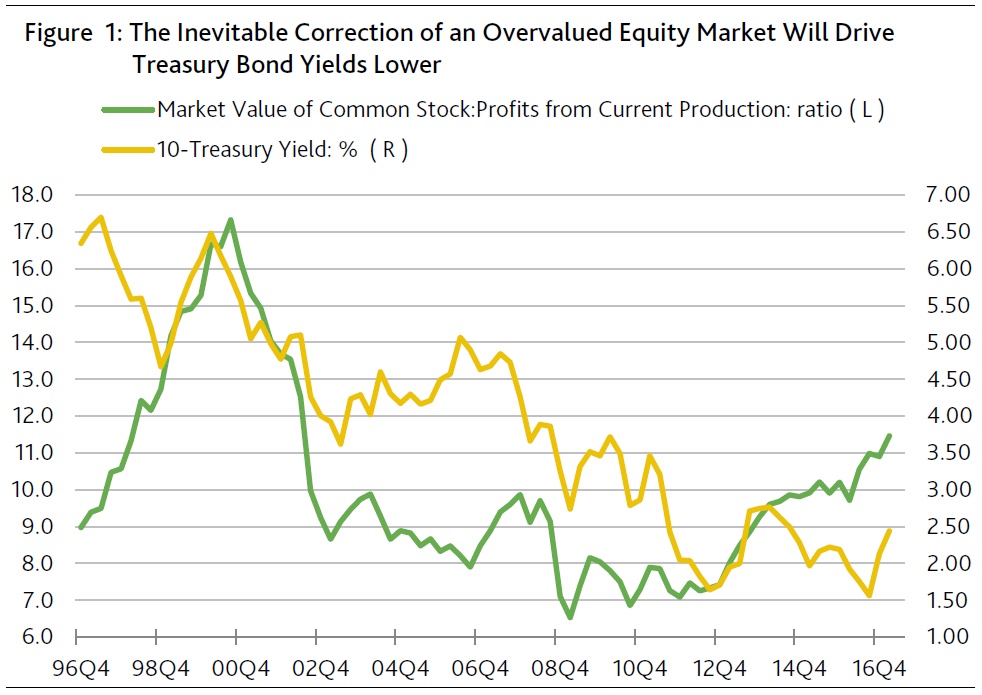
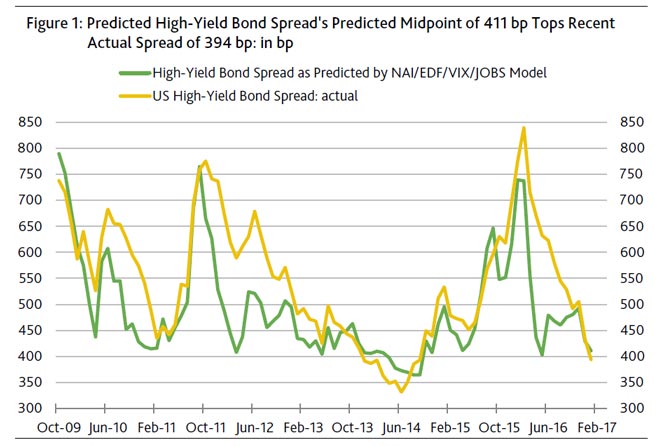
A convincing explanatory model for the high-yield bond spread employs measures of default risk and business activity, in addition to the VIX index. This model recently predicted a 411 bp midpoint for the high-yield spread, which eclipses its recent actual gap of 394 bp. By the way, the latter is the thinnest high-yield spread since September 2014.

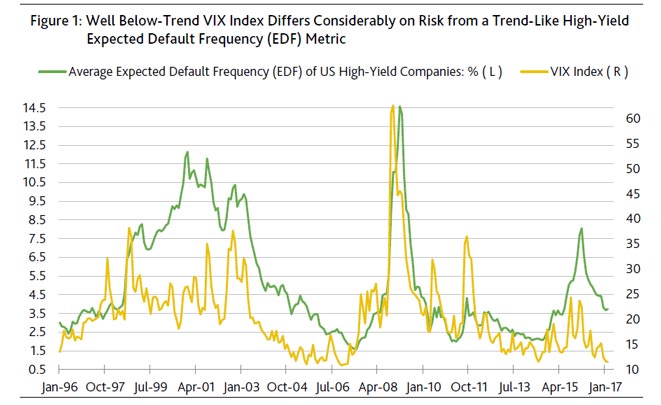
What is now the lowest predicted midpoint since April 2015 owes much to an ultra-low VIX index. After removing the VIX index from the explanatory model, the predicted midpoint for the high-yield spread widens to 456 bp. (Figure 1.)

Record highs for stocks, not so for profits

For the first time ever, the blue-chip Dow Jones Industrial average broke above 20,000. Meanwhile, the market value of all US common stock as measured by the Wilshire Index set a new record high.

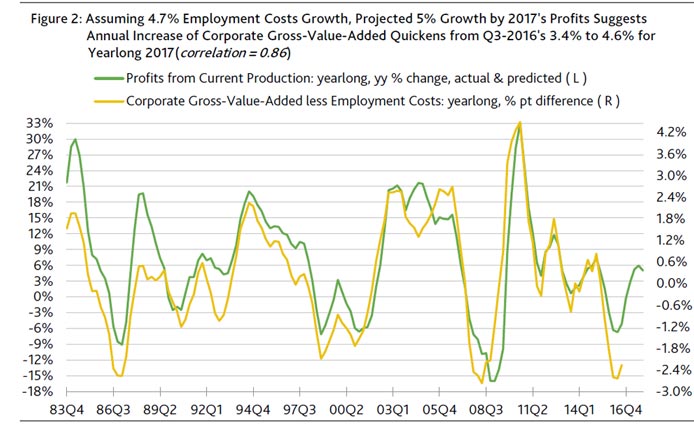
Nevertheless a popular measure of core profits, though improving, remains well under its apex. Since the moving yearlong estimate of pretax profits from current production peaked at the end of March 2015, the market value of US common stock has climbed higher by 10%. By contrast, the consensus estimates that for the year-ended March 2017, core pretax profits will still trail March 2015’s zenith by -5%. Moreover, the consensus does not expect yearlong profits to eclipse its record high until 2018’s second quarter.

As inferred from the different directions taken by share prices and profits since March 2015, the US equity market is richly priced, if not significantly overvalued. However, overvaluation does not promise impending doom for share prices.

For example, during 1998-2000’s stock market frenzy, though overvaluation first resembled today’s excesses in 1998’s second quarter, the market value of US common stock continued its ascent until March 2000 despite becoming increasingly overvalued. Amazingly, notwithstanding the accompanying -7% drop by yearlong profits from December 1997’s peak, the market value of US common stock managed to soar by a cumulative 49.5% from 1997’s final quarter through the first quarter of 2000.

Not surprisingly, March 2000’s unprecedented overvaluation of equities set the stage for a cumulative -43% plunge to October 2002’s bottom. Granted that today’s overvaluation falls considerably short of the excesses of late 1998 through early 2000, buying into an overvalued market necessarily entails above-average risk.

Based on the historical record, the current rally may not expire soon. Absent another extended bout of profits deflation, the US equity market is likely to set new records regardless of today’s overvaluation. For now, the consensus expects pretax operating profits to grow through 2018.
Interest rate risk now poses the biggest danger to stocks.

Nevertheless, substantially higher interest rates could temporarily drive the market value of US common stock down by at least -5%. Sharply higher interest rates previously outweighed the positive effect of profits growth and temporarily sank share prices in 1994 and late 1987. In both instances, deep declines by interest rates allowed profits to re-assume its leading role as the primary driver of equity valuation.

Incredibly, 1987’s outsized 19% annual advance by core profits was not enough to prevent a stock market crash of frightening severity. In late 1987, the market value of US common stock plunged by as much as -27% from its then record high largely because of a lift-off by the 10-year Treasury yield from a January 1987 average of 7.08% to the 10.36% of October 17, 1987.

In fact, it was at the morning of October 19, 1987’s infamous -18% daily plummet by the market value of US common stock that the benchmark Treasury yield was last above 10%. Who would have thought back then that 30 years later markets would fret over the possibility of a 3% benchmark Treasury yield?

Regarding 1994’s far less dramatic episode, a climb by the 10-year Treasury yield’s month-long average from October 1993’s 5.3% to April 1994’s 7.0% helped to sink the market value of common stock by -5.3% from its then record high despite an accompanying 19% annual advance by profits.

Do not underestimate the power of sharply higher benchmark interest rates to pummel share prices. The equity market sell-offs of both 1994 and 1987 occurred despite significant narrowings by medium- and low-grade bond yield spreads. Nor did the declining trends of high-yield defaults offset the selling pressure arising from fast rising Treasury yields.

As inferred from what occurred in 1987 and 1994, the 10-year Treasury yield may need to approach 3% for there to be at least a 50% likelihood of a 5% drop by equities amid profits growth. However, the record also makes clear that an especially disruptive ascent by benchmark yields is likely to be reversed. In order to stabilize share prices, the 10-year Treasury yield’s month-long average fell to 8.21% by February 1988 and to 5.65% by January 1996.

VIX Index stays low despite risks surrounding overvalued equities

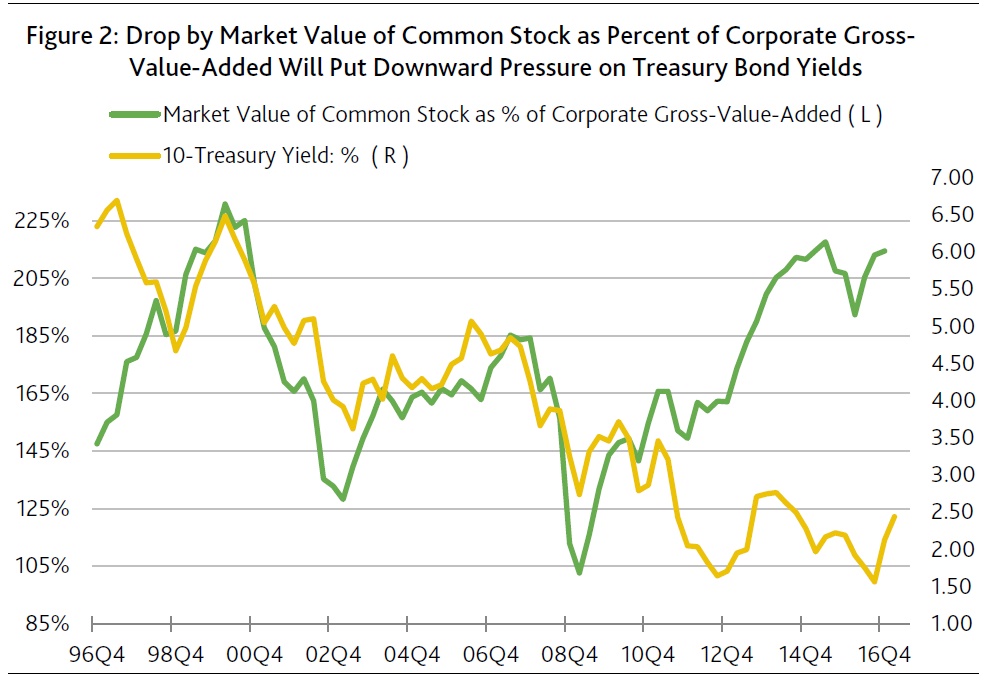
Overvaluation warns of a painful correction in the event market sentiment worsens considerably. In recognition of ample downside risk, the VIX index has tended to be greater in richly priced equity markets, where above-trend VIX indexes have typically been joined by above-average corporate bond yield spreads. (Figure 2.)

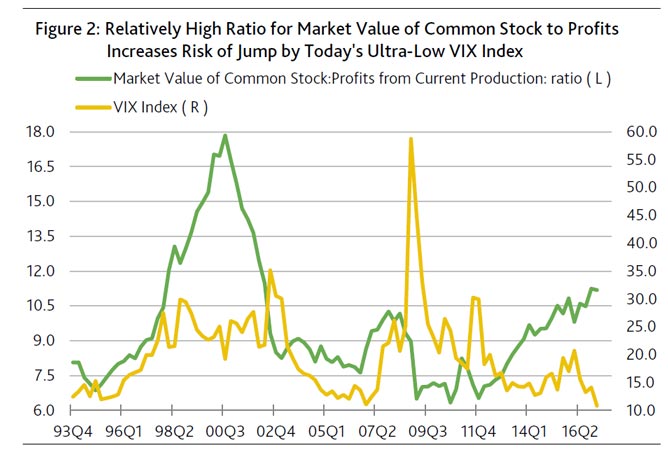
In the current market, however, the VIX index has broken from the norm and remained unexpectedly low amid elevated ratios of equity’s market value to core profits. The market value of US common stock recently approximated 11.2-times the yearlong estimate for pretax profits from current production for the highest such ratio since the 11.5:1 of 2002’s second quarter. It was in 1998’s first quarter that common equity’s market value last climbed up to 11.2-times core profits. At that time, the VIX index averaged 21.3, which was far above its recent 10.8. Similarly, when the ratio of common equity’s market value to profits rose to Q4-2007’s previous cycle high of 10.3:1, the VIX index averaged a well above-trend 22.1. Thus, the longer elevated price-to-earnings ratios persist, the more likely is a climb by the VIX index that ordinarily is accompanied by wider corporate yield spreads.

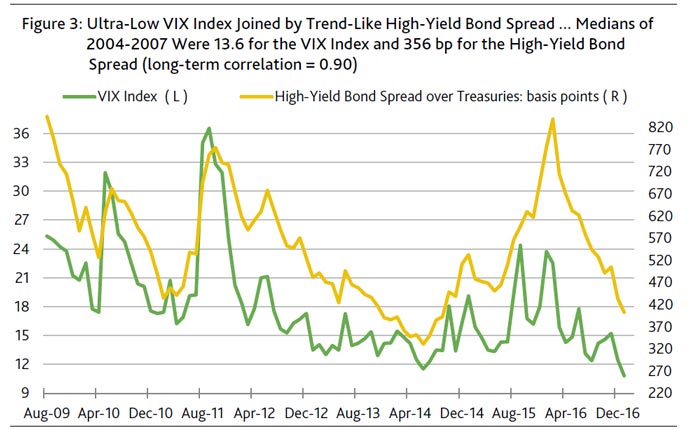
On January 24, 2007 the VIX index closed at a record low 9.89. Ten years later the VIX index closed at the 10.83 of January 25, 2017. The latter was its lowest finish since the 10.32 of July 3, 2014, or when the high-yield bond spread was an exceptionally thin 322 bp. However, even that gap was wider than the 276 bp of January 24, 2007. Do not be surprised if an ultra-low VIX continues to lead the high-yield bond spread lower.

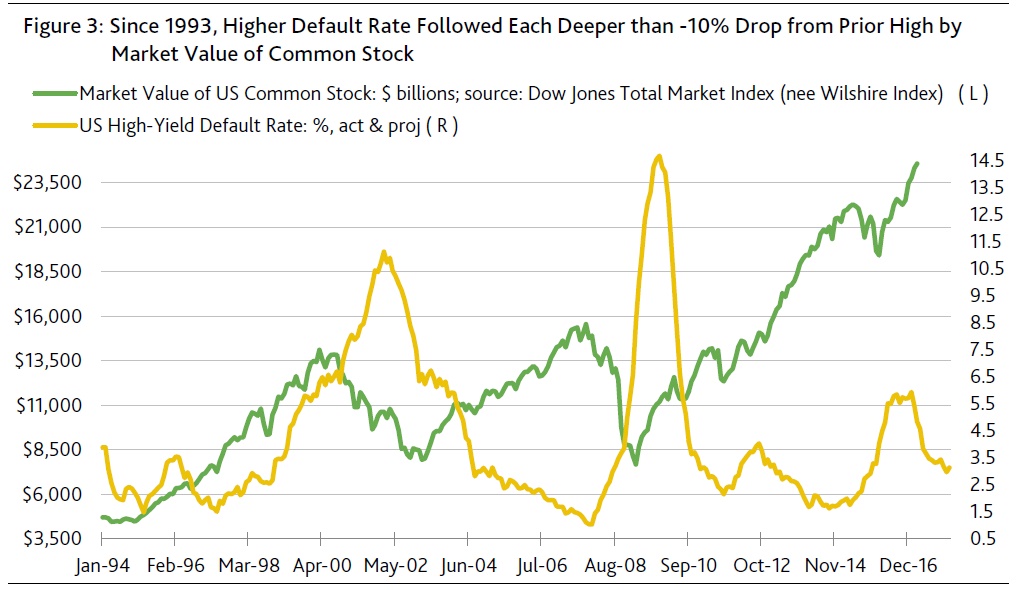
According to the historical statistical relationship, by itself, the recent VIX index of 10.9 predicts a 326 bp midpoint for the high-yield bond spread, which is much thinner than the recent 394 bp. As shown in Figure 3, exceptionally low readings for the VIX index have tended to prompt narrowings by the high-yield spread throughout the current business cycle upturn. (Figure 3.)


US Deregulation Seen to Spur to Growth, Trim Risk

Moody’s says Washington’s transfer of power is complete. Very high probabilities can now be assigned to lowering the 35% corporate income tax rate, easing federal business regulations, and a major overhaul of the US government’s role in health insurance.

Deregulation will supply stimulus at no immediate cost to the taxpayer. Nevertheless, deregulation reintroduces systemic risks that could prove costly over time.

A relaxation of federal business regulations and changes in government-mandated health care programs may supply an unexpectedly large lift to business activity. Not only will overhead costs decline, but businesses will be able to allocate a greater portion of their scarce resources to an enhancement of their product offerings. Success at the latter will expand attractive job opportunities.

Regarding a possible reformulation of Dodd-Frank, diminished regulatory burden will increase the supply of mortgage credit and business credit. Mortgage yields and business borrowing costs may be lower than otherwise, helping to offset the upward pressure put on private-sector borrowing costs by a higher fed funds rate and higher Treasury bond yields.

In addition, a softening of Dodd-Frank would enhance the ability of banks to make markets in corporate bonds and leveraged loans, where the availability of buyers for riskier debt is of critical importance during episodes of systemic financial stress. Corporate credit spreads have been wider than otherwise because of worry surrounding market depth in a time of stress.

Paradoxically, despite fears that a relaxation of regulations will add to systemic risk, a widely followed measure of business credit risk — the high-yield bond spread — has narrowed considerably from an election day, or November 8, close of 515 bp to a recent 409 bp. Indeed, high-yield bonds have far outperformed higher-quality bonds since Election Day. Unlike the 10-year Treasury yield’s jump from November 8’s 1.86% to a recent 2.43% and the rise by an investment-grade corporate bond yield from 3.00% to 3.34%, a composite speculative-grade bond yield sank from November 8’s 6.53% to a recent 5.96%.

As inferred from the high-yield bond market’s upbeat response to the Republican sweep, the outgoing administration’s efforts to reduce systemic financial risk may have weighed so heavily on business activity and the efficient functioning of financial markets that they increased perceived default risk on a company by company basis. How ironic that an anticipated relaxation of financial and other business regulations has lessened perceived default risk considerably.

Room for growth may still go unfilled

And there is plenty of room to expand business activity without the risk of a potentially destabilizing upturn by price inflation. Rates of resource utilization are now exceptionally low for the seventh year of an economic recovery. If demand materializes, the Trump administration’s goal of 3% to 4% real growth for the US economy may at least be temporarily achievable.

However, given the financially stressed condition of many households both at home and abroad, as well as the diminished spending proclivities of the aging populations of advanced economies, spending may fall short of what is needed to sustain 3% to 4% growth over a yearlong span.

Moreover, real GDP growth of at least 3% may not be a recurring phenomenon. Long-term economic growth may be constrained to a pace closer to 2% if both the labor force and productivity continue to rise at rates that are well below their respective long-term trends.

Consensus outlook for profits requires faster than forecast GDP growth

Early January’s Blue Chip consensus projection of a 5.0% annual increase for 2017’s pre-tax profits from current production may be incompatible with the accompanying forecast of a 4.4% annual increase by 2017’s nominal GDP. Only if employment costs slow from their 4.7% annual climb of the year-ended September 2016 might nominal GDP growth of 4.4% deliver profits growth of 5.0%. However, if the recent 4.7% unemployment rate correctly indicates rising wage pressures, a deceleration by employment costs seems unlikely.

As inferred from the strong 0.87 correlation between the annual yearlong growth rates of corporate gross value added and nominal GDP, the consensus prediction of 4.4% nominal GDP growth favors a 4.1% annual gain for 2017’s corporate gross-value-added, where the latter is a proxy for corporate revenues.

In terms of moving yearlong averages, the percentage point difference between the annual growth rates of gross value added less corporate employment costs generates a strong correlation of 0.86 with the annual growth rate of pretax profits from current production.
Combining 2017’s prospective annual increase of 4.1% for gross value added with 4.7% employment cost growth predicts a 2.5% midpoint for the annual increase of 2017’s pretax operating profits. To the contrary, the equity and high-yield bond markets may be pricing in faster growth rates of 4.9% for gross-value-added and 5% for employment costs, where such assumptions support a predicted midpoint of 5% for core profits growth. However, 4.9% growth by gross-value-added may require faster-than-forecast nominal GDP growth of 5%.

Profits growth is likely if capacity use rises

Fourth-quarter 2016’s comparatively low industrial capacity utilization rate of 75.3% amplifies 2017’s upside potential for earnings growth. After declining from a year earlier in each of the last seven quarters including Q4-2016, the capacity utilization rate is expected to increase annually in each quarter of 2017. If true, the return of profits growth in 2017 is practically assured.

The yearly percent change by pretax profits from current production shows a highly asymmetrical response to the capacity utilization rate’s yearly percentage point change. Since early 1979, 68, or 85%, of the year-to-year increases by the capacity utilization rate have been joined by a year-to-year increase for profits. In stark contrast, only 32, or 46%, of the span’s 70 yearly declines by the capacity utilization rate were accompanied by lower profits.

The fuller use of production capacity also bodes well for corporate credit. In terms of yearly changes, the high-yield bond spread narrowed for 63% of the months since mid-1987 showing an increase by the capacity utilization rate, while the spread widened for 66% of the months showing a decline by capacity utilization.
Still low rates of resource utilization suggest that the current recovery may prove to be a late bloomer in terms of realizing its full potential.