UK Lowers Banks’ Capital Buffer, a Credit Negative – Moody’s

Moody’s says that last Tuesday, the Bank of England’s (BoE) Financial Policy Committee (FPC) reduced the countercyclical capital buffer (CCyB) applied to banks’ UK risk-weighted assets to 0.0% from 0.5% as a result of expected softening in the UK economy following the UK referendum to exit the EU (Brexit). The reduced CCyB gives banks greater flexibility in providing credit to households and businesses, but reduces banks’ requirements to hold loss-absorbing capital, which is credit negative.

The 0.5% reduction of the regulatory capital buffers for UK banks in aggregate equates to £5.7 billion of capital. Given the BoE’s estimate of bank sector aggregate leverage of 4%, this allows for an increase in banks’ lending capacity of £150 billion. Such measures reduce the likelihood of a credit crunch and allow the UK’s financial system to absorb shock rather than amplify the negative effects on growth and investment from the uncertainty following the Brexit Referendum.

In 2015, net lending to the UK banking sector increased by around £60 billion, a small proportion of the additional lending capacity created by this reduction in capital requirements. Increasing the UK banks’ lending capacity will likely support their profitability, which we expect to be pressured by the low-rate environment, likely fall in demand for credit and an increase in credit impairments from the uncertainty around the UK’s vote to leave the EU.

Although the PRA and the FPC deem that the banks will still hold sufficient idiosyncratic and systemic risk capital to withstand a severe but plausible stress, these reductions in capital buffers will, if used to support lending, increase banks’ vulnerability to unexpected idiosyncratic and macroeconomic shocks. The effect will vary across UK banks, with leverage-constrained institutions less affected than those that are relatively more capital constrained. At 30 March 2016, the aggregate common equity Tier 1 ratio of the UK’s seven largest banks stood at 12.3%.

In March 2016, the FPC raised the CCyB to 0.5% effective March 2017 from 0.0%, with a 1% target for later in 2017, for the UK’s six largest banks1 in response to domestic credit risks, mainly related to an overheating housing market. Concurrently, to ensure there was no duplication in capital requirements, the FPC recommended reducing Prudential Regulation Authority (PRA) supervisory buffers (Pillar 2B) by 0.5%, offsetting the initial introduction of the CCyB. Despite this reversal in the decision to raise the CCyB, the BoE recommended to retain and bring forward the reduction in banks’ PRA buffer, to the extent the level of individual bank buffers is driven by macroeconomic versus idiosyncratic risk factors, thereby increasing available capital to support lending to businesses and households.

The CCyB is a macro prudential tool whereby the FPC adjusts bank capital requirements on a systemwide basis with the aim of dampening procyclicality of bank lending to the UK economy. This is intended to reduce the negative effects of boom and bust economic cycles, which are costly for banks and the wider
economy.

Although the CCyB may help avoid a credit crunch, amid a period of prolonged uncertainty around the UK’s future trade relationship with the EU, demand for credit is likely to be subdued, raising questions about the policy’s effectiveness on the real economy.

Brexit may more closely resemble Y2K than Lehman – Moody’s

Moody’s latest research note underscores that Brexit, essentially, is “a little local difficulty.” Profits were made in the markets on volatility after the result of the vote was announced, but the fundamental risks are contained and different from the Lehman Brothers GFC trigger.

Thus far, Brexit has fallen considerably short of being the next Lehman Brothers. As far as the US is concerned, Brexit’s ultimate effect may closely resemble the impact of Y2K’s arrival, which did not impart the IT-related havoc that many had predicted.

For now, at least, Brexit lacks the enervating surge in actual and potential defaults that magnified the losses stemming from Lehman’s demise. Put differently, the latest jump in uncertainty lacks anything comparable to 2008’s extremely elevated incidence of mortgage foreclosures.

Thus, the swelling of credit spreads and seizing up of financial markets that ordinarily accompany a meaningful crisis have yet to materialize. Moreover, industrial commodity prices never sank in a manner that otherwise would confirm global distress.

Brexit has made champions out of astute traders. The big winners of the highly volatile past week included those who were long high-quality, long-duration credit and gold and short equities on the eve of June 23’s Brexit referendum. Not long thereafter, those who loaded up on equities toward the end of trading on June 27 emerged victorious.

Depending on timing, Brexit rewarded both bears and bulls. For example, after plunging by a cumulative -10.9% from the close of June 23 to the close of June 27, the Stoxx Europe 600 index subsequently rallied by +6.8% through June 30. Ironically, the UK’s FTSE 100 stock price index more than recovered from its -5.6% plunge of the two trading days following June 23’s Brexit vote with an +8.7% surge during the final three days of June.

The US equity market’s performance was in between the broad European stock price index and the UK. After sinking by -5.6% from June 23 through June 27, the market value of US common stock subsequently rebounded by +4.6% as of the early afternoon of June 30.

Are Current Dividend Payouts Sustainable?

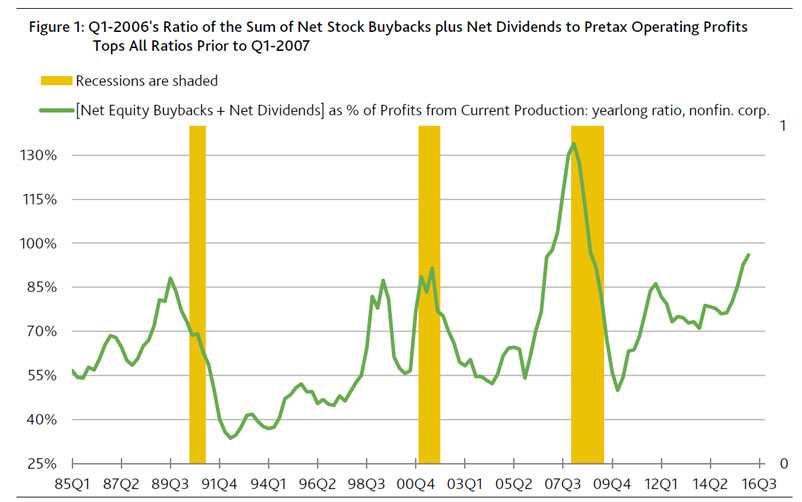
Interesting note from Moody’s today, making the point that companies cannot afford indefinitely to fund increases in shareholder compensation from corporate earnings, especially if earnings are flat to lower. The demands placed on earnings by shareholder compensation can be assessed by the ratio of the sum of net equity buybacks plus net dividends to pretax profits from current production (as derived from US government data). Moody’s call this the shareholder compensation ratio.

Moodys-24-JunDuring the year-ended Q1-2016, the sum of net equity buybacks plus net dividends approximated 96% of pretax profits from current production for US nonfinancial corporations. The latter exceeded each comparably measured yearlong ratio prior to 2007.

Moreover, net stock buybacks plus net dividends averaged a smaller 67% of profits from current production during the three previous recoveries, wherein the ratios ranged from 61% for 1983-1990’s upturn, 55% for 1991-2000’s recovery, and 80% for 2002-2007’s upswing. Ratios of 85% or higher more than three years after the end of a recession tend to indicate either the late stage of a business cycle upturn or the presence of a recession.

During the mature phase of 2002-2007’s recovery, the ratio first broke above 85% in Q4-2006. A recession materialized after the shareholder compensation ratio climbed up from Q4-2006’s 95.4% to Q4-2007’s 130.2% of profits from current production. Though the climb by the ratio hardly triggered the Great Recession, it reflected a loss of financial flexibility that left businesses less capable of absorbing the shock of unexpectedly low profits.

An elevated shareholder compensation ratio reveals a reduction in the earnings that underpin corporate credit quality. In turn, the now exceptionally high shareholder compensation ratio warns of a limited scope for any narrowing by the US high-yield bond spread.

US Banks To Tighten Credit Impairment Reporting

US companies including banks, will have to reassess how financial statements report credit risks, and expected losses in current statements and future outlooks due to changes in accounting standards which were published last week and will be effective in 2020. The changes may also have an impact of capital requirements and reporting.  This is another step in the tighter regulation of the banking sector.

According to Moody’s, the US Financial Accounting Standards Board (FASB) published its Current- Expected-Credit-Loss model (CECL), a controversial and long-awaited expected-credit-loss model for financial instruments. CECL better aligns the recognition of credit losses with the economics of lending and investing. Additionally, the overall principle for CECL is easy to understand, reducing complexity in financial statements.

Although CECL applies to all companies that report under US generally accepted accounting principles (GAAP), it has the most material effect on bank financial statements because of the size of their loan portfolios. As of 31 March 2016, the loan portfolio of US commercial banks totaled $8.7 trillion. Banks will need to reassess the credit risk inherent in these loans to comply with CECL, in some cases requiring significant systems changes to incorporate forward-looking information.

When a bank first reports under CECL, provisions will significantly increase, reducing bank capital. In subsequent periods, however, provisions will only reflect changes to the bank’s estimated expected credit losses. US regulators supported CECL throughout its development, but it remains to be seen whether the new rules will affect regulatory capital requirements and nonperforming loan disclosures.

The main changes are:

Incurred versus expected credit losses. An expected-credit-loss model improves the usefulness of information in financial statements for investors. Currently, banks must wait until credit losses are probable or incurred before recognizing provisions for contractual cash flows that will not be collected on loans. On the day a loan is originated, CECL requires banks to recognize in earnings a provision that reflects management’s expectation of lifetime credit losses incorporating all reasonable and supportable information, including forward-looking information. Therefore, under CECL, the carrying value of loans measured at amortized cost on the balance sheet will reflect the net amount a bank expects to collect.

CECL has been heavily criticized because it requires a loss to be recognized upon loan origination, which many believe is counterintuitive since credit risk is typically considered in pricing. For credit analysis, however, we believe this is appropriate for banks: history has shown that in a pool of performing loans, not all contractual cash flows will be collected.

Detailed and transparent credit quality disclosures. Along with the CECL model, the FASB’s new credit loss standard published Thursday expands current credit quality disclosures by requiring banks to disaggregate their loans and receivables not only by class and credit characteristics but also by vintage.

These disclosures will be particularly helpful in understanding how credit quality has changed from period to period.

US GAAP and International Financial Reporting Standards (IFRS) have different expected credit loss models, a negative for users of financial statements. Although both CECL and the new IFRS impairment model are expected-credit-loss models, their principles are not fully aligned, which does not aid in global comparability of bank financial statements. IFRS 9, the financial instruments standard published in July 2014,4 requires recognition of lifetime expected credit losses once financial assets exhibit a significant increase in credit risk. For performing financial assets, an amount equal to 12-month expected credit losses is recognized. As such, CECL results in earlier recognition of credit losses on performing loans compared with IFRS 9. In addition, financial reporti g under CECL will be easier to understand because provisions in each reporting period will only reflect changes in the bank’s estimate of lifetime expected credit losses. Provisions under IFRS 9 will include a cliff effect for loans that exhibit credit deterioration but were previously performing.

Is The US Heading For A Recession?

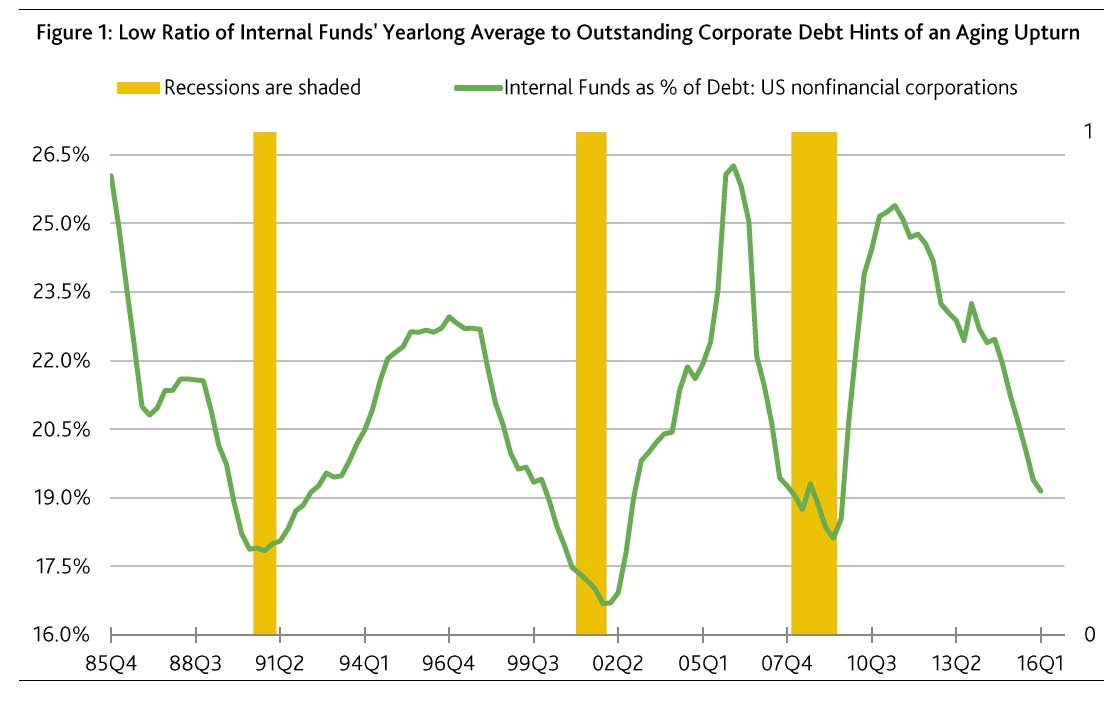
A research note from Moody’s suggests that based on an analysis of aggregate measures of corporate credit quality, the current business cycle in the US is in its latter stage. As a result, recession may be unavoidable.

They say the outlook for the credit cycle is likely to deteriorate, barring improved showings by cash flows and profit, where enhanced prospects for the latter two metrics depend largely on a sufficient rejuvenation of business sales. Their analysis suggests that recessions materialise within 12 months of the yearlong ratio of internal funds to corporate debt descending to 19.1% in Q1-2008, Q1-2000 and Q4-1989. As derived from the Federal Reserve’s Financial Accounts for the US, or the Flow of Funds, the moving yearlong ratio of internal funds to corporate debt for US none-financial corporations has eased from Q2-2011’s current cycle high of 25.4% to the 19.1% of Q1-2016.

US-CreditThey say, “if revenue growth does not quicken appreciably, internal funds will continue to lag debt and recession may be avoidable. Given the now mature phase of the current upturn, an enhancement of credit quality requires simultaneous accelerations of revenues and cash flows. By itself, slower growth by corporate debt may not be enough to extend the upturn”.

Re-Proposed and Strengthened Pay Rules for US Banks

From Moody’s

Last Monday, six US federal regulators1 proposed rules to prohibit financial institutions from offering incentive-based compensation that could encourage excessive risk-taking by senior executive officers and other so-called significant risk takers. The rules, mandated by the Dodd Frank Act, will apply to a broader range of employees than the regulators’ 2011 joint proposal, which was never implemented. The new proposal introduces more stringent requirements for incentive compensation deferral and compensation recoupment (i.e., clawback).

The rule would apply to banks, asset managers, broker-dealers and other financial institutions with total consolidated assets of more than $1 billion. Larger institutions would have more stringent requirements in the new tiered approach, which classifies institutions into Level 1, those with $250 billion or more in assets, which would have the most stringent standards; Level 2 institutions with $50-$250 billion would have less stringent standards; and Level 3 institutions with $1-$50 billion (Level 3) would have easier requirements.

The revised rules apply to a larger swath of employees than the 2011 proposal. For example, the definition of “senior executive officers” has been expanded to cover roles including chief compliance officer, chief credit officer and the heads of control functions. The definition of “significant risk takers” such as loan officers and underwriters would also include employees who receive at least one-third of their pay from incentive compensation (excluding senior executive officers) and meet certain compensation tests, such as being among the top 5% of highest-compensated employees.

At Level 1 banks, the largest banks, senior executives would be required to defer at least 60% and other key risk takers at least 50% of their annual incentive compensation for at least four years. At Level 2 institutions, senior executives would defer 50% and other key risk takers 40%, for at least three years. Most large banks that require deferrals defer at least half of senior executives’ incentive compensation for three years, but few use a four-year period. During the deferral period, the awards would be subject to reduction and forfeiture in various adverse outcomes, including poor financial performance. Reducing compensation before it has vested is easier than clawing it backing it after it has been paid out.

To cover compensation that has already been paid out, tough clawback policies apply to 100% of incentive-based compensation for up to seven years after the awards have vested in cases of misconduct, including fraud, intentional misrepresentation of information used to determine the individual’s bonus compensation, and misconduct that resulted in significant financial or reputational harm to the bank. Most banks already have clawback polices in place, but clawback periods rarely extend beyond three years, and then only at the largest banks.

Most aspects of the proposal are credit positive, but the mandatory deferral and vesting periods may be too short to cover risks that only become apparent over say seven to ten years, as with fines and litigation.

Other jurisdictions, including the UK and Switzerland, require longer minimum deferral, vesting, and clawback periods, which we view favorably.

Because the proposal is largely consistent with current practice and interagency guidance, we expect larger banks will have little difficulty implementing the rules, with the possible exception of strengthening clawback polices and expanding the scope of covered employees. Smaller banks may face more difficulty adapting to the changes since their compensation practices vary more widely.

Has housing in-affordability in Australia’s capitals peaked?

From Business Insider.

Australian housing affordability deteriorated over the past 12 months, but the worst may now be over.

That’s the view of Natsumi Matsuda, an analyst at Moody’s Investor Services, who notes that Australian two-income households spent an average 27.6% of their monthly income on mortgage repayments in the 12 months to March, up from 27.0% a year earlier.

“Affordability deteriorated in all capital cities, except Perth,” said Matsuda. “Sydney (35.6% of income) is the most unaffordable city, followed by Melbourne (30%).”

The chart below, supplied by Moody’s shows the percentage of household income spent on mortgage repayments in Sydney, Melbourne, Brisbane, Adelaide and Perth over the past decade.

“Nationally, affordability remains better than the average for the past 10 years. However, homeowners in Sydney are paying 1.7 percentage points more of their monthly incomes towards mortgage repayments than the average for the past 10 years,” notes Matsuda.

Despite the improvement over the past 12 months, he believes that housing costs may have peaked due to a pullback in housing prices (something that subsequently reversed in April according to Corelogic RP Data) along lower mortgage rates courtesy of the Reserve Bank of Australia’s rate cut earlier this week which took the official cash rate to a historic low of 1.75%.

She explains:

Although housing affordability deteriorated year-on-year, conditions began to improve in the three months to 31 March 2016, suggesting that repayment costs may have peaked for the time being. In fact, affordability improved in all Australian capital cities during this period, although the degree was not enough to head off the year-on-year deterioration.

The improvement over the three months to 31 March 2016 was driven by a pullback in housing prices. The Reserve Bank of Australia’s (RBA) cut to official interest rates on 3 May 2016 will have a further positive influence on housing affordability, though the extent of this impact will ultimately depend on whether there are any flow-on effects to the housing market, where lower rates can put upward pressure on prices.

The debate over housing in Australia — something of a constant nowadays — has intensified in recent weeks as both the Coalition and Labor debated negative gearing, with the government arguing that any changes could lead to a dramatic fall in house prices.

But yesterday prime minister Malcolm Turnbull appeared to suggest that if younger generations are locked out of the housing market, then it’s up to their wealthy parents to help them out, telling ABC radio presenter Jon Faine “you should shell out for them; you should support them, a wealthy man like you”.

While prices continue to trend higher, building approvals have also risen for two months in a row and now new home sales have bounced.

Housing Industry Association (HIA) figures released today show new property sales surged by 8.9% in March after seasonal adjustments, rebounding strongly following a 5.3% contraction in February. It was the largest percentage increase since January 2010.

Australian Major Bank Credit Metrics Under Pressure – Moody’s

From Business Insider.

Australia’s asset cycle has peaked, according to credit rating agency Moody’s Investor Services. And that means the risk weight capital our major banks hold will come under pressure.

The agency also says that the looming increase in risk weightings on the average mortgage risk weights as a result of the Australian banking regulator’s, APRA, edict that “risk weights for IRB banks will rise to at least 25%, from the current 15-18% level” will also put downward pressure on the majors CET1 (Common Equity Tier One) ratio’s.

The good news for the banks, their shareholders, and the Australian financial system is that Moody’s believes, based on its scenario and sensitivity analysis, that “the potential decline in the banks’ capital metrics as a result of changes to risk weights will be limited”.

Ilya Serov, Moody’s senior vice president, added in the report that:

Even in a highly stressed scenario, and before factoring in any potential for organic capital generation, the major banks’ CET1 ratios will remain above 8.0%, a level which is the combination of the regulatory minimum CET1 plus Capital Conservation and Domestic Systemically Important Bank (D-SIB) buffers.

That doesn’t guarantee the banks won’t have to raise more capital at some point. But it certainly suggests the work they have already done in raising capital in preparation for the changes in regulation will keep them above the 8% trigger level.

Under each of the scenarios Moody’s ran a comparison of the impact of the upper end of Australian banks 2009 experience when the corporate “impaired and past due exposure ratio” hit 2.5%. In the second scenario Moody’s took the average of the banks 2009 experience – as opposed to upper-end of experience as it’s base input. It then included the increase in mortgage weights into this scenario.

Moody’s says: “The key cyclical pressure on risk-weighted capital ratios will come from an upward revision in credit risk weights as asset quality weakens. This is a reversal of the situation which has existed since the GFC’s nadir in 2008/09 which with the ‘decline in the major banks’ CRWA, as asset quality improved after the global financial crisis, has been the primary organic driver of their improving risk-weighted capital ratios.”

While Moody’s stressed this was not a credit rating note in the end though the company still sounds pretty upbeat on the big banks capital positions.

“The moderate degree of deterioration in capital levels indicated by our sensitivity analysis is in line with our view that Australia’s major banks remain in a strong position to maintain their strong credit profiles against a likely weakening in their asset performance” Moody’s said.

Basel Committee’s Attempt to Classify Problem Bank Assets Would Aid Bank Analysis

From Moody’s.

Last Thursday, the Basel Committee on Banking Supervision (BCBS) published a consultative document on the classification of problem assets, including definitions of nonperforming exposures (NPEs) and forbearance. The lack of a consistent definition of these terms among countries and banks makes bank analysis complex and fuels scepticism of banks’ disclosures. Consistent definitions would aid investors and risk managers in their analysis of banks’ soundness.

The BCBS’ proposed definition of NPE incorporates the following characteristics:

  • NPE status applies to all credit exposures, including debt securities
  • All exposures to a given counterparty, including uncancellable off-balance-sheet exposures, are classified as an NPE if one transaction is classified as an NPE
  • Complementing 90-day past-due criteria with a qualitative assessment of debtors
  • Not considering the value of collateral when identifying an NPE
  • The ability to upgrade an exposure to performing, contingent on objective criteria

For forbearance, which has no formal international definition, the BCBS recommended a scope identical to the one used with NPEs, with clear identification of forbearance exposures concessionally granted to counterparties facing financial difficulties. The proposal also states that forborne exposures can be either performing or nonperforming, depending on the exposure’s status when the forbearance is extended. Exit from the forborne category would be based on objective criteria, and forbearance status should not result in a reduction in provision requirements.

The need for a single set of guidelines is the result of the BCBS’ assessment of the regulatory frameworks and supervisory practices of 28 jurisdictions. The analysis identified numerous variations, including loan categories based on an accounting layer in eight jurisdictions, on a regulatory layer in 10 countries, and on an ad hoc basis in the remainder. Meanwhile, banks in Asia and the Americas require that exposures classified as nonperforming have six to 12 months of performance before their classification is restored to performing, while in Europe banks are bound by a 12-month time frame. There are also differences in the treatment of collateral and the criteria for income recognition.

An internationally accepted definition of NPE would help improve the identification of such exposures and forbearance and result in more harmonization of banks’ supervisory reporting and public disclosures. A more precise identification of problem loans should force banks to shore up their capital base and reserves. We also expect that specific disclosure requirements in Pillar 3 reports that the BCBS intends to develop will strengthen market discipline. We note that the European Banking Authority’s definition of NPEs and forbearance, published in 2014 before the European Central Bank’s asset quality reviews, prompted some banks in the European Union to significantly increase their provision levels.

The global financial crisis provided evidence that proper categorisation of loans, or lack thereof, has material implications on banks’ provisioning and thus their capital. But for this guidance to be effective, BCBS members would need to fully embrace what would be a voluntary framework. It also remains to be seen whether the BCBS will set a timetable for its implementation and whether the Financial Stability Board would press G-20 members to adopt the framework. Absent these conditions being met, the likelihood of achieving material progress in this area would be slim.

Australia’s Focus on Spending Cuts Makes Balancing Budget Difficult – Moody’s

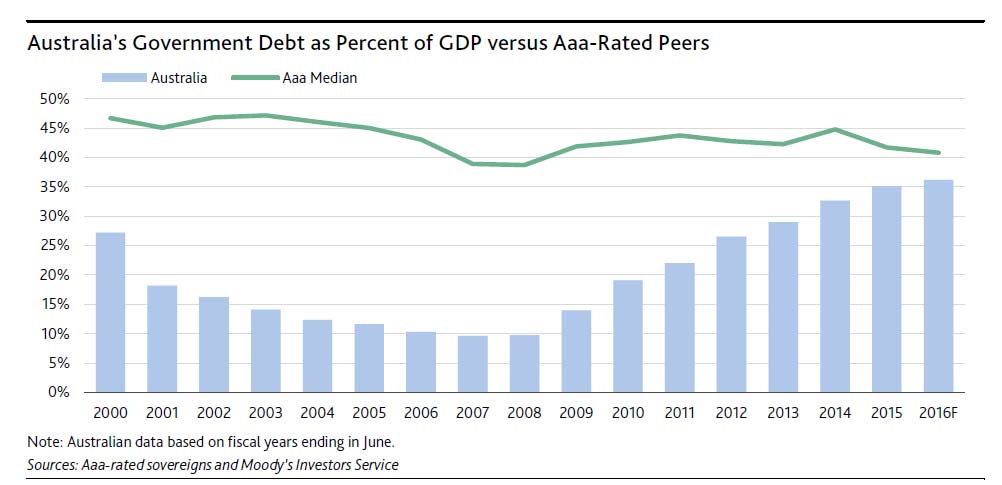
Treasurer Scott Morrison announced that the budget to be released on 3 May would focus on curbing spending to lower the government’s fiscal deficit. However, given previous difficulties in reducing welfare benefits, actual spending cuts may be modest. Moreover, Mr. Morrison’s announcement excluded measures to raise revenues. Without such measures, limited spending cuts are unlikely to meaningfully advance the government’s aim of balanced finances by the fiscal year ending June 2021 and government debt will likely continue to climb, a credit negative for Australia says Moody’s.

Notwithstanding Australia’s favourable fiscal metrics relative to Aaa-rated peers, Australia has had a prolonged and marked increase in government debt over the past decade. During a period of relatively strong GDP growth, Australia’s government debt has risen to 35.1% of GDP in fiscal 2015 from 11.6% 10 years earlier. We expect government debt to increase further to around 38% of GDP in fiscal 2018.

Moodys-Australia-DebtThe 3 May budget will provide more detail on measures aimed at limiting expenditure growth. However, the government’s pledge to curb spending will be tested by significant spending commitments on welfare, education and health. Despite a consensus on fiscal consolidation through successive administrations, the government has been unable to reduce expenditures to significantly below 36.5% of GDP since 2009.

Moreover, fading prospects for tax reform present challenges to boosting government revenues at a time when lower commodity prices are weighing on receipts from corporate profits and income taxes. Changes to superannuation tax concessions are still on the agenda and will raise government revenues, but they will be insufficient in achieving a balanced budget within five years.

Meanwhile, an increase in the goods and services tax to 15% from 10% that was envisaged earlier and would have raised an estimated AUD35 billion, according to the treasury, has been shelved. Other tax changes that would result in savings to the government are proving difficult to adopt ahead of an election later this year. Measures to streamline tax returns, which would reduce tax administration costs to the government, are now also unlikely to be part of the budget.

Plans to alter negative gearing policies and capital gains taxes, which support residential investment and house prices, but weigh on government finances, are proving divisive. The opposition Labor party argues that limiting negative gearing to purchases of new homes and reducing the capital gains tax discount on asset sales to 25% from 50% would improve the budget position by AUD32.1 billion over the 10-year period starting July 2017. The governing coalition has rejected a narrowing of the scope of negative gearing policies on the grounds that it would have a significant negative effect on the housing market.