European Bank Debt Under Pressure

According to Moody’s, Global risk aversion has spread to the European banking sector and the debt at the bottom of capital structures is selling off severely. Investors have quickly reassessed the virtues of contingent convertible (CoCo) securities, with which the risk of losing coupon payments is elevated under a diminishing outlook for profits and economic growth. As with other novel classes of financial securities that rapidly expanded, the future of the CoCo will be greatly influenced by its first substantial market stress test.

Weak earnings reports from major European banks ignited a sharp decline in the value of debt and equity across their sector in early February. This shakeout was particularly pronounced for CoCos, with the spread on such debt spiking to the Barclays index record high of 600 bp on February 9 from 497 bp at the end of January (Figure 1). The market value of such debt now trades at 93% of the par value or value at maturity after never having traded below par value until one week prior. Murkiness about the conditions under which these hybrid securities will convert to equity, combined with downwardly revised global growth forecasts, weighs on CoCos valuations.

CoCOIssuance of CoCos in Europe was prodded in recent years by the Basel III regulatory accord’s guidelines on bank capital and leverage. Yet while regulators are enamored by the flexibility provided by securities that convert from debt to equity in times of stress, investors must assess the distinct risks of such hybrids. Ranking above only common equity in claims on an institution’s assets, CoCos demand higher coupons compared to more traditional classes of debt. The amount of such hybrids outstanding issued by European banks and tracked by Barclays increased from €55 billion in mid-2014 to €108 billion today, yet only €7 billion of that increase has transpired since mid-2015. That slowing rate of growth for CoCos can largely be ascribed to generally unfavorable capital markets conditions late last year, but greater focus on banking sector fundamentals has further wounded the prospects for future issuance.

Recent rising concerns about the banking sector outlook have centered around Deutsche Bank AG, Germany’s largest lender by assets. Deutsche reported an annual loss of €6.1 billion, weighed down by impairments and legal charges. An extensive reorganization of the bank and losses on legacy assets provide challenges for future returns. Deutsche has a $1.5 billion CoCo issued in November 2014 that was quoted at a price as low as 71 cents on the dollar on February 9 after having been valued at over 97 cents per dollar at the end of last year. The negative sentiments expressed in this price decline prompted statements from the bank’s executives that pointed to ample resources for coupon payments on its hybrid securities over the next two years.

Holders of European banking sector debt can take comfort in the banks’ substantial increase in capital buffers since the financial crisis. In the second quarter of last year, large European banks had an aggregate tier 1 capital ratio (measuring equity as a percent of risk-weighted assets) of 13.1%, up significantly from 8.3% in 2007 before the crisis broke out. Banks have made radical adjustments to their balance sheets, with considerable reductions in assets bolstering their capital firewalls. This transformation has naturally reduced potential profits, with the return on equity (ROE) in mid-2015 for large European banks of 4.0% down sharply from 9.8% in 2007. Lower bank ROE can be seen as credit positive, in that it points to reduced leverage and investment in relatively less risky assets. Yet an especially weak ROE raises concerns about maintaining capital adequacy in the event of a slump, particularly among peripheral European banks still burdened with large amounts of problem loans.

Mortgage delinquencies on the rise, says Moody’s

From Australian Broker.

Changing economic conditions at home and abroad will result in an increase in the number of Australian mortgage delinquencies in the coming year, according to credit rating firm Moody’s.

The latest monthly review of the performance of Australian prime residential mortgages by ratings firm Moody’s shows delinquencies in excess of 30 days rose to 1.20% in November 2015 from 1.14% in October 2015.

Moody’s puts that monthly increase down to seasonal factors such as household overspending in the run up to Christmas, but still believes 2016 will see a higher number of delinquencies than 2015.

“The housing market has shown signs of cooling over recent months,” Moody’s assistant vice president – analyst Alana Chen said.

“Strong housing market activity in both Sydney and Melbourne helped foster relatively strong economic performance in the respective states of New South Wales and Victoria in 2015.

“But a slower pace of house price growth will mean a slowdown in economic activity and will contribute to a deterioration in mortgage performance in 2016 from current exceptionally healthy levels.”

Moody’s predicts the slower growth of house prices will continue as the Australian economy faces some challenges through 2016.

“Slowing growth in China, Australia’s biggest export market, and declining commodity prices, which are at or near multi-year lows, will also put pressure on the Australian economy and contribute to below-trend growth and a soft labour market in 2016,” Chen said.

But while Moody’s predicts a growing number of borrowers are at risk of becoming delinquent, not all are convinced that will be the case.

“With all respect to Moody’s, who have a number of economists working on this sort of thing, I find it difficult to believe we’re going to see a real rise in the number of delinquencies,” Jane Slack-Smith, director of Investors Choice Mortgages, told Australian Broker‘s sister publication, Your Investment Property.

“I’ve been a broker for 10 years and a property investor for a long time too and that’s given me a lot of experience in  reading the market and I can’t really see anything at the moment that’s going to cause a rise (in delinquencies).”

Slack-Smith believes the period of low interest rates have allowed a large proportion of Australian borrowers to get in position where they a comfortable with their financial commitments, while others have been prevented from getting in over their heads.

“With the lower interest rates we’ve had I think a lot of people have taken advantage of that. A lot of people have built up their redraw or offset account so they’re in a position where they’re pretty comfortable with everything,” she told Your Investment Property.

“The other thing is that the APRA and ASIC changes have quelled a lot of irresponsible lending that might have happened.

“It was a pretty heavy handed approach, but the fact that people were assessed on a 7.5% interest rate and the servicing criteria was made tougher means there’s already been a buffer built in so that people can manage if we do see interest rates start to move up.”

Finalized Basel Market Risk Capital Rule Improves Bank Capital Comparability

From Moody’s.

Last Thursday, the Basel Committee for Banking Supervision (BCBS) finalized its market risk capital framework, known as the Fundamental Review of the Trading Book. The final rule, which updates the Basel II and 2.5 approaches and takes effect January 2019 will increase the transparency and consistency of reporting risk-weighted assets (RWA) and capital metrics, which is a key goal of the BCBS agenda for 2016.

Under the new standards, banks’ reported market risk capital measures will be more comparable because of consistent risk factor identification, a more rigorous model approval process, and an enhanced standardized capital calculation serving as a capital floor to the internal models-approach calculation. The revised market risk capital framework enhances both the standardized and models-based approaches of calculating market risk exposure, recognizing that model variability is one of the key drivers of differing riskweighting and capital treatment for similar exposures across banks. Under the revised framework, internal models-approach banks will need to calculate market RWA under both methods, at trading desk level. Also, as the model validation process is reinforced under the framework, coverage of risks by the internal models approach could be narrowed – for example, they would be moved to the standardized approach.

These final rules will especially affect our rated universe of global investment banks (GIBs), which generally have significant trading operations, use internal models to calculate capital requirements, and have the largest share of market RWA as a percent of total RWA. We estimate that our rated GIBs’ market RWA account for about 10% of total RWA on average. It is unclear how the new market risk capital rules will specifically affect the capital requirements of the GIBs after the GIBs take mitigating actions, however, the BCBS estimated that in aggregate, banks would have a 40% higher market risk capital requirement on a weighted average basis and 22% higher on median basis under the new market risk standard versus the existing one. We expect that the finalization of these rules, which GIBs anticipated, will motivate them to further reduce and/or exit more capital-intensive trading activities. Although market risk has generally been smaller relative to credit and operational risk in bank capital requirements, the potential capital increase comes on top of other capital requirements that will start being phased in and will be material for some banks.

Key aspects of the internal models-approach include shifting the measure of stress loss risk or tail risk to an expected-shortfall measure from a value-at-risk measure to better capture the potential magnitude of tail losses, and including a stressed capital add-on for risk factors that cannot be modeled. The capital floor (capital charge under the internal-models approach relative to capital under the standardized approach) is set at 100%, meaning that banks have no incentive to move to the internal models-approach and suggesting that the BCBS believes that model-risk remains high despite the improvements in the new framework. The revised standardized approach uses an expanded factor sensitivities-based method, so that risks are evaluated more extensively and consistently across jurisdictions. Capital charges for risk factor sensitivities (i.e., delta, vega, and curvature risk) are applied to a broad group of risk classes, including interest rate risk, foreign-exchange risk and credit-spread risk.

Wide Spreads May Block Future Rate Hikes

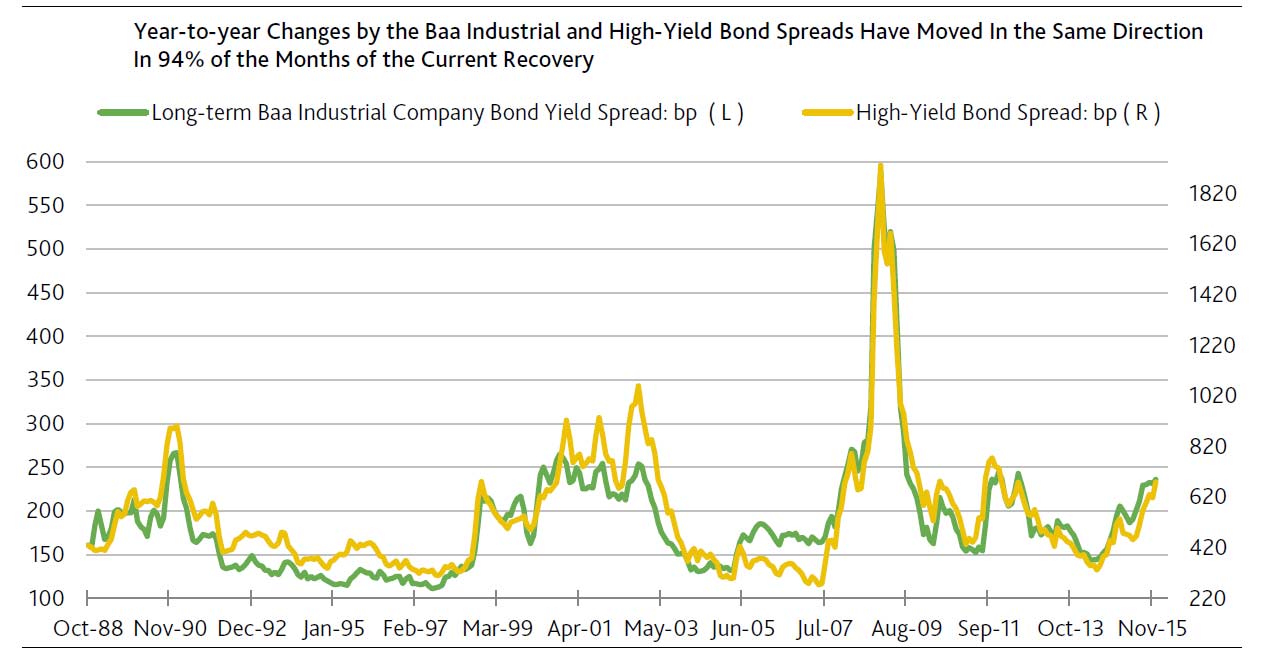
According to Moody’s the Fed’s first rate hike in more than nine years occurred in the context of a wider than 700 bp spread for high-yield bonds. This is noteworthy from corporate credit’s perspective. Never before in the modern era of the speculative-grade has bond market had the Fed hiked rates when the high-yield bond spread was wider than 625 bp.

Going forward, if the high-yield spread remains wider than 650 bp, the Fed may opt not to hike rates at the March 2016 meeting of the FOMC. Moreover, if the spread averages more than 700 bp during the next three months, a weakening of credit conditions may force the Fed to reconsider its current strategy.

Moreover, current outlooks for defaults and profits weaken the case in favor of a percentage point climb by fed funds over the next 12 months. Following the recessions of 2001 and 1990-1991, the Fed began to hike rates in June 2004 and February 1994. The latter two starts to a series of Fed rate hikes were accompanied by declining trends for the high-yield default rate and lively profits growth.
After dipping by a prospective -0.2% annually in 2015, the Blue Chip consensus projects a below-trend 4% rebound by 2016’s pretax profits from current production. An acceleration of labor costs vis-a-vis business sales may squeeze margins considerably in 2016.

The sharp ascent by the average EDF (expected default frequency) metric of US/Canadian below-investment-grade companies from December 2014’s 3.2% to a recent 6.7% highlights the worsened outlook for high-yield defaults.
Nevertheless, a fast rising high-yield EDF metric does not necessarily rule out another Fed rate hike. For example, fed funds was lifted from May 1999’s 4.75% to May 2000’s 6.50% notwithstanding an ominously elevated average high-yield EDF metric of 7.9%, whose then rising trend could be inferred from its average yearly increase of a full percentage point. However, it should be added that by January 2001 the Fed was forced to quickly slash fed funds to 5.5%. Yet the latter was not enough to prevent March 2001’s arrival of a recession.

But this time the Fed may not be indifferent to a worsening default outlook. Today’s macro backdrop compares unfavorably with that of 1999 and early 2000. The 4.5% annual surge by real GDP during the year-ended Q1-2000 towers over the 2.5% growth expected of real GDP for 2015 and 2016.

In addition, the labor market was much tighter according to how payroll employment’s 62.3% share of the working-age population was much greater than the recent 56.7%. Further, unlike the 3.7% year-over-year increase by the average hourly wage for the 12-months-ended March 2000, the average wage now rises by a much slower 2.3%. Thus, it’s doubtful that policymakers will shrug off another extended stay by the high-yield EDF metric of 6.5% or greater. Unless credit conditions improve, the current series of prospective rate hikes may be cut short.

Moody's-ChartContrary to conventional wisdom, the yield spreads over Treasuries of investment- and speculative-grade bonds are highly correlated. For a sample beginning with July 1991 and ending in November 2015, the high-yield bond spread shows surprisingly strong correlations with Moody’s long-term industrial company bond yield spreads of 0.93 for Baa-grade bonds and 0.90 for single-A-rated securities.

Housing Affordability Falls – Moody’s

The current low mortgage interest rates have failed to offset the impact of rising house prices over the past year, and the implementation of interest rate hikes this month will further increase delinquency and default risks for mortgage loans says  Moody’s analyst Natsumi Matsud.  Specifically, the less affordable a mortgage becomes relative to household income, the higher the risk of delinquency and default.

The out-of-cycle interest rate hikes by the big banks will put further stress on housing affordability once they hit in November. Sydney and Melbourne will be worst hit says Moody’s.

In Sydney, where house prices climbed over the last year, households spent an average of nearly 40 per cent on monthly mortgage repayments, up from 36 per cent a year ago. Households with two income earners spent an average 29.3 per cent of their monthly income on mortgage repayments in October, up from 28.2 per cent at the same time last year.


New Total Loss Absorbing Capacity Standard for Global Banks Is Credit Positive – Moody’s

In Moody’s latest Credit Outlook, they discuss the impact of the new Total Loss Absorbing Capacity (TLAC) Standard for Global Banks.

Last Monday, the Financial Stability Board (FSB) published its standard for total loss absorbing capacity (TLAC), which sets forth the amount, composition and location of capital and debt required to meet bank recapitalization needs in a resolution. The standard prompts global systemically important banks (G-SIBs) to increase the resources available to absorb losses beyond the regulatory capital requirements and buffers embedded in the Basel III framework, a credit positive.

The TLAC framework aims to ensure that banks maintain sufficient loss-absorbing instruments (both capital and eligible long-term debt) to absorb losses and recapitalize a bank in a resolution without the use of public funds and to reduce the chance of systemic disruption. The TLAC standard applies to the 30 institutions that the FSB designated as G-SIBs, although national regulators might also require non-G-SIBs to conform with the global standard. Firms will be required to meet TLAC standards alongside regulatory capital requirements and buffers set out in the Basel III framework.

The FSB set an initial level of TLAC at 16% of risk-weighted assets (RWAs) and 6% of the leverage exposure (the denominator of the Basel III leverage ratio) starting 1 January 2019. This will rise to 18% of RWAs and 6.75% of leverage exposure starting 1 January 2022. The 1 January 2019 start date should provide banks with sufficient time to reach the required levels.

Chinese G-SIBs have been exempted from the initial TLAC deadlines given the still-low levels of demand among Chinese non-bank investors for fixed-income assets, which constrains the extent to which banks can issue substantial volumes of capital and debt instruments. Nevertheless, Chinese G-SIBs will be required to meet the first benchmark – 16% of RWAs and 6% of leverage exposure – by 1 January 2025, and the 18% of RWAs and 6.75% of leverage exposure requirement by 1 January 2028.

TLAC can comprise a range of instruments, from equity to long-term senior debt. Senior holding company debt should typically be eligible as TLAC owing to its structural subordination. The guideline contemplates the eligibility of senior unsecured bank debt normally ranking pari passu with excluded liabilities such as derivative liabilities and short-term deposits by allowing senior bank debt of up to 2.5% of RWAs in 2019 and 3.5% in 2022 issued by institutions subject to resolution regimes that provide for partial or complete exclusion of the pari passu liabilities from bail-in. However, it remains unclear how the preconditions for the eligibility of senior bank debt would be fulfilled. In particular, the inclusion of such debt must not give rise to material risk of legal challenge under the no creditor worse off principle.

The Basel Committee on Banking Supervision estimated that for a sample of 29 G-SIBs based on last year’s G-SIB list, the average eligible external TLAC ratio at the end of 2014 was 13.1% of RWAs and 7.2% of the leverage exposure. This estimate assumed no bank-issued senior debt would be eligible as TLAC, and revealed that only six banks met the 16% TLAC requirement. The aggregate shortfall to the 2022 TLAC requirements totals €1.1 trillion for all 30 G-SIBs, or €755 billion when excluding the Chinese G-SIBs. For banks subject to operational resolution regimes, which include all US and European G-SIBs, the introduction of TLAC requirements will benefit depositors and other senior unsecured creditors because of a larger cushion available to absorb losses at failure from the issuance of more subordinated securities.

Additionally, other things being equal, a larger layer of any given class of debt will benefit the ratings of that class, given that potential losses would be spread over a larger pool of investors. This could be somewhat offset by an increased reliance on wholesale funding, and a weakening of profitability should funding costs increase. However, we do not expect a material effect on those metrics.

Australian Major Banks’ Repricing of Residential Investor Loans Is Credit Positive – Moody’s

From Moody’s.

Over the past week, three major Australian banks increased their lending rates for residential property investment loans and interest-only (IO) loans. Australia and New Zealand Banking Group Limited and Commonwealth Bank of Australia each lifted the standard variable investor rate by 0.27%. National Australia Bank Limited increased the rate it charges for IO loans and line of credit facilities by 0.29% (investors, rather than owner-occupiers, primarily take out IO loans).

Increased lending rates are credit positive for the banks because they re-balance their portfolios away from the higher-risk investor and IO lending toward safer owner-occupied and principal amortizing loans. They also help to preserve net interest margins (NIM) and profitability amid higher capital requirements and increased competition from smaller lenders.

The banks’ moves follow increasing regulatory scrutiny of residential property lending. Investment and IO lending has grown rapidly in the recent past, reaching a record proportion of overall mortgage lending that has contributed to rapid house price appreciation, particularly in the Sydney and Melbourne markets.

In December 2014, the Australian Prudential Regulation Authority (APRA) announced a set of measures designed to ensure residential mortgage underwriting standards remain prudent and to curb growth in investment lending to 10% per year. The major Australian banks have since undertaken a number of initiatives to ensure compliance with APRA’s guidelines. Notably, these include the imposition of higher down payment requirements for investment lending and these most recent pricing changes.

Although investment and IO loans performed well during the global financial crisis of 2007-10, they inherently carry higher default probabilities and severities, and a larger proportion of such loans risks higher delinquencies for Australian banks at times of stress.

Investment loans typically have higher loan-to-value ratios: our data indicates that the average loan-to-value ratio for investment loans is 60.2%, versus 57.8% for owner-occupier loans. In addition, since the underlying properties are not the primary residence, they are more sensitive to changes in house prices and borrower employment status and thus are more likely to default if the borrower’s conditions change. IO loans are more exposed to rising interest rates than principal-and-interest loans.

We see APRA’s and the banks’ efforts to slow the growth in investment lending as an important credit support for the system. We also expect that the remaining major Australian bank, Westpac Banking Corporation will follow the other banks in repricing its investment mortgage book. Over time, these steps are likely to slow investment lending growth rates to below APRA’s 10% cap from current annualized growth rates of 10.6% for ANZ, 9.9% for CBA, 14.1% for NAB and 10.0% for Westpac, according to APRA data.

Curbing investment lending is particularly positive for those banks with significant investment loan portfolios. NAB and Westpac, when it follows suit, are especially well-placed to derive benefits from pricing changes. Westpac has the highest proportion of investment lending in its portfolio (46% of total housing loans), exposing it to a higher-risk segment, and NAB has opted to reprice its IO loans and line of credit facilities (together they constitute 47% of its overall portfolio), allowing it to capture a greater NIM benefit.

Banking: Australian Banks’ Moves to Curb Residential Investment Lending Are Credit-Positive – Moody’s

In a  brief note, Moody’s acknowledged that the bank’s recent moves to adjust their residential loan criteria could be positive for their credit ratings, but also underscored a number of potential risks in the Australian housing sector including elevated and rising house prices, declining mortgage affordability, and record levels of household indebtedness. As a result, they believe more will need to be done to tackle the risks in the portfolio.

Moody’s says the recent initiatives are credit positive since they reduce the banks’ exposure to a higher-risk loan segment. At the same time, it is likely that further additional steps will be required because the growing imbalances in the Australian housing market pose a longer-term challenge to the Australian banks’ credit profiles, over and above the immediate concerns relating to investment lending.

Therefore they expect the banks first to curtail their exposure to high LTV loans and investment lending further over the coming months; and second, they will gradually improve the quantity and quality of their capital through a combination of upward revisions to mortgage risk weights and capital increases. This is likely to happen over the next 18 months or so.

Westpac’s Revised LMI Arrangements Are Credit Negative for Australian Mortgage Insurers – Moody’s

Moody’s says that according to media reports, last Monday, Westpac Banking Corporation advised its mortgage brokers that it had revised its mortgage insurance arrangements so that effective that day, 18 May, all new Westpac-originated loans with a loan-to-value ratio (LTV) above 90% would be insured with its captive mortgage insurer, Westpac Lenders Mortgage Insurance Limited and reinsured with Arch Capital Group Ltd.

Westpac’s decision to shift its mortgage insurance policies away from domestic third-party lenders’mortgage insurance (LMI) providers is credit negative forGenworth Financial Mortgage Insurance Pty Ltd and QBE Lenders’ Mortgage Insurance Limited. Westpac accounted for around 14% of Genworth Australia’s gross written premium during 2014, and potentially a meaningful, albeit undisclosed, proportion of QBE LMI’s business. At the same time, existing policies will not be affected and the effect o nthe insurers’ net earned premium should only become material beginning in 2016. LMI customer contractual relationships are long term in nature and any further erosion of the customer base, when and if it occurs, remains contingent on market and individual customer developments.

Westpac’s move follows its earlier disclosures and the Genworth Australia announcement in February 2015that Genworth’s contract for the provision of LMI to Westpac was being terminated. Our understanding from Westpac’s disclosures and media reports is that Westpac’s LMI arrangements with QBE LMI have also been affected. Moody’s says that Westpac’s move is indicative of a longer-run trend towards reduced usage of the domestic mortgage insurance product. Australia’s major banks are not currently deriving regulatory capital benefits from using LMI. Similarly, product innovation, such as the use of self-insured low-deposit mortgage products, will affect the need for third-party LMI. Diminished third-party LMI usage elevates the insurers’ risk of losing pricing power and reducing their customer base, putting downward pressure on the firms’ profitability and volumes.

Housing Market Imbalances Pose Long-term Challenges for Australian Banks – Moody’s

Moody’s Investors Service says that underwriting discipline and capital are key variables in maintaining the health of bank credit profiles in Australia, in the face of rising housing market imbalances.

“Rapid house appreciation, particularly in Sydney, as well as lending imbalances are increasing the risks of a housing market correction,” says Ilya Serov, a Moody’s Vice President and Senior Credit Officer. “This poses long-term challenges to Australian bank credit profiles”.

“We expect that over time the banks will revise up their mortgage risk weights and capital levels to better recognize the rising tail risks embedded in their housing portfolios,” adds Serov .

Moody’s analysis is contained in its just-released report titled “Rising Housing Market Imbalances Pose Long-Term Challenges for Australian Banks,” and is authored by Serov.

Moody’s report points out that dividend policy initiatives announced recently by major Australian banks — including National Australia Bank’s announcement of a capital raising of AUD5.5 billion — represent the start of a capital accumulation phase that is likely to extend well into 2016.

In Moody’s assessment, the risks in Australia’s housing market risks are skewed towards the downside. While over the short run, stability in the housing market will be supported by low interest rates and the healthy state of bank balance sheets, elevated and rising house prices are intensifying imbalances in the housing market.

Moody’s evaluation of the Australian housing market suggests that housing affordability is falling, despite the low interest rate environment. Similarly, lending imbalances, including a decline in the proportion of first-time home buyers and a sharp rise in residential investment activity, pose a further source of risk.

In Moody’s view, Australian banks are well-positioned to adjust their origination practices and capital levels to better recognize the rising tail risks embedded in their housing portfolios.

Moody’s report says likely regulatory changes will see average mortgage risk weights for the major banks in Australia increase to the 20%-25% range, up from the current 15%-20%. It estimates that Australia’s four major banks — National Australia Bank Limited (NAB, rated Aa2 stable, a1), Westpac Banking Corporation (Aa2 stable, a1), Australia and New Zealand Banking Group Limited (Aa2 stable, a1) and the Commonwealth Bank of Australia (Aa2 stable, a1) — are well-positioned to absorb such a change.

However, Moody’s also anticipates a broader increase in regulatory capital requirements, in line with the November 2014 recommendation by Australia’s independent Financial System Inquiry that Australian bank capital ratios should be “unquestionably strong” and rank in the top quartile of internationally active banks. This scenario would necessitate deeper adjustments to the banks’ dividend policies, and potentially the raising of new capital.

Moody’s report points out that the latest regulatory data suggests that Australian banks have become more conservative in their underwriting, as they have curtailed their exposure to high loan-to-value ratio loans. Such moves would help offset the risks posed by the country’s deepening housing market imbalances.

The rating agency sees ongoing adjustment to banks’ underwriting practices to bring them into line with the guidelines released by the Australian Prudential Regulation Authority in December 2014, which include limiting growth in investor housing loans to 10% per annum and specific guidance around stressed debt-service requirements, as supportive of the banks’ high rating levels.

Moody’s report notes that since May 2014, median home prices have risen by 10% nationwide, and by 16% in the core Sydney market . The report further notes that Australian home prices have risen by 23% since the start of the latest interest rate cutting cycle in November 2011.

Overall, Moody’s says that the banks’ asset quality metrics and portfolio quality will remain strong in calendar 2015, supported by Australia’s low interest-rate environment.