We walk through some of the recent arrears data, and compare the worst post codes with our own stress modelling. The correlation may surprise you!. Go to the Walk The World Universe at https://walktheworld.com.au/
Tag: Mortgage Defaults
Mortgage Delinquencies Tick Higher As More Higher LVR Loans Written
Genworth, the Lenders Mortgage Insurer released their third quarter results today. Their statutory net profit after tax (NPAT) in 3Q19 was $25.1 million (3Q18: $19.6 million) and their underlying NPAT2 of $26.5 million (3Q18: $20.4 million).
Genworth said 3Q19 financial performance was “solid” with gross written premium up 24.4% from growth in our traditional lenders mortgage insurance (LMI), driven by increasing volumes in high loan to value lending by our lender customers.
The Delinquency Rate increased from 0.55% in 3Q18 to 0.60% in 3Q19. This was driven primarily by an increase in delinquency rates across most states (particularly in Western Australia, New South Wales and Queensland).
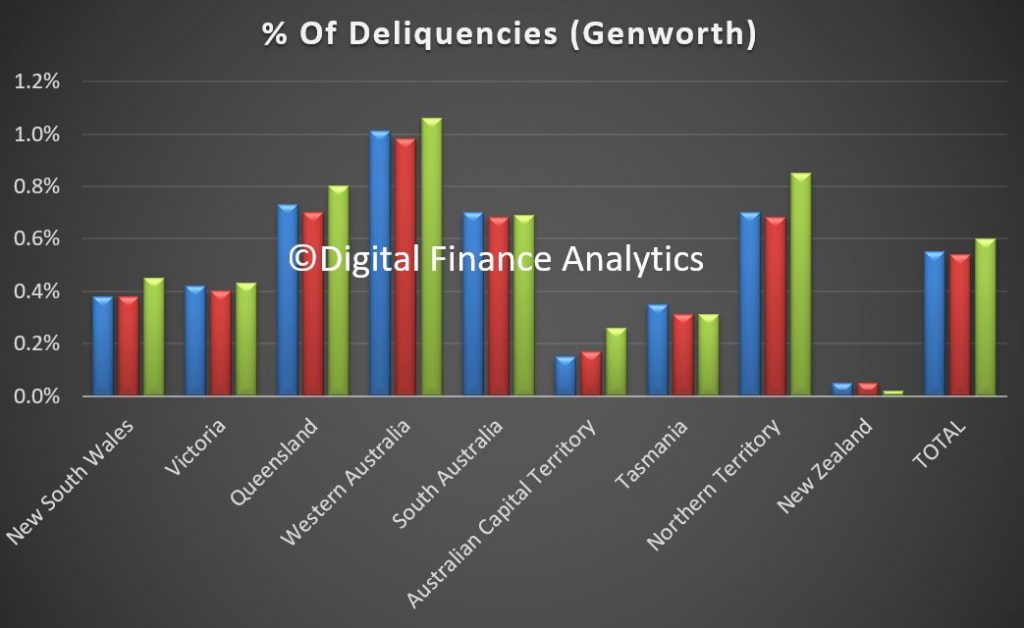
The increase also reflects the continued extended ageing of delinquencies due to slower loss management processing by lenders first called out in FY18. Encouragingly, signs of faster processing by some lenders has emerged this quarter. The Delinquency Rate remained flat between 2Q19 and 3Q19.
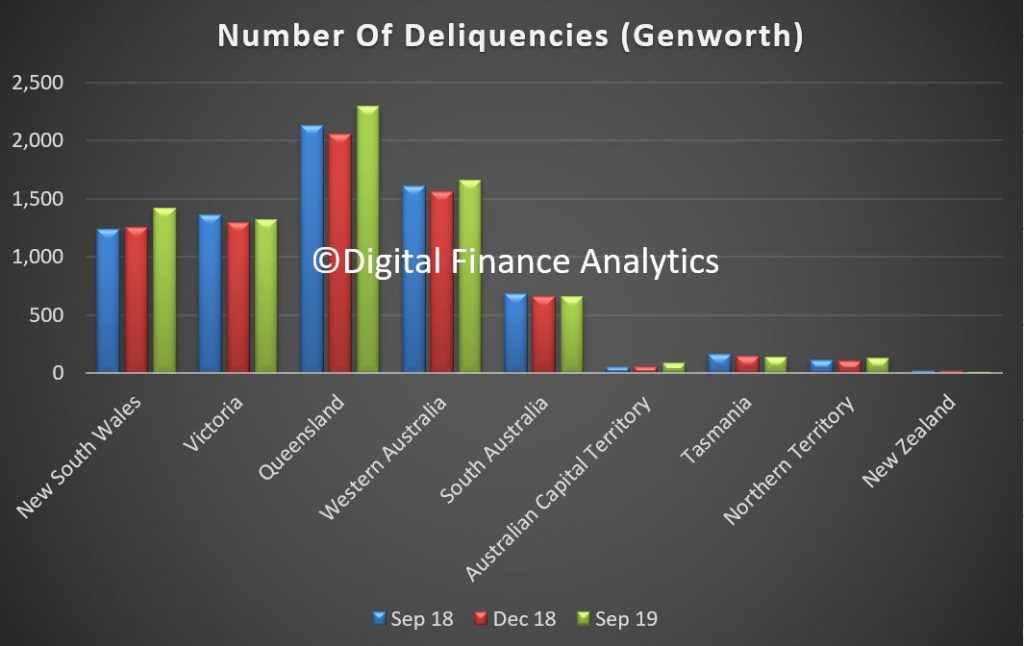
New Delinquencies was down slightly (3Q19: 2,622 versus 3Q18: 2,742) and in line with favourable trends usually experienced in the third quarter as new delinquencies reduced from 2,853 in 2Q19. Cures improved from 2,378 in 3Q18 to 2,439 in 3Q19 as lender customers started to emphasise remediation of aging delinquencies. However the cure rate is still lower than back in 2017.
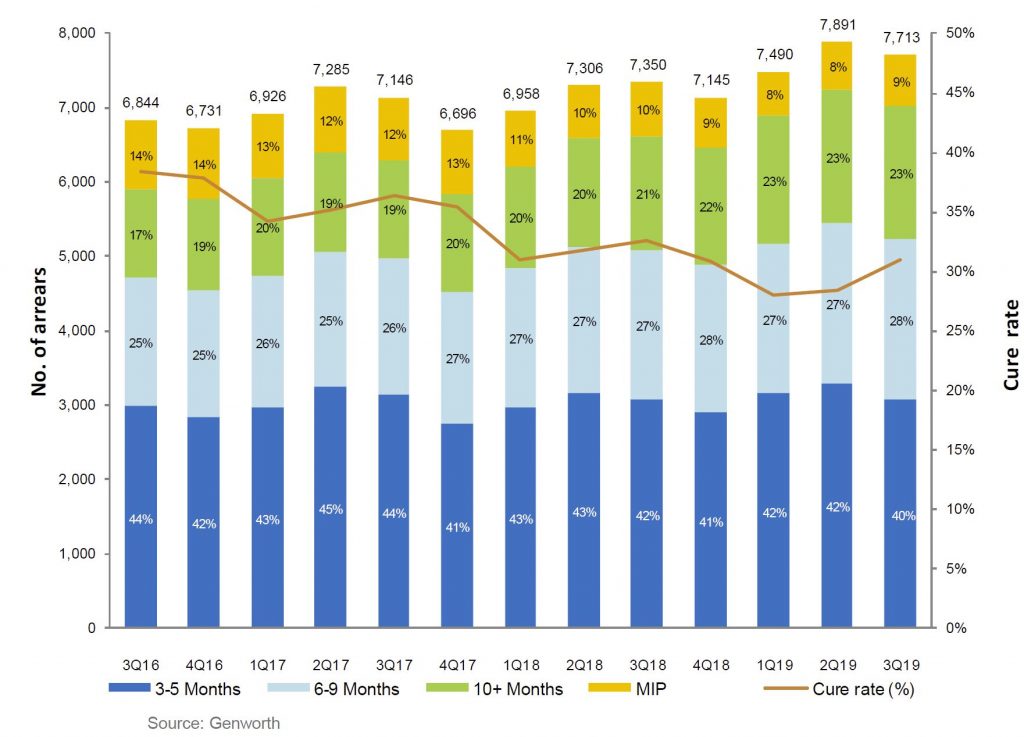
The number of Paid Claims was up (3Q19: 361 versus 3Q18: 320) although the average paid per claim decreased from $115,700 in 3Q18 to $97,900 in 3Q19. This decrease is a result of the stabilisation of mining regions. However, the average paid per claim remains elevated as challenging market conditions remain across areas such as Perth and its specific sub-regions.
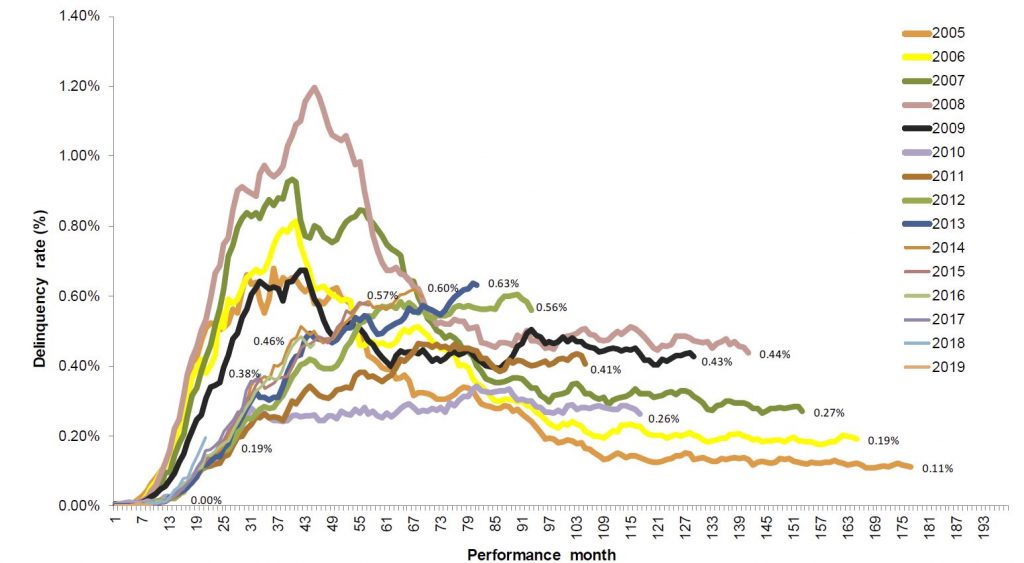
The aging also highlights the length of time it takes to get into difficulty, see the peak in loans written back in 2013-14.
Portfolio delinquency performance remained relatively steady quarter on quarter, following seasonal trends. Despite the overall stability, impacts from ageing delinquencies continue, but early signs of faster loss mitigation processing by lenders are emerging.
2006 and prior book years performances were affected by higher proportion of low doc lending which reduced significantly in 2009 following policy changes and decommissioning of the low docs product in the latter part of 2009.
Historical performance of 2008 09 book year was affected by the economic downturn experienced across Australia and heightened stress experienced among self employed borrowers, particularly in Queensland, which has been exacerbated by recent natural disasters.
2010 12 book year delinquencies at lower levels driven by stronger credit policies
Deterioration in 2013 14 book years reflect downturn in mining regions resulting in ongoing economic and housing market challenges.
But the most obvious issue ahead is the rising levels of delinquency in NSW. This will be one to watch in coming quarters, alongside a potential rise in the proportion of high loan to value loans being written now (thanks to the APRA loosening).
A Quick Reminder And More On Mortgage Delinquencies
We look at Westpac’s latest data, with a focus on mortgage delinquencies, and also mention our upcoming live stream event tomorrow. You can still send in questions beforehand via the DFA blog, or live on the show tomorrow via the online chat.
Westpac 3Q19 Stressed Assets Rise
Westpac has released their 3Q19 disclosures. Mortgage delinquencies were higher which mirrors other recent bank sector results.
They reported an increase in impaired assets over the quarter, up $0.1 bn to $1.9 bn. Stressed assets to total committed exposures rose 10 basis points to 1.20%, of which 1 basis point was from impairments, 3 basis points from watch-lists etc (mainly in the retail, manufacturing and property segments), and 6 basis points related to 90+ day past due (mainly mortgages).
Total provision balances were up 1.8%.
Australian mortgage 90+ delinquencies were up 8 basis points to 0.9%, with properties in possession rising by 68 to 550 in the quarter, mainly from WA and QLD.
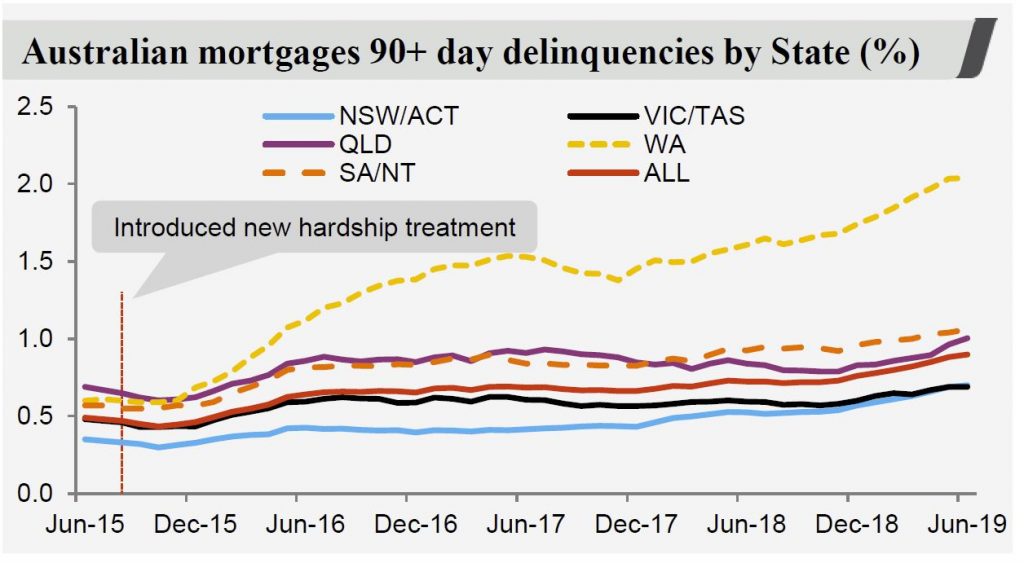
They said that the higher stress in the portfolio combined with softness in the property market has contributed to an increase in time to sell a property. In addition, a greater proportion of P&I loans in the portfolio are lifting delinquencies, and NSW delinquencies rose to 71 basis points, though below the portfolio average.
RAMS loans continue to have a higher rate of delinquency.
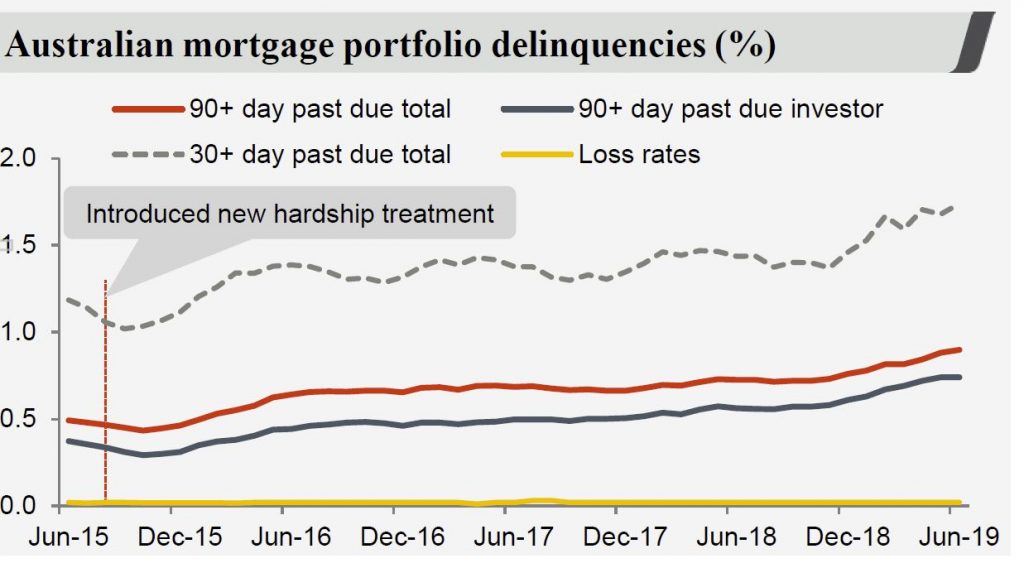
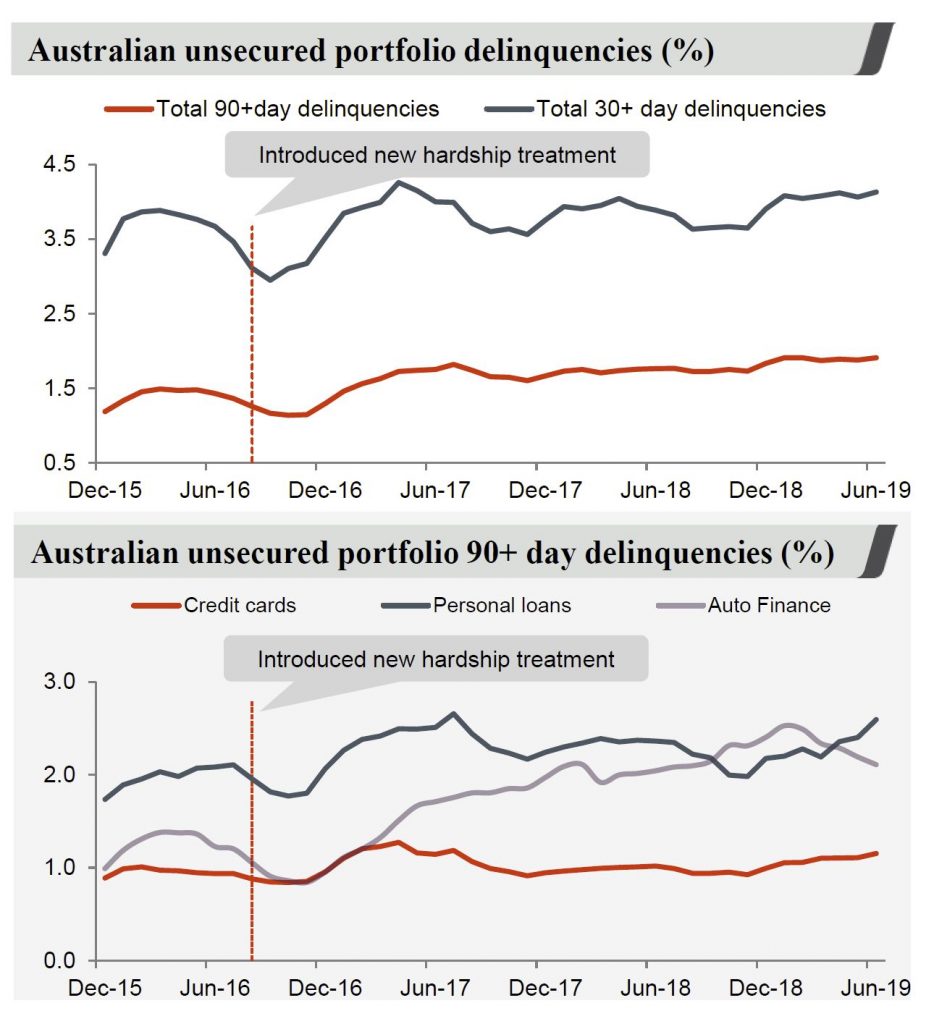
In addition consumer unsecured delinquencies rose 4 basis points, though auto finance was lower thanks to increased collection activities, to 1.91%
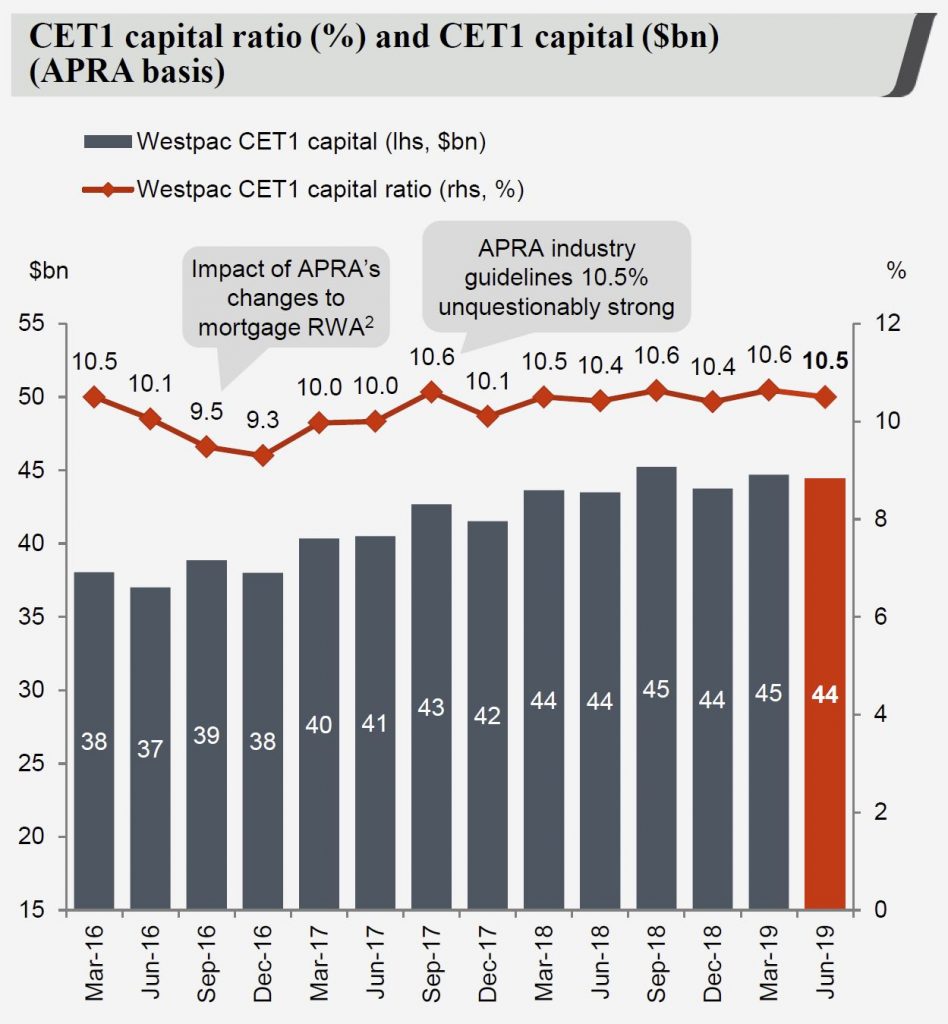
The CET1 ratio dropped to 10.5%, partly thanks to the 2019 dividend payment. The “internationally comparable” CET1 ratio was 15.9% as at June 2019.
Genworth Says Mortgage Delinquencies Higher
Genworth reported their 1H19 results today. As the most transparent Lenders Mortgage Insurer in Australia it provides an important, if myopic sense of what is happening at the mortgage portfolio coalface. And pressure is still building.

They reported a NPAT of $88.1 million includes after tax unrealised gain of $45.4 million on investment portfolio (1H18: after tax unrealised loss of $8.4 million), and an underlying NPAT 1 of $43.1 million includes after tax realised gain of $5.8 million (1H18: $9.1 million).
Their loss ratio was 54.1% (1H18: 53.3%) in line with the Company’s FY19
guidance reflecting they say a seasonal uptick in delinquencies historically experienced in the first half of the year.
Delinquencies were up, by 6 basis points, with WA leading the way at 11 basis points, followed by NSW and QLD. This is consistent with DFA mortgage stress analysis.
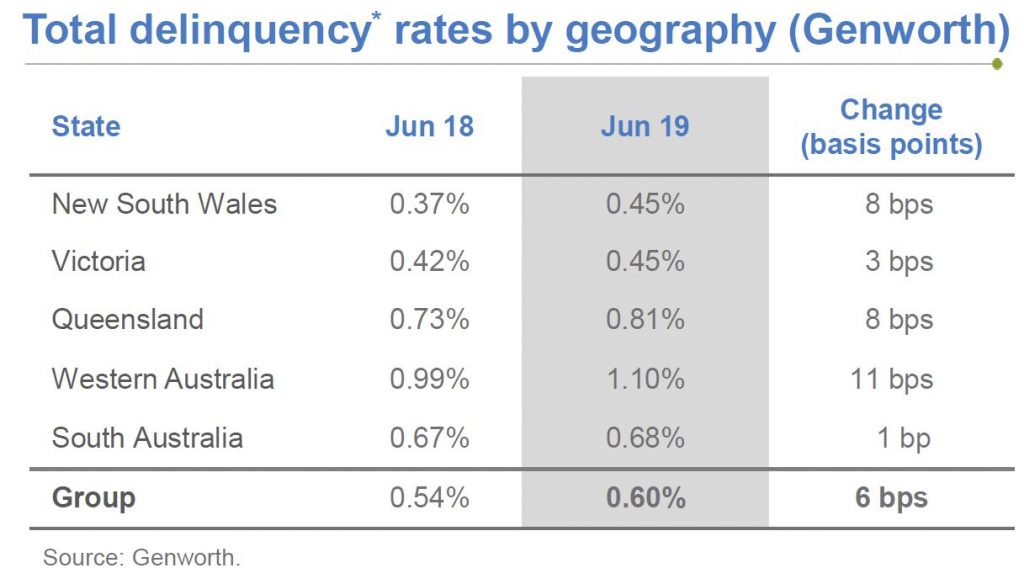
They said that overall portfolio delinquency performance deteriorated marginally quarter on quarter, in-line with seasonal expectations, but also impacted by ageing delinquency portfolios as a result of slower loss mitigation processes by lenders.
This is code for lenders choosing NOT to press stressed borrowers to foreclose, in my view.
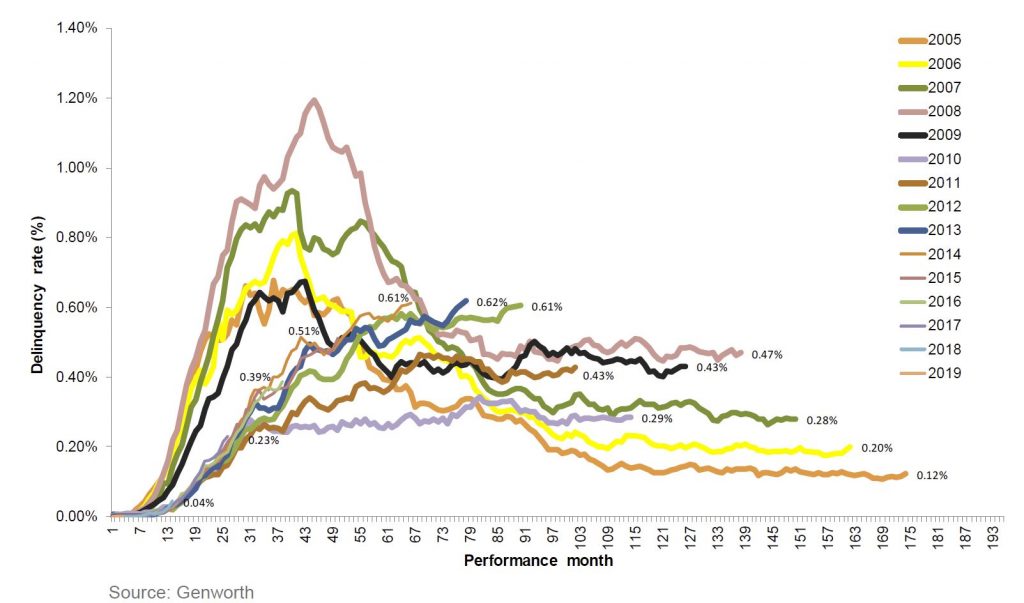
Their 2006 and prior book years performances were affected by higher proportion of low doc lending which reduced significantly in 2009 following policy changes and decommissioning of the low docs product in the latter part of 2009
Historical performance of 2008-09 book year was affected by the economic downturn experienced across Australia and heightened stress experienced among self-employed borrowers, particularly in Queensland, which has been exacerbated by recent natural disasters.
2010-12 book year delinquencies at lower levels driven by stronger credit policies
Deterioration in 2013-14 book years reflect downturn in mining regions resulting in ongoing economic and housing market challenges
They announced a new product offering – a regular monthly premium LMI to lenders as an alternative to the current upfront single premium product. This may lower the sticker shock on premiums for LMI.
Their outlook is predicated on metropolitan housing market conditions stabilising, but Perth is likely to continue to experience challenging market conditions. They think unemployment levels will remain reasonably stable throughout 1H19 though with continued excess capacity in the labour market ahead.
Genworth still has a strong capital base with total assets as at 30 June 2019 at $3,648.2 million. The 1.6% increase is due to share buy-backs, unrealised gains in investments and changes in accounting.
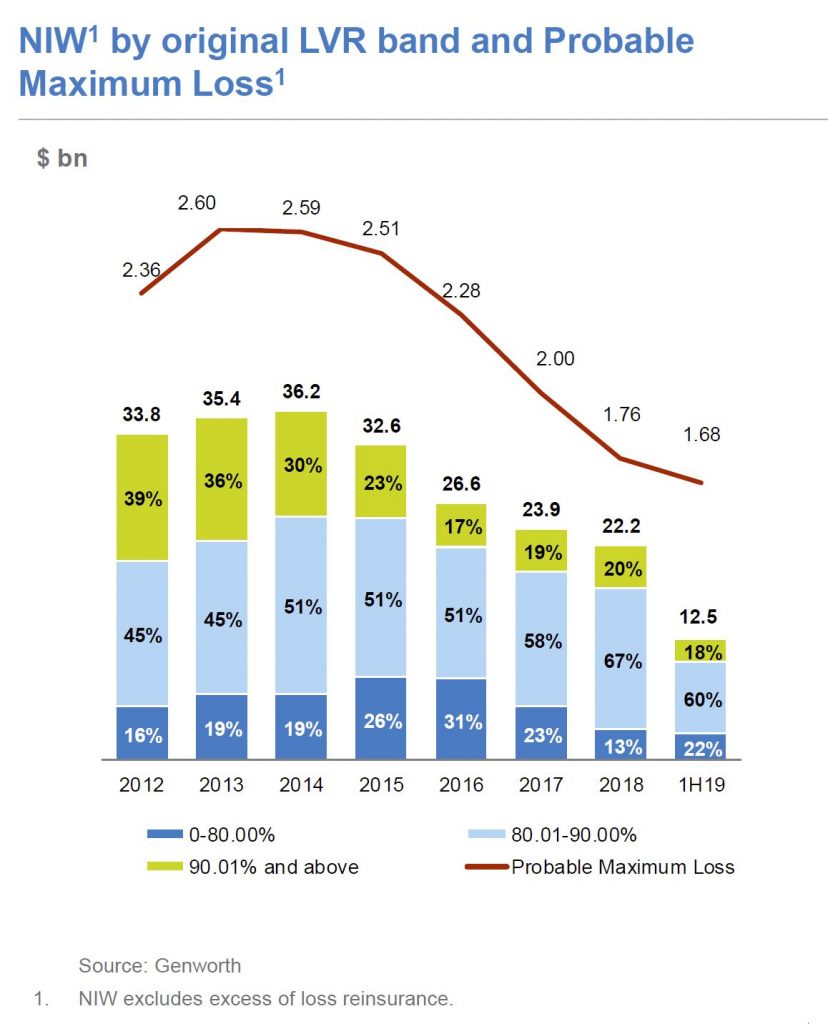
Total liabilities as at 30 June 2019 were $1,925.9 million, which is a 3.9%
increase of $73.1 million from 31 December 2018.
Since listing in 2014, Genworth has paid out 100% of after tax profits by way of ordinary and special dividends to shareholders.
So LMI remains a tricky business, with new competitors, internal bank alternatives, and the Government 95% scheme coming next year, so no surprise that some rating agencies have recently downgraded.
90 Day+ Mortgage Delinquencies Higher
Moody’s released their SPIN index for May 2019. Their overall score slid just a little to 1.52%, though with significant regional variations.
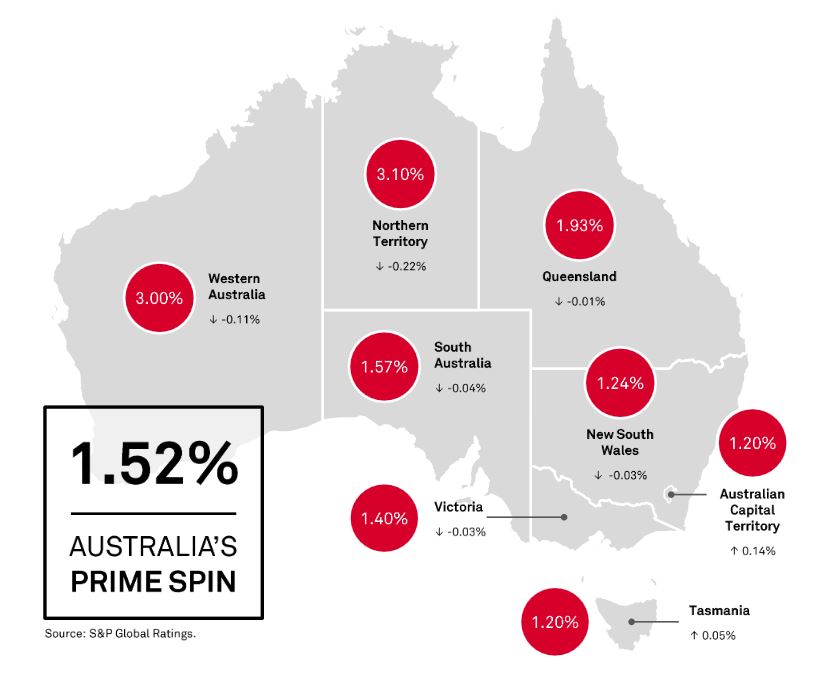
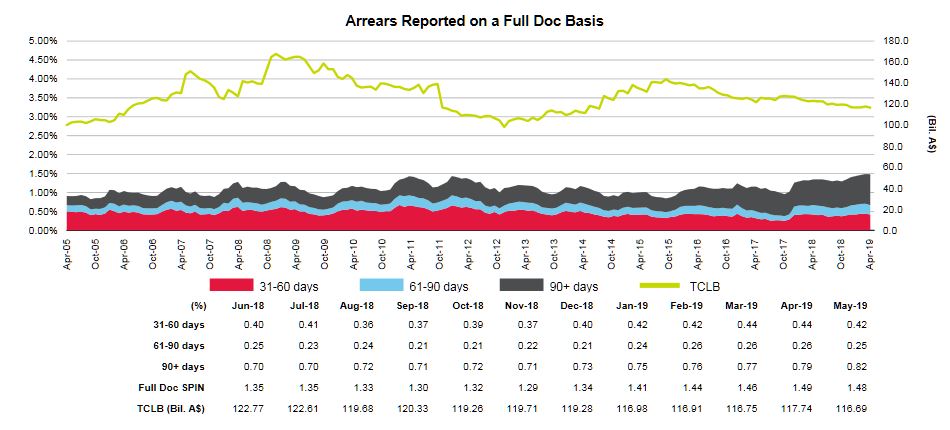
However, 90 days+ default rates continued higher.
There were rises in 90 day issues in both the regional and major banks books.
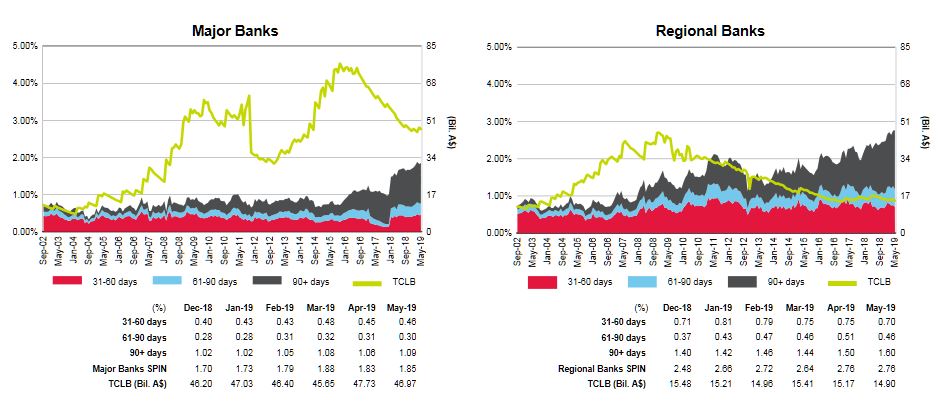
A caveat of course is these are mortgages in securitised loan pools, so they may not represent the total market. However, given the current mortgage stress levels we are seeing, it is likely defaults will rise further in the months ahead. That is unless the tax cuts and lower mortgage rates changes the dynamic.
Mortgage Arrears Higher Again In April
The S&P Spin Index for April shows a further rise in mortgage defaults, with WA and QLD leading the way. Only the ACT fell.
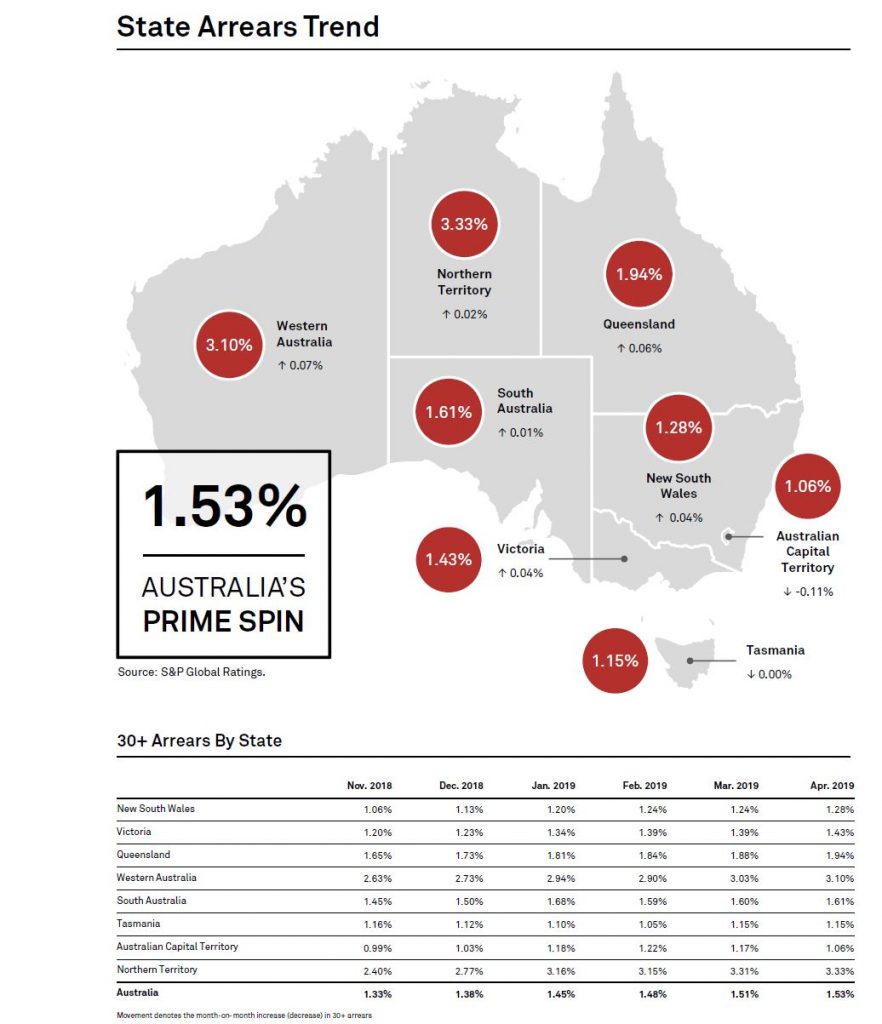
Now of course these are a myopic cross selection of loans, because they are those in the securitised pools. However, the rising trend continues.
Within the mix, 90+ days arrears continue to climb especially among Regionals. It is worth reflecting that any upturn in the property market, to the extent it emerges, will have precisely NO effect on existing cash-strapped households, as the flat incomes, rising costs pincer movements continue to grip.
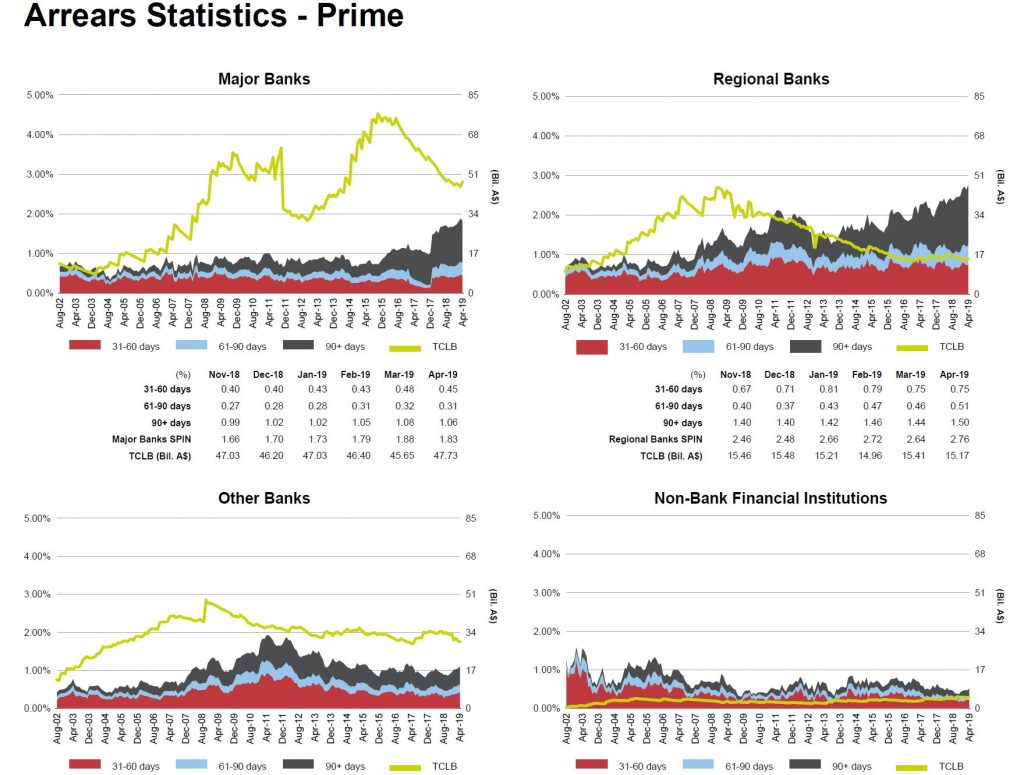
This was predictable, given the rising mortgage stress we have been detecting for some time. Of course the question becomes, will this lead to higher bank losses down the track?
Mortgage Arrears Climb As Household Budgets Decay
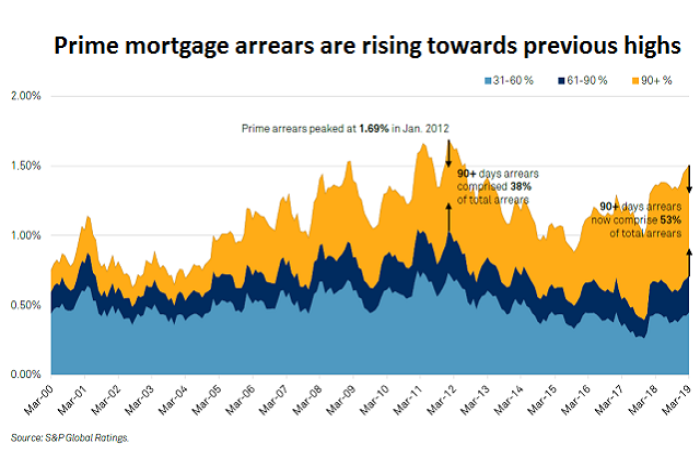
We look at the latest data from S&P Global Ratings on mortgage delinquencies, which are turning higher and becoming more entrenched.
Mortgage Arrears Tick Up In May (Again)
The latest S&P Ratings SPIN index to May 2018, based on their portfolio of mortgage backed securities showed a further move up in defaults compared with last month, from 1.36% to 1.38%.
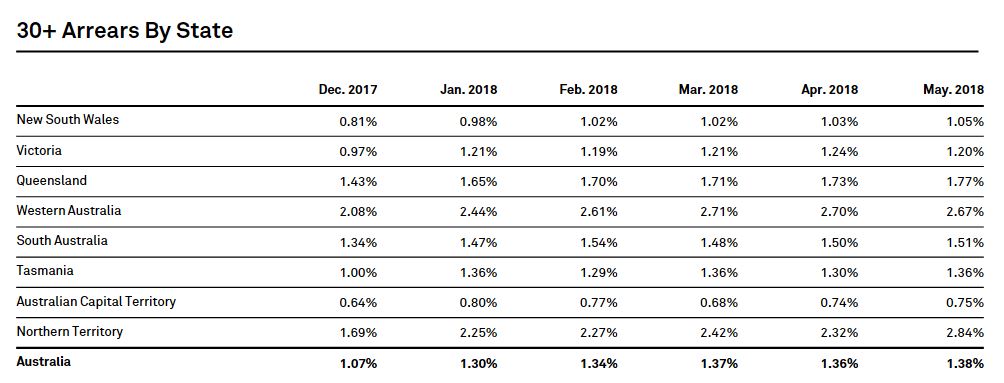
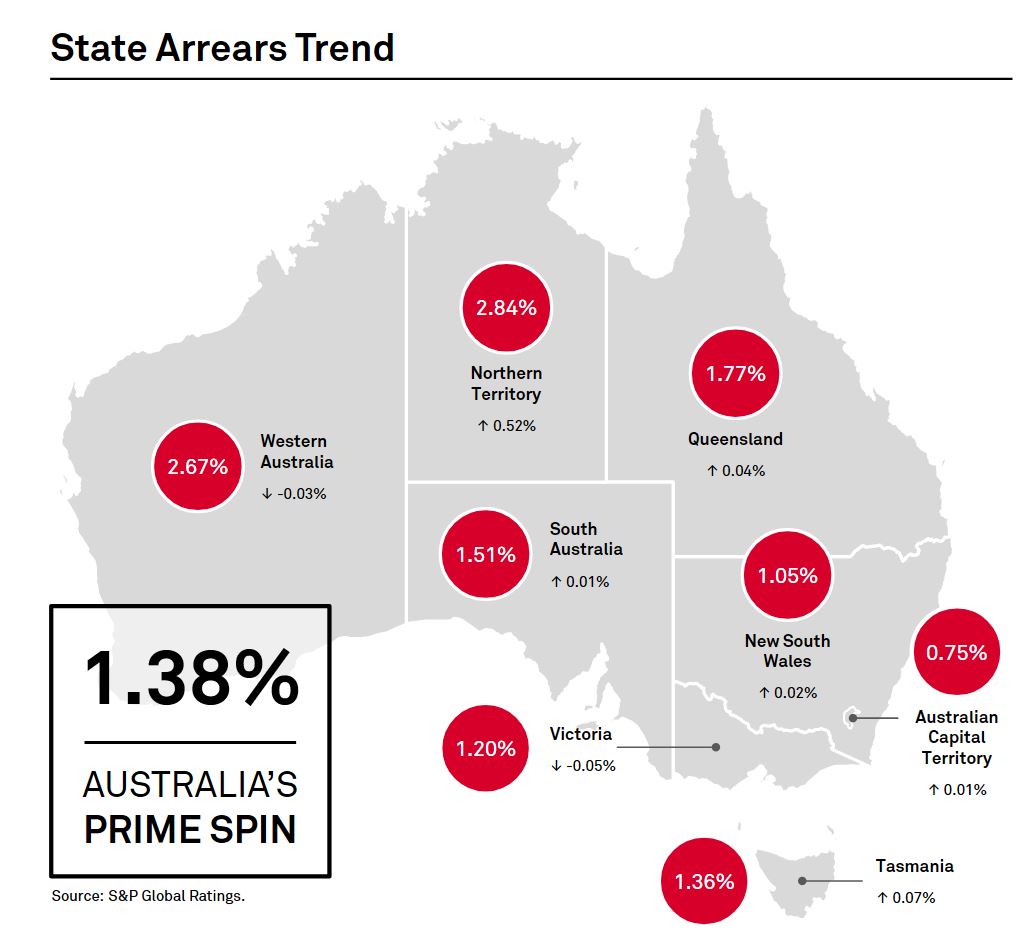 In fact, Western Australia’s default rates improved a little, as did Victoria, but there were rises in New South Wales of 0.02%, Queensland of 0.04% and Northern Territory up 0.52%. ACT has the lowest default rate at 0.75%, followed by New South Wales at 1.05% while the Northern territory and Western Australia have the highest rates of 30 default at 2.84% and 2.67% respectively.
 Looking across the period in default, the most significant rise across prime loans was in the 61-90 days bracket, up from 0.22% in April to 0.25% in May. 90 day plus arrears remained the same at 0.67%.
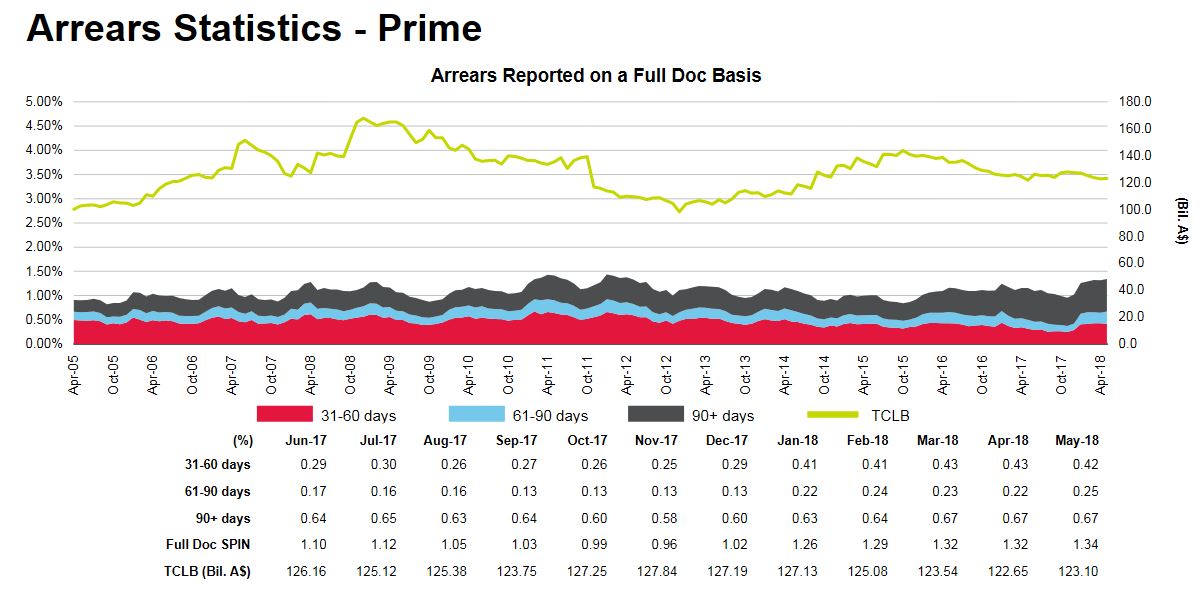 Significantly, the larger hikes were see in the major bank portfolios, with the prime spin rising from 1.36% last month to 1.38% in May. There was a rise in 61-90 day past due loans, from 0.22% last time to 0.25%.
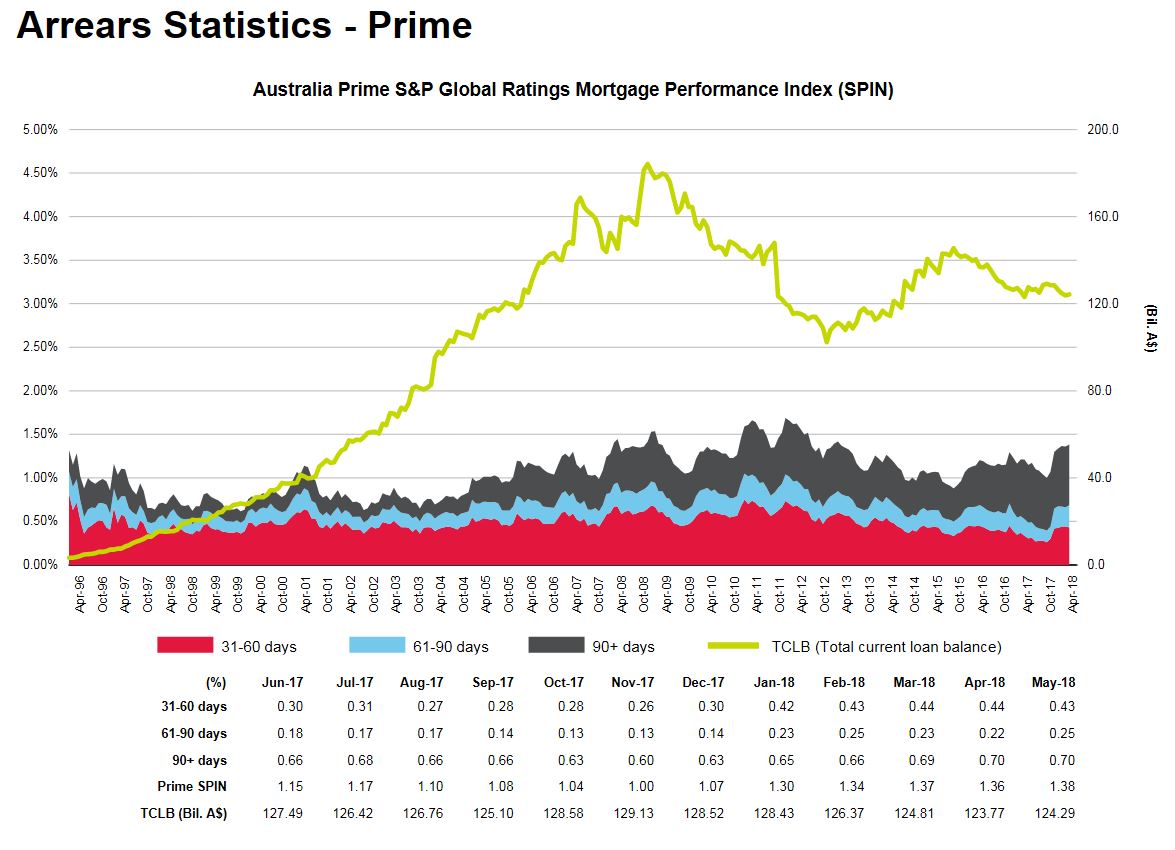 Whilst these moves are small, arrears are now as high as they were back in 2011, and interest rates are much lower today, so this highlights the risks in the system. This does not appear to be a seasonal issue, it is more structural.
Mortgage Arrears Get More Severe
The latest data from S&P Global Ratings using their Mortgage Performance Index (SPIN) to March 2018 shows a rise in arrears, and significantly a hike in 90+ defaults. WA and NT continue their upward trends.
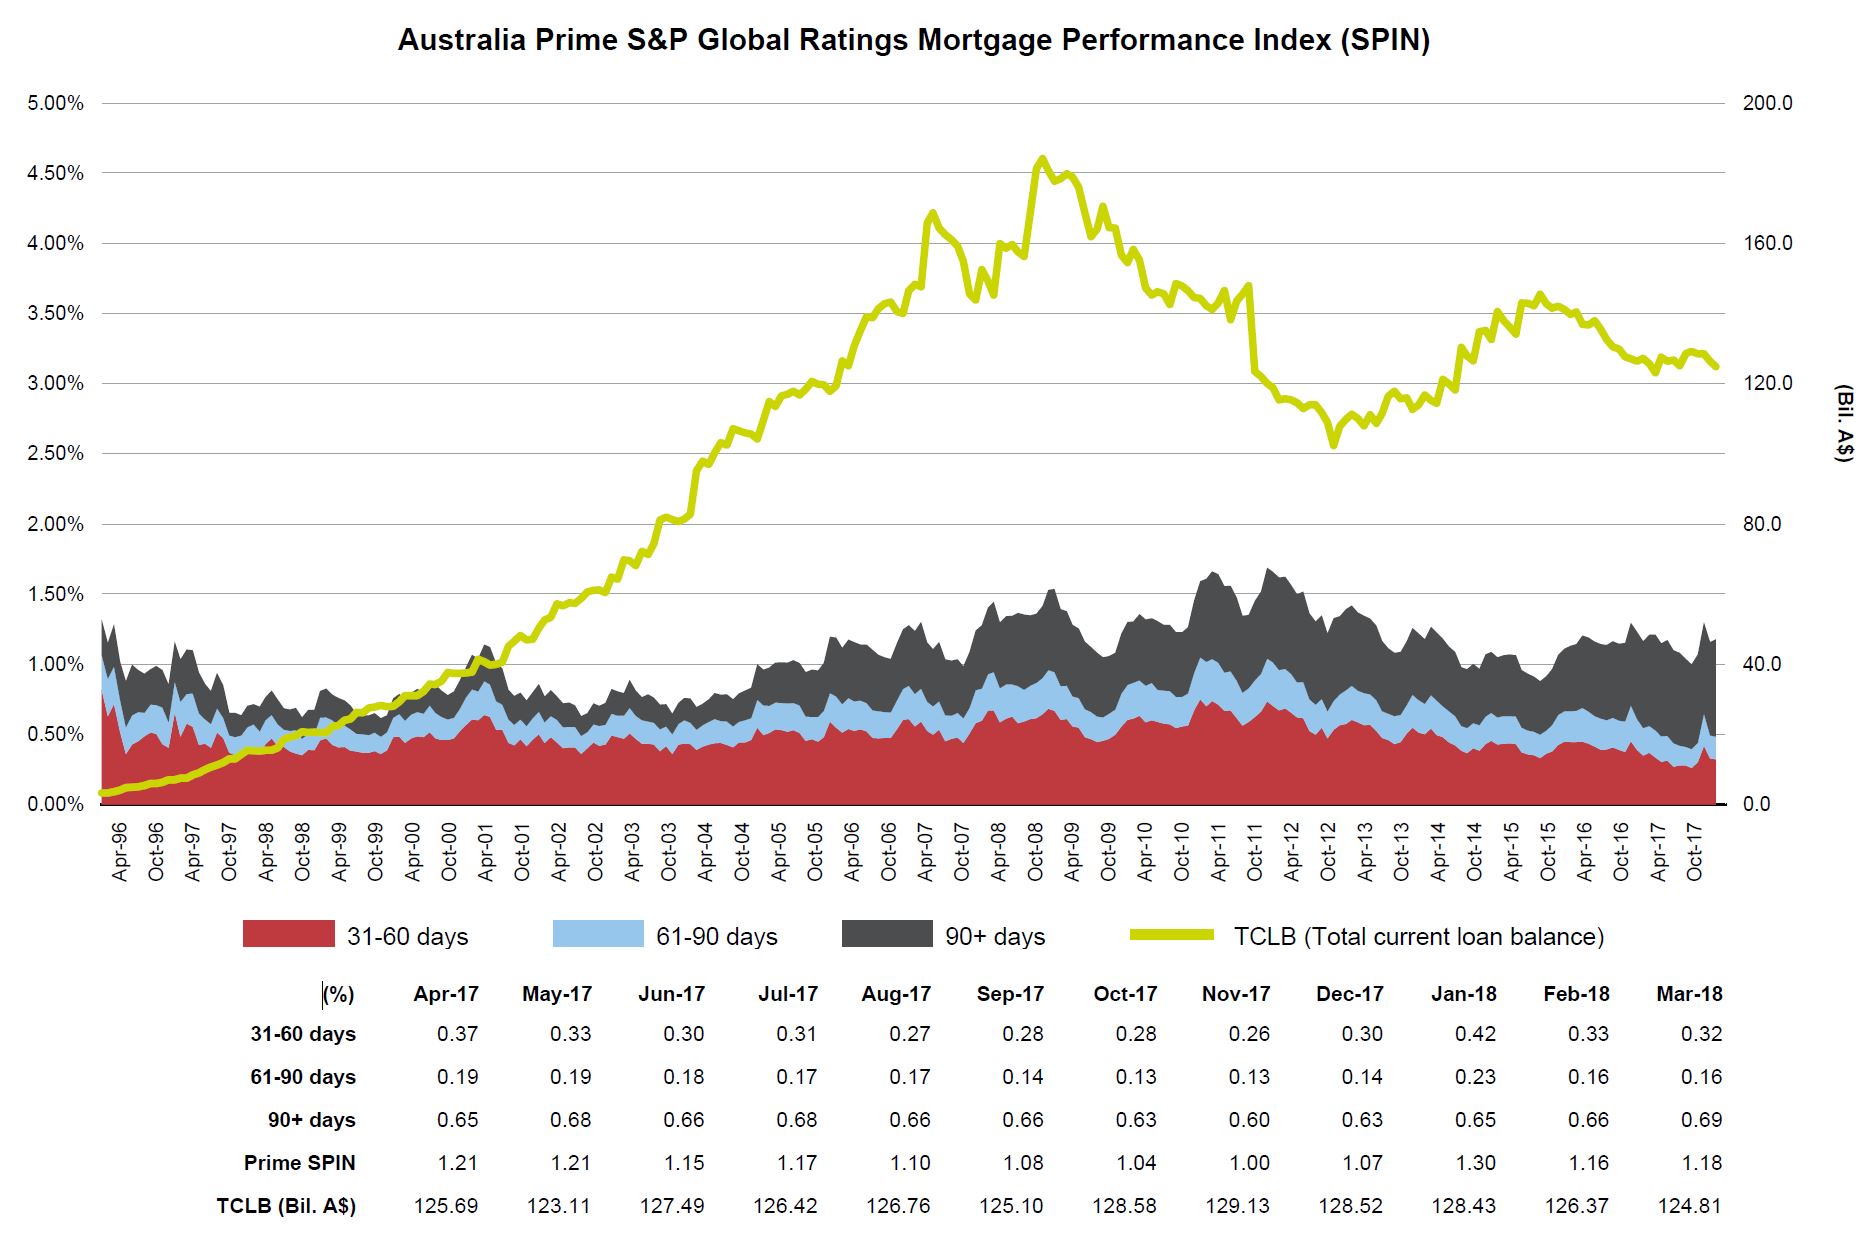
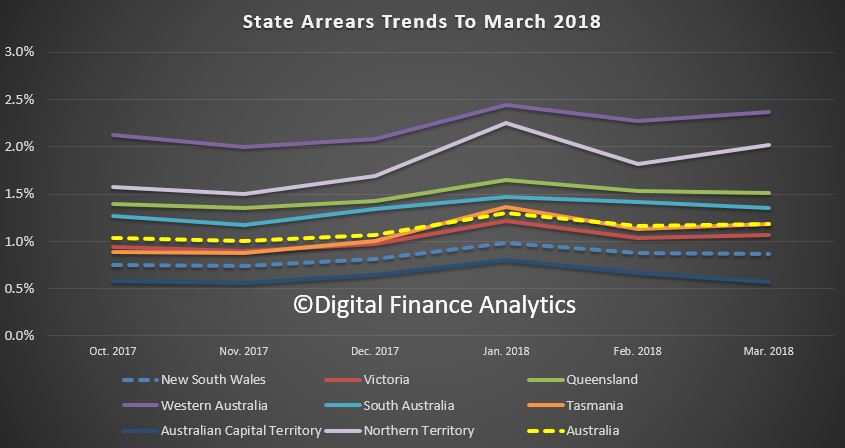 Here is the S&P chart, with the value of securitised mortgages in the pools falling. Overall defaults increased to 1.18% in March from 1.16% in February.
Arrears more than 90 days past due made up around 60% of total arrears in March 2018, up from 34% a decade earlier. This shift partly reflects a change in the reporting of arrears for loans in hardship that came in response to regulatory guidelines. Even accounting for this, however, there has been a persistent rise in this arrears category, though the level of arrears overall remains low.
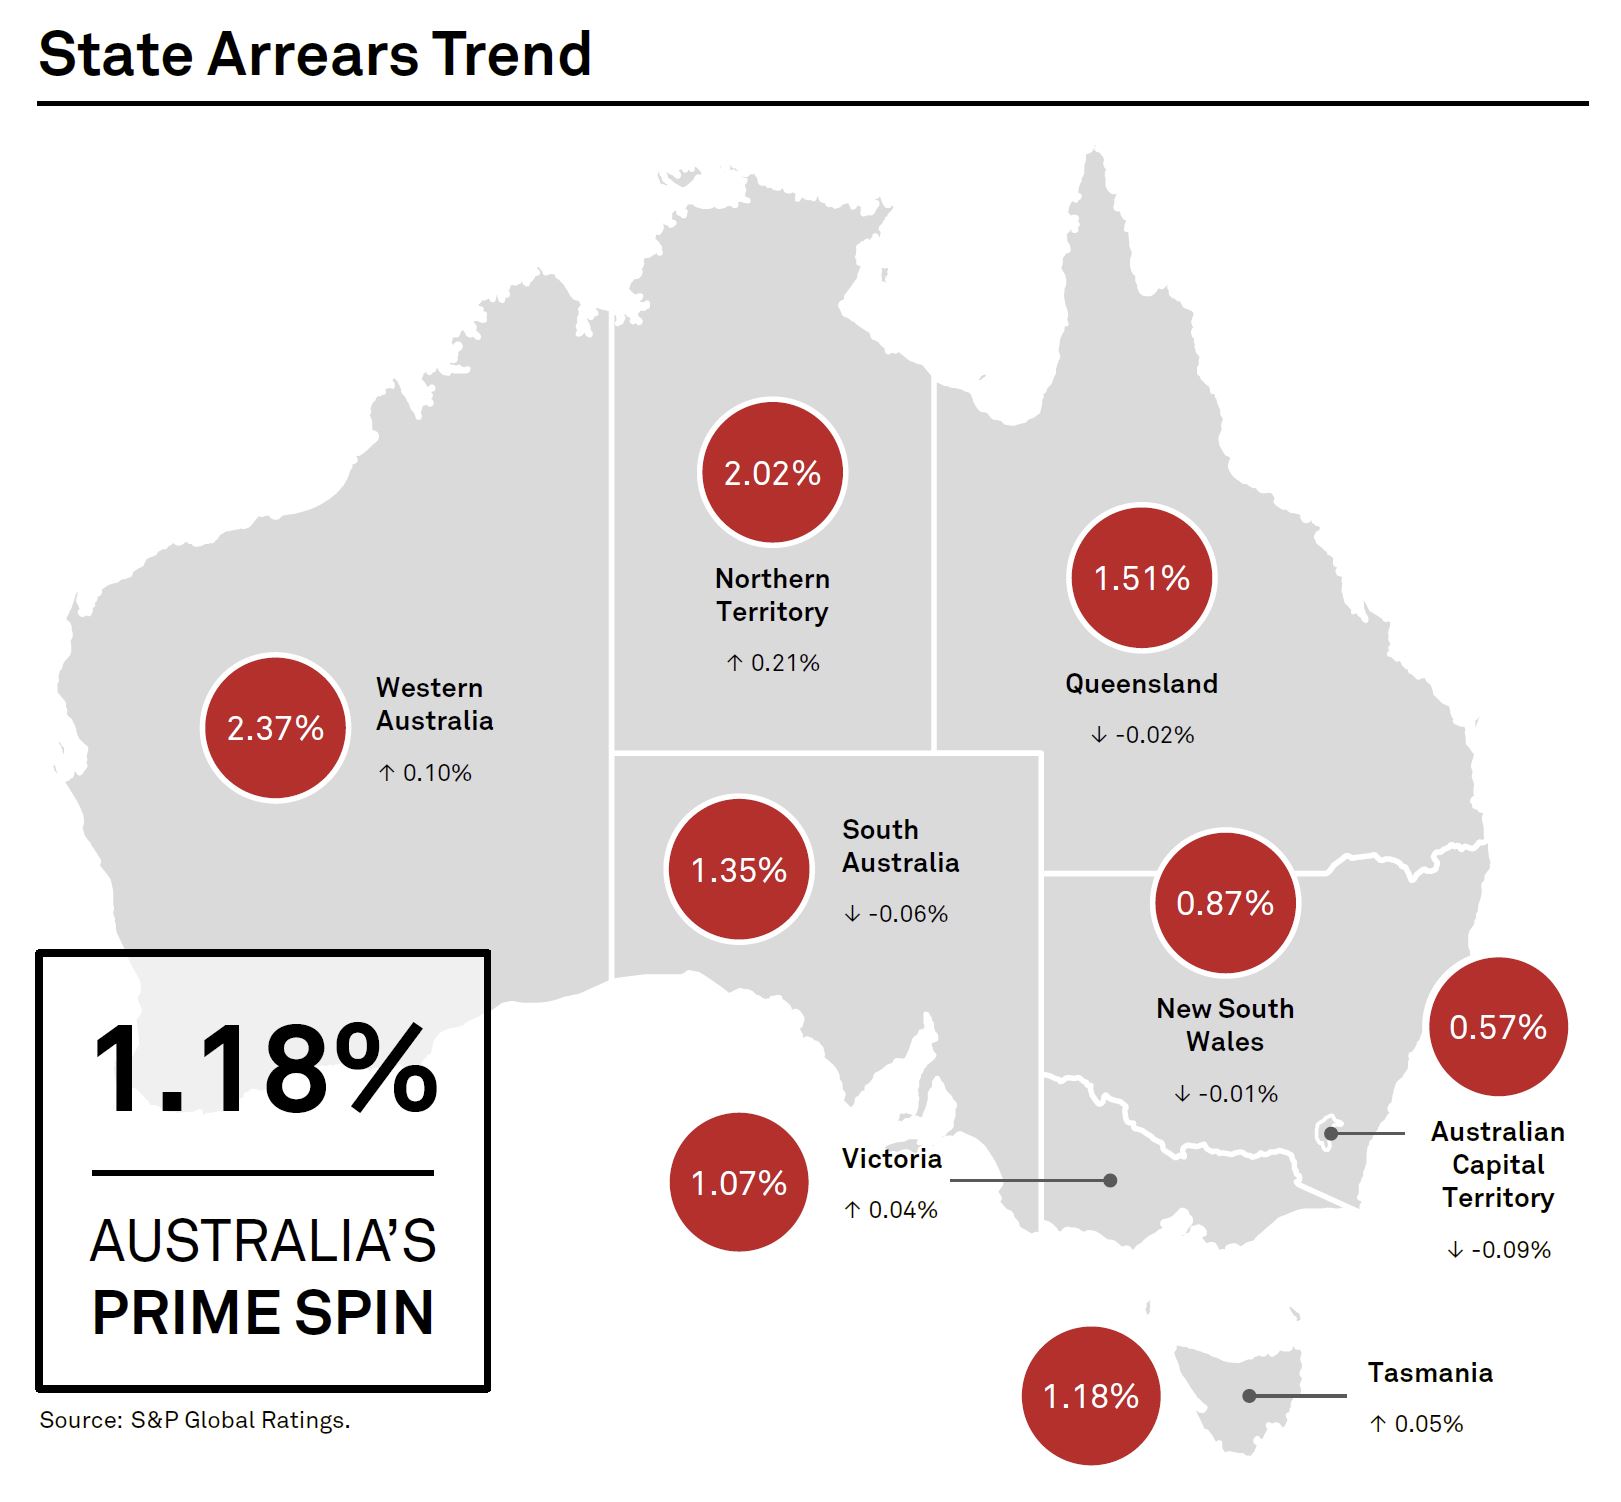
Arrears movements were mixed nationwide. Home loan delinquencies fell in New South Wales, Queensland, South Australia, and the Australian Capital Territory in March. Of note, mortgage arrears in South Australia appear to have turned a corner; the state’s March 2018 arrears of 1.35% are well down from a peak of 1.81% in January 2017. This reflects a general improvement in economic conditions in South Australia, in line with national trends. Western Australia remained the state with the nation’s highest arrears, sitting at 2.37% in March.
The trends clearly show persistent issues in WA, which chimes with the recent bank disclosures. The question is of course whether we will see defaults rising in other states as lending standards are tightened.
And I recall Wayne Byers recent comment to the effect that at these low interest rates, defaults should be lower!

