Are There More Risks In The Mortgage Book Than Surveys Suggest?

The Bank of England issued a staff working paper – “A tiger by the tail: estimating the UK mortgage market vulnerabilities from loan-level data“.

They have taken data from 14 million mortgages and run modelling across the cohorts to determine the LVR, LTI and DSR of mortgages. This is approach is an alternative to the survey led methods used by the Bank of England. Significantly, they conclude that risks in the system are understated using the survey methods (an analogy would be HILDA here); compared with the granular data. Policy makes are, they say, understating the risks.  We agree!

Our estimate provides an alternative source to track the tail of vulnerable borrowers in the UK. It suggests a larger tail compared to the available household surveys. While the Bank of England/NMG survey points to a falling tail of high DSR loans in recent years, our estimations indicate that it remained almost flat. Similarly, our estimations suggest a consistently higher share of high LTI loans over time. These results should make policy makers less sanguine about the developments in the UK mortgage market in recent years, which are traditionally analysed using these surveys.

In the absence of loan-level stock of mortgages in the previous years, policy makers have been relying on survey data to monitor risks to financial stability and calibrate policies. As already discussed, surveys can be subject to biases and small sample issues, so our work provides an alternative estimate of the LTI, DSR and LTV distributions. Notably, we find that size of the tail of vulnerable borrowers might have been higher in recent years than surveys suggest.

Figure 6 shows LTI, DSR and LTV distributions from our estimation against data from the NMG and WAS surveys as of 2015. Our estimate suggests a larger vulnerable tail (LTI above 4.5 and DSR above 40) compared to surveys. This is consistent with the finding that individuals tend to underestimate outstanding loan amount in surveys or highly indebted borrowers are under-represented in surveys. There is greater discrepancy in LTV distributions, which could be attributed to further bias in how individuals report property values in surveys.

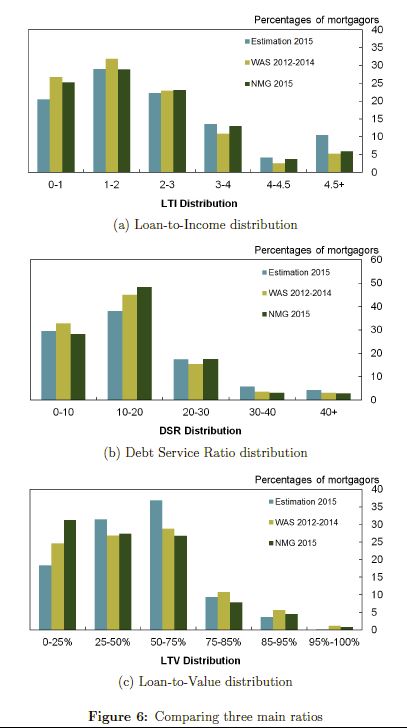
Figure 7 compares the evolution of the tail of high LTI and DSR from our estimate and surveys over time. While the NMG survey suggests that the share of loans with DSR above 40% has decreased in recent years, our estimations indicate that it remained almost  flat. Similarly, our estimations for high LTI shares are steadily higher. Our stock estimation can also shed light on the characteristics of specific cohorts of borrowers and loans. To illustrate the type of analysis can be done by using the loan-level estimate, we present the age distribution of high DSR (40%+), high LTI (4.5+) and high LTV (85%+) loans.

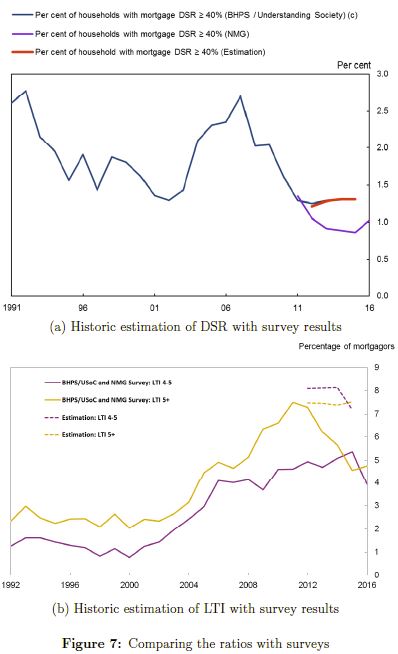
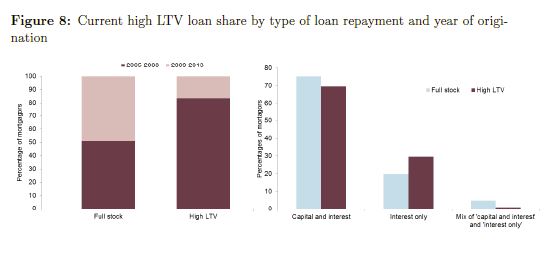
Figure 8 shows the characteristics of current high LTV loans. We find that most of the LTV loans were originated pre-2009, before credit conditions tightened materially in the UK. We also see that a large proportion of outstanding loans with high LTVs (85%+) are interest-only. This suggests that if policy makers are concerned with the tail of high-LTV mortgages that are interest-only, analysing the flow of new loans is unlikely to provide much insight, as interest-only loans are currently very rare. The focus needs to be turned to the high-LTV cohort in the stock and the interest-only loans originated in pre-crisis period.

Our estimate provides an alternative source to track specific cohorts of borrowers in the UK mortgage market. We find that a larger tail of vulnerable borrowers than household surveys suggest. While survey data suggest that the share of high DSR loans has decreased in recent years, our estimations indicate that it remained almost  flat. Similarly, our estimate of high LTI shares over time are steadily higher than surveys. All these results suggest that policy makers should be less sanguine about the developments in the UK mortgage market in recent years. As these analyses are based on very detailed granular regulatory data, we believe the results are more reliable than surveys.


Note: Staff Working Papers describe research in progress by the author(s) and are published to elicit comments and to further debate. Any views expressed are solely those of the author(s) and so cannot be taken to represent those of the Bank of England or to state Bank of England policy. This paper should therefore not be reported as representing the views of the Bank of England or members of the Monetary Policy Committee, Financial Policy Committee or Prudential Regulation Committee.

Mortgage arrears to increase in 2018: Moody’s

According to Moody’s “RMBS, ABS and covered bonds – Australia, 2018 outlook – Delinquencies will increase moderately from low levels, report”, delinquencies underlying Australian residential mortgage-backed securities (RMBS) are expected to “moderately” increase in 2018 from their current low levels.

The housing market is expected to ease, and household finances remain under pressure.

Of note is the rise in the relative share of non-bank lending (who are not under the same regulatory control as the banks) and the continued impact from the mining downturn, especially in WA.

We expect mortgage delinquencies in outstanding RMBS deals  to increase moderately from their low levels because of the continued after-effects of weaker conditions in states reliant on the mining industry and less favourable housing market and income dynamics.

With Western Australia and other states reliant on mining pushing up delinquencies this year, this will continue in 2018,

The balance of risks in new RMBS deals will also change, as bank-sponsored RMBS issued in 2018 will include a lower proportion of interest-only, high loan-to-value ratio (LVR) and housing investment loans, following regulatory measures to curb the origination of riskier mortgages.

RMBS issued by the non-banks will include a greater percentage of interest-only and investment loans than has been recorded in the past as these lenders have fallen outside of APRA’s regulatory remit thus far.

No additional risk from brokers, says S&P

From Australian Broker.

Leading analysts at S&P Global Ratings have commented on the major banks’ use of brokers, saying that trends in third party channels are not indicative of any additional risks for the industry.

These views come from the agency’s analysis of major bank lending practices including governance and controls around brokers, said Sharad Jain, S&P director of financial institutions ratings, at an Asia-Pacific Banking Insights session entitled What’s The Latest Credit Outlook For Australian Banks? held yesterday (29 November).

Despite these views, Jain admitted there may be constraints around making informed commentary in this area.

“We do not see any significant difference in the outcomes [between broker and proprietary] but that data itself is constrained because [it] does not come through any period of significant stress.”

While on the face of it, there may seem to be additional risks through brokers, current data does not back this up, he said.

Nico de Lange, another S&P director of financial institutions ratings speaking at the event, predicted that the broker channel would continue to be a major source of new business for the major banks.

“It will remain a channel that they [will] be focusing on but what might happen is that there might be different strategies within the major banks on the importance that the broker channels might play.”

While some of the major banks had been increasing the use of brokers, others such as the Commonwealth Bank of Australia (CBA) had slightly decreased their use of third party, he said.

Australian 3Q17 Mortgage Arrears See Seasonal Falls

Australia’s RBMS mortgage arrears fell to 1.02% in 3Q17, a 15bp decrease from the previous quarter; consistent with the nine-year long seasonal trend where 30+ days arrears have eased in the third quarter. Fitch Ratings believes the curing of third-quarter arrears was helped by borrowers using tax return receipts to make repayments.

The 30+ days arrears were 4bp lower than in 3Q16, reflecting Australia’s improved economic environment and lower standard variable interest rates for owner-occupied lending. Unemployment improved by 10bp and real wage growth, although low, was positive. Underemployment has continued to improve, reflecting an increase in available work for underemployed workers.

Prepayment rates remained low during 2017, with the conditional prepayment rate (CPR) staying below 20% for three consecutive quarters; the longest period this rate has remained below 20% since 2011. The CPR increased slightly qoq to 19.6%, from 19.1%, while the Dinkum RMBS Index borrower payment rate increased to 21.6% qoq, from 21.2%.

The gap between investor lending and owner-occupied rates has widened, as authorised deposit-taking institutions respond to regulatory investment and interest-only limits on new loan origination. Historically, investors paid a 25bp-30bp premium over owner-occupied loans, but this widened to 60bp in September 2017.

Losses experienced after the sale of collateral property remained extremely low, with lenders’ mortgage insurance payments and excess spread sufficient to cover principal shortfalls in all transactions during the quarter.

Fitch’s Dinkum RMBS Index tracks arrears and the performance of mortgages underlying Australian residential mortgage-backed securities.

RMBS Mortgage Arrears Lower Again, But…

S&P Global Ratings said RMBS Mortgage arrears fell to 1.08% in September across Australian down from 1.10% in August 2017.

They say mortgage arrears rose in both the Northern Territory and the ACT during September but fell elsewhere. While the ACT tops the list with a rise mortgage arrears it is only at a low 0.64%, compared with Western Australia who has the highest arrears of 2.21%.

However, while outstanding loan repayments on 30-to-60-day arrears also declined in most states between January and September, 90-day+ arrears  rose in Western Australia and Queensland. This is the same as we saw recently in the bank reporting season.

S&P said the growth in full-time jobs is positive for mortgage arrears. In addition, the rises rates on in more risky investor loans have minimal impact on RMBS.

This is a myopic view of mortgage portfolios as securitised loans are selected, and seasoned to manage risks. To that extent, it is not necessarily a good indicator of the wider market – including investor loans.

S&P expects arrears to rise over the coming months, as they “traditionally start to increase in November and continue through to March.”

This from Macquarie shows the trends.


Genworth 3Q Update Highlights Regional Risks

Lender Mortgage Insurer, Genworth a bellwether for the broader mortgage industry,  has reported statutory net profit after tax of $32.1 million and underlying NPAT of $40.5 million for the third quarter ended 30 September 2017.

While the volume of new business written was down 9.8% on 3Q16 to $5.5 bn, the gross written premium was down only 3.9% to $88.6 million. Underlying NPAT was down 14.5% to $40.5 million.

The total portfolio of delinquencies rose 4.4% to 7,146, and the loss rate overall was 3 basis points. The regional variations are stark.

The loss ratio however fell, 8.3 pts to 37%, thanks to (DFA suggests) equity linked to rising home prices. New South Wales and Victoria continue to perform strongly. However, the performance in Queensland and Western Australia remains challenging and delinquencies are elevated due to the slowdown in those regional and metropolitan areas that have previously benefited from the growth in the resources sector.

The 2008 book year was affected by the economic downturn experienced across Australia and heightened stress among self-employed borrowers, particularly in Queensland, which was exacerbated by the floods 2011. Post PostPost-GFC book years seasoning at lower levels as a result of credit tightening. Underperformance for 2012-14 books have been predominantly driven by resource reliant states of QLD and WA following the mining sector downturn however has started to show signs of stabilising over recent months.

There is considerable variation in economic activity across the country with continued growth in New South Wales and Victoria offset by weaker activity in Queensland and, in particular, Western Australia.

Investment income of $15.6 million in 3Q17 included a pre-tax mark-to-market unrealised loss of $12.0 million ($8.4 million after-tax). As at 30 September 2017, the value of Genworth’s investment portfolio was $3.4 billion, 89 per cent of which continues to be held in cash and highly rated fixed interest securities.

As at 30 September 2017, the Company had invested $214 million in Australian equities in line with the previously stated strategy to improve investment returns on the portfolio within acceptable risk tolerances. After adjusting for the mark-to-market movements, the 3Q17 investment return was 2.88 per cent per annum, down from 3.51 per cent per annum in 3Q16.

The Company has completed the on-market share buy-back to a value of $45 million and intends to continue the buy-back for shares up to a maximum total value of $100 million, subject to business and market conditions, the prevailing share price, market volumes and other considerations.

Genworth previously advised that its customer, the National Australia Bank Limited, extended its Supply and Service Contract for the provision of Lenders Mortgage Insurance (LMI) for NAB’s broker business. The term of the contract has been extended by one year to 20 November 2018.

Genworth expects 2017 NEP to decline by approximately 10 to 15 per cent. The full year loss ratio guidance has been updated to be between 35 and 40 per cent (based on the current premium earning pattern). Any change to the premium earning pattern may result in a change to these expectations

Investor Loan Risk Is Accelerating

Traditionally in the Australian context loans to property investors have tended to perform better than loans to owner occupiers. This is because investors receive rental income streams to help pay for the mortgage costs, they are willing to carry the costs of the property against future capital gains, and many will be able to offset costs against tax, especially when negatively geared. In addition, occupancy rates in most states have been stellar.

But things are changing, as the costs of borrowing for investment purposes have risen (thanks to the banks’ out of cycle rises), while rental returns are flat, or falling and costs of managing the property are rising. The supply of investment property is rising, and occupancy rates are declining in a number of key markets.

So today, we look at the latest gross and net rental yields by using our Core Market Model.

First, we look at yields by type of property. Gross yield is the rental streams received compared with the value of the property; before costs. Net yield is calculated by subtracting the costs of the property, including interest costs on mortgages, management costs and other ongoing maintenance costs. We calculate the net yield before any tax offsets.

Across the nation, units overall are providing a slightly better net return than houses.

By state, VIC has the average worse net rental yield, followed by NSW, while TAS, NT and ACT have the highest net returns.

If we drill down into the regions in the states, we see some significant variations.

If we apply our core market segmentation, we find that more affluent households are getting better returns on average compared with the battlers and younger buyers. Perhaps experience counts.

We also see that Portfolio Investors, those with multiple properties, are on average getting better returns, whilst first time buyers are the least likely to get a positive net return. Again, experience seems to count.

Finally, in the ANZ data today, released as part of their results pack was this slide. It shows a trend which we have been observing too, that is delinquencies are rising faster among property investors (to the point where the same ratio ~0.7% applies to both investors and owner occupiers).

More, concerning, our forward modelling suggests that investors are likely to become a significant higher risk as rates rise, rental returns stall, and occupancy rates fall.  Just one more reason why we think the property investment party may be over.

Higher risks need to be factored into the banks’ modelling, especially as home price momentum is ebbing, so the value of these investment properties may start to fall.

Banks blacklist Brisbane postcodes

From Mortgage Professional Australia.

Banks are cracking down on loans to borrowers buying into Brisbane’s over-supplied apartment market, with a number of risky postcodes identified, which require bigger deposits.

The four major banks – Westpac, Suncorp, Australia and New Zealand Banking Group (ANZ), and National Australia Bank (NAB) – are restricting lending for certain Brisbane postcodes, where apartment buyers will now be required to have a deposit of up to 20% to qualify for a home loan.

Suncorp has blacklisted nearly 40 postcodes in the Queensland capital, including Inner Brisbane, Teneriffe, Fortitude Valley, Bowen Hills, and Herston.

The banks are refusing to loan more than 80% of the cost of a unit due to “[weaknesses] in the investment market” as well as the current oversupply in inner-city apartments. Prices for apartments in inner-Brisbane have dropped to their lowest level in three years and a recovery is not expected for at least another 12 months.

According to the Domain Group’s State of the Market report for the September quarter, Brisbane’s median apartment price was $376,685 during that quarter – down more than 3% over the quarter and more than 6% year-on-year.

Andrew Wilson, chief economist at the Domain Group, said the supply of apartments in suburbs such as the West End has outstripped demand.

“Even some of the outer suburbs such as Chermside have had significant levels of development recently, and as a consequence, supply has moved ahead of demand,” he told ABC News. “But if we look at the approvals … that [has] declined sharply so when the existing stock is soaked up there certainly will not be a lot of replacement stock coming through.”

Last month, RBA Governor Philip Lowe said that Brisbane’s property market was coming under closer scrutiny.

“We are … watching the Brisbane property market carefully, particularly the effect on prices of the large increase in the supply of new apartments,” he said during a dinner.

According to the Reserve Bank’s latest Financial Stability Review, nationally, apartment prices have continued to record weaker price growth than detached housing – a weakness that is consistent with the increased supply of apartments.

“Some concerns remain about the process of absorbing the substantial increase in new apartments in Brisbane. Brisbane apartment prices continue to fall, although the rate of decline has slowed,” the RBA said.

Here are the top 10 Brisbane postcodes that require a 20% deposit:

4000 Inner Brisbane
4010 Albion
4006 Fortitude Valley, Bowen Hills, Newstead, Herston
4101 Highgate Hill, South Brisbane, West End
4102 Dutton Park, Woolloongabba
4005 New Farm, Teneriffe
4011 Clayfield, Hendra
4032 Chermside
4122 Mansfield, Mount Gravatt, Wishart
4171 Balmoral, Bulimba, Hawthorne


Getting Deep and Dirty On Mortgage Risk

We have been busy adding in new functionality to our Core Market Model, which is our proprietary tool, drawing data from our surveys and other public and private data sources to model and analyse household finances.

We measure mortgage stress on a cash flow basis – the October data will be out next week – and we also overlay economic data at a post code level to estimate the 30-day risk of default (PD30). But now we have added in 90-day default estimates (PD90) and the potential value which might be written off, measured in basis points against the mortgage portfolio. We also calibrated these measures against lender portfolios.

So today we walk though some of the findings, and once again demonstrate that granular analysis can provide a rich understanding of the real risks in the portfolio. Risks though are not where you may expect them!

First we look risks by by state. This chart plots the PD30 and PD90 and the average loss in basis points. WA leads the way with the highest measurement, then followed by VIC, SA and QLD. The ACT is the least risky area.

So, looking at WA as an example, we estimate the 30-day probability of  default in the next 12 months will be 2.5%, 90-day default will be 0.75% and the risk of loss is around 4 basis points. This is about twice the current national portfolio loss, which is sitting circa 2 basis points.

Turning to our master household segmentation, we find that our Multicultural Establishment segment has the highest basis point risk of loss, at around 3 basis points, followed by Young Affluent, Exclusive Professionals and Young Growing Families. This immediately shows that risk and affluence are not totally connected. In fact our lower income groups, are some of the least risky. The PD30 and PD90 follows this trend too.

The Loan to Value bands show some correlation to risk, although the slope of the curve is not that aggressive, indicating that LVR as a risk proxy is not that strong. This is because in a rising market, LVRs will rise automatically, irrespective of serviceability.

A more sensitive measure of risk is Loan To Income (which APRA mentioned yesterday for the first time!). Here we see a significant rise in risk as LTI rises. Above 6 times income the risk starts to rise, moving from around 3 basis points, to 6 basis points at an LTI of 10, and 12 basis points at an LTI of 15+. So rightly LTI should be regarded as the leading risk indicator, yet many lenders are yet to incorporate this in their models. It is better because in the current flat income environment, income ratios are key.

Age is a risk indicator too, with households below 40 showing a higher risk of loss (3 basis points) compared with those over 50 (2.25). Even those into retirement will still represent some level of risk.

Finally, and here it gets really interesting, we can drill down into post codes. We plotted the top 20 most risky post codes across the country from a basis points loss perspective. What we found is that in the top 20 there is a high representation of more affluent post codes, especially in WA, with Cottlesloe, Nedlands and City Beach all registering. We also find places like Double Bay and Dover Heights in Sydney, Hinchenbrook  in QLD and Caulfield in VIC appearing. These are, on a more traditional risk view, not areas which would be considered higher risk, but when we take the size of the loans and cash flows into account, they currently carry a higher risk profile from an absolute loss perspective.

So, we believe the time has come for more sophisticated, data driven analysis of mortgage risks. And risks are not where you might think they are!

APRA Admits Mortgage Lending Standards Have Deteriorated

APRA Chairman Wayne Byers gave the keynote address at the COBA 2017 – Customer Owned Banking Convention in Brisbane. It included some remarks on the state of play of housing lending standards making the point that until recently, systematically, lending standards were eroding, but this is now being reversed. He specifically mentioned a desire for borrower debt-to-income levels to be appropriately constrained in anticipation of (eventually) rising interest rates.

We would say better late than never!

Earlier this year, we announced further measures to reinforce prudent standards across the industry. We did this because, in our view, risks and practices were still not satisfactorily aligning. We remain in an environment of high house prices, high and rising household indebtedness, low interest rates, and subdued income growth. That environment has existed for quite a few years now, and one might expect a prudent banker to tighten lending standards in the face of higher risk. But for some years standards had, absent regulatory intervention, been drifting the other way. Indeed, if we look back at standards that the industry thought important a decade ago, we see aspects of prudent practice that we are trying to re-establish today.

The erosion in standards has been driven, first and foremost, by the competitive instincts of the banking system. Many housing lenders have been all too tempted to trade-off a marginal level of prudence in favour of a marginal increase in market share. That temptation has, unfortunately, been widespread and not limited to a few isolated institutions – the competitive market pushes towards the lowest common denominator. The measures that we have put in place in recent years have been designed, unapologetically, to temper competition playing out through weak credit underwriting standards.

Since we have been focussing on lending standards, APRA’s approach has been consistently industry-wide: the measures apply to all ADIs, albeit with additional flexibility for smaller, less systemic players around the timing and manner in which they have been expected to adjust practices. There is no reason, however, why poor quality lending should be acceptable for some ADIs and not others, or in one geography and not others. Prudent standards are important for all.

At a macro level, our efforts appear to be having a positive impact. As I have spoken about previously, serviceability assessments have strengthened, investor loan growth has moderated and high loan-to-valuation lending has reduced. New interest-only lending is also on track to reduce below the benchmark that we set earlier this year. Put simply, the quality of lending has improved and risk standards have strengthened.

We would ideally like to start to step back from the degree of intervention we are exercising today. Quantitative benchmarks, such as that on investor lending growth, have served a useful purpose but were always intended as temporary measures. That remains our intent, but for those of you who chafe at the constraint, their removal will require us to be comfortable that the industry’s serviceability standards have been sufficiently improved and – crucially – will be sustained. We will also want to see that borrower debt-to-income levels are being appropriately constrained in anticipation of (eventually) rising interest rates.

These expectations apply across the industry, to large and small alike. Pleasingly, the industry is moving in the right direction to achieve that. Improved serviceability standards are being developed, and policy overrides are being monitored more thoroughly and consistenly. The adoption of positive credit reporting, which APRA strongly endorses, will remove a blind spot in a lender’s ability to see a borrower’s leverage. Coupled with the higher and more risk-sensitive capital requirements that I mentioned earlier, these developents should – all else being equal – provide an environment in which some of our benchmarks are no longer needed. The review of serviceabilitiy standards across the small ADI sector that we are currently undertaking will help inform our judgement as to how close we are to that point.

His comments on the role of mutual ADI’s are are worth reading…