We now look across to the west, with mortgage stress modelling across WA, and mapping in Greater Perth. Read about our approach here.
The postcode with the higher number of households in mortgage stress in WA is Merriwa 6030, a suburb of South Western, Heartlands and about 35 kms from Perth. The average age here is 35 years and 40.6% of households have a mortgage. Some are in severe stress here.
Next is Samson, 6163, a suburb of Perth, Southern Suburbs, about 14 kms from the CBA and the federal electorate of Fremantle. The average age here is 45 years and 36.8% of households have a mortgage.
Third is Carey Park, 6230, a suburb of South Western, South West, WA, and about 157 kms from Perth. 28.3% of households have a mortgage.
Next is Innaloo, 6018, a suburb of Perth, Other Western Suburbs and about 10 kms from the CBD. The average age here is 35 years and 32.8% of homes are mortgages. There are a number of households in serve stress here.
Meadow Springs follows on 6210, is a suburb of South Western, Heartlands, and about 61 kms from Perth. The average age is 37 years and 39.5% of households have a mortgage. Some are in serve stress here.
Note Wembley, 6014, a suburb of Perth about 5 kms from the CBD. The average age is 34, and 31.6% of households have a mortgage, but here there are the highest number in severe stress across Greater Perth.
Here is the geo-mapping for Greater Perth. The Blue areas are the post codes with the highest number of stressed households.
We turn our attention to VIC and Greater Melbourne with the latest mortgage stress mapping. Read about our approach here.
We are looking at owner occupied loans, with data to 1st March 2017.
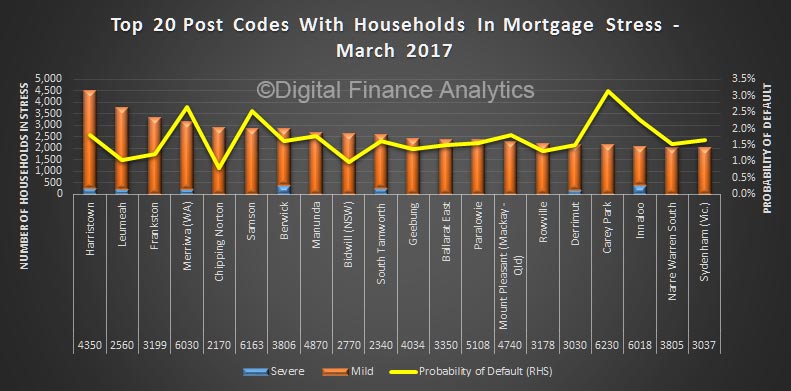
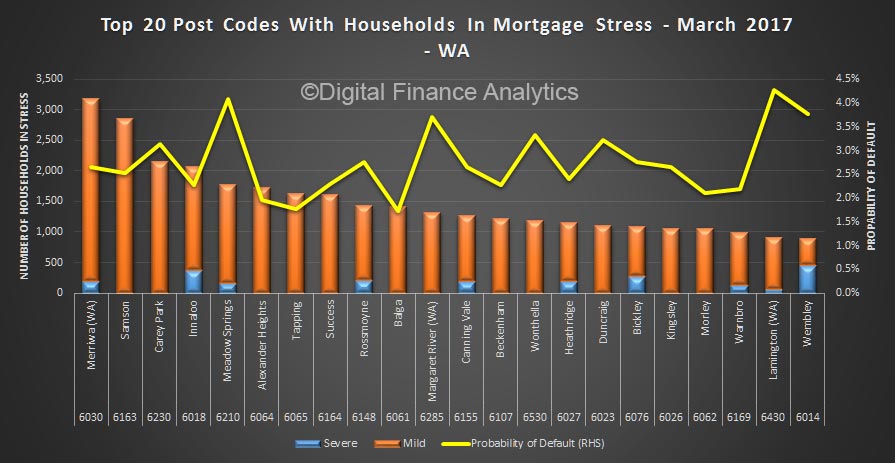
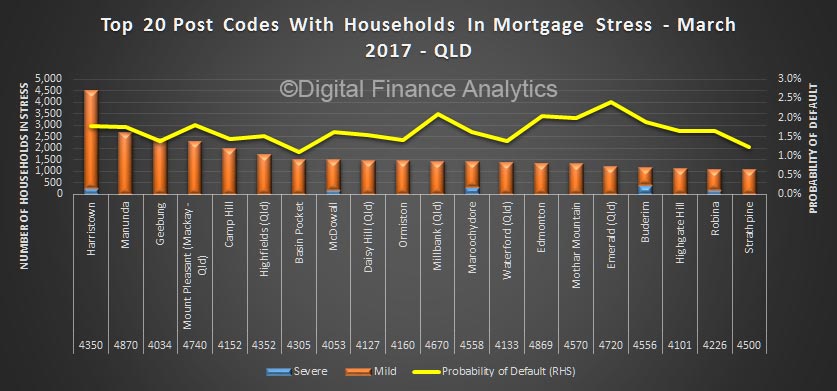
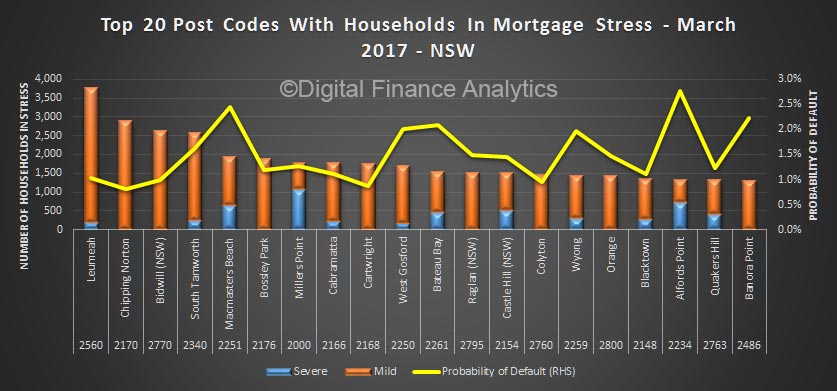
First here are the top twenty post codes across Victoria with the largest numbers of households in mortgage stress.
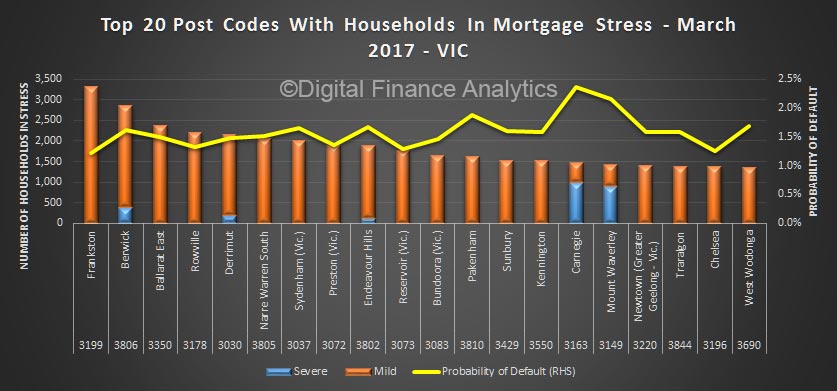
Frankston, 3199 heads the list and is suburb of Melbourne on the Mornington Peninsula about 39 kms from the CBD. More than 30% of households have a mortgage here, and the average age is 38 years old.
Next is Berwick, 3806, a suburb of Melbourne, South East and about 41 kms from the CBD. More than 52% of households have a mortgage and the average age is 35 years. Berwick has a relatively higher proportion of severely stressed households (shown by the blue bar above). These households are in more immediate danger of potential default.
Third is Ballarat East, 3350, a suburb of South Western Victoria, Ballaratt, and about 99 kms from Melbourne. More than 30% of households here have a mortgage and the average age is 38 years.
Fourth is Rowville, 3178, a suburb of Melbourne, South East and about 26 kms from Melbourne. The average age is 36 years and 54% of households have a mortgage.
Fifth is Derrimut, 3030, a suburb of Melbourne, Geelong, and 18 kms from the CBD. The average age is 29 years and more than 70% of households have a mortgage. Note again the number of severely stressed households in the district.
Finally, note Carnegie, 3163, a suburb of Melbourne, East and about 11 kms from the CBD. 28% of households have a mortgage, and the average age is 35 years, but there are more severely stressed households here, than stressed. We think this is an indication of potential relatively higher risks.
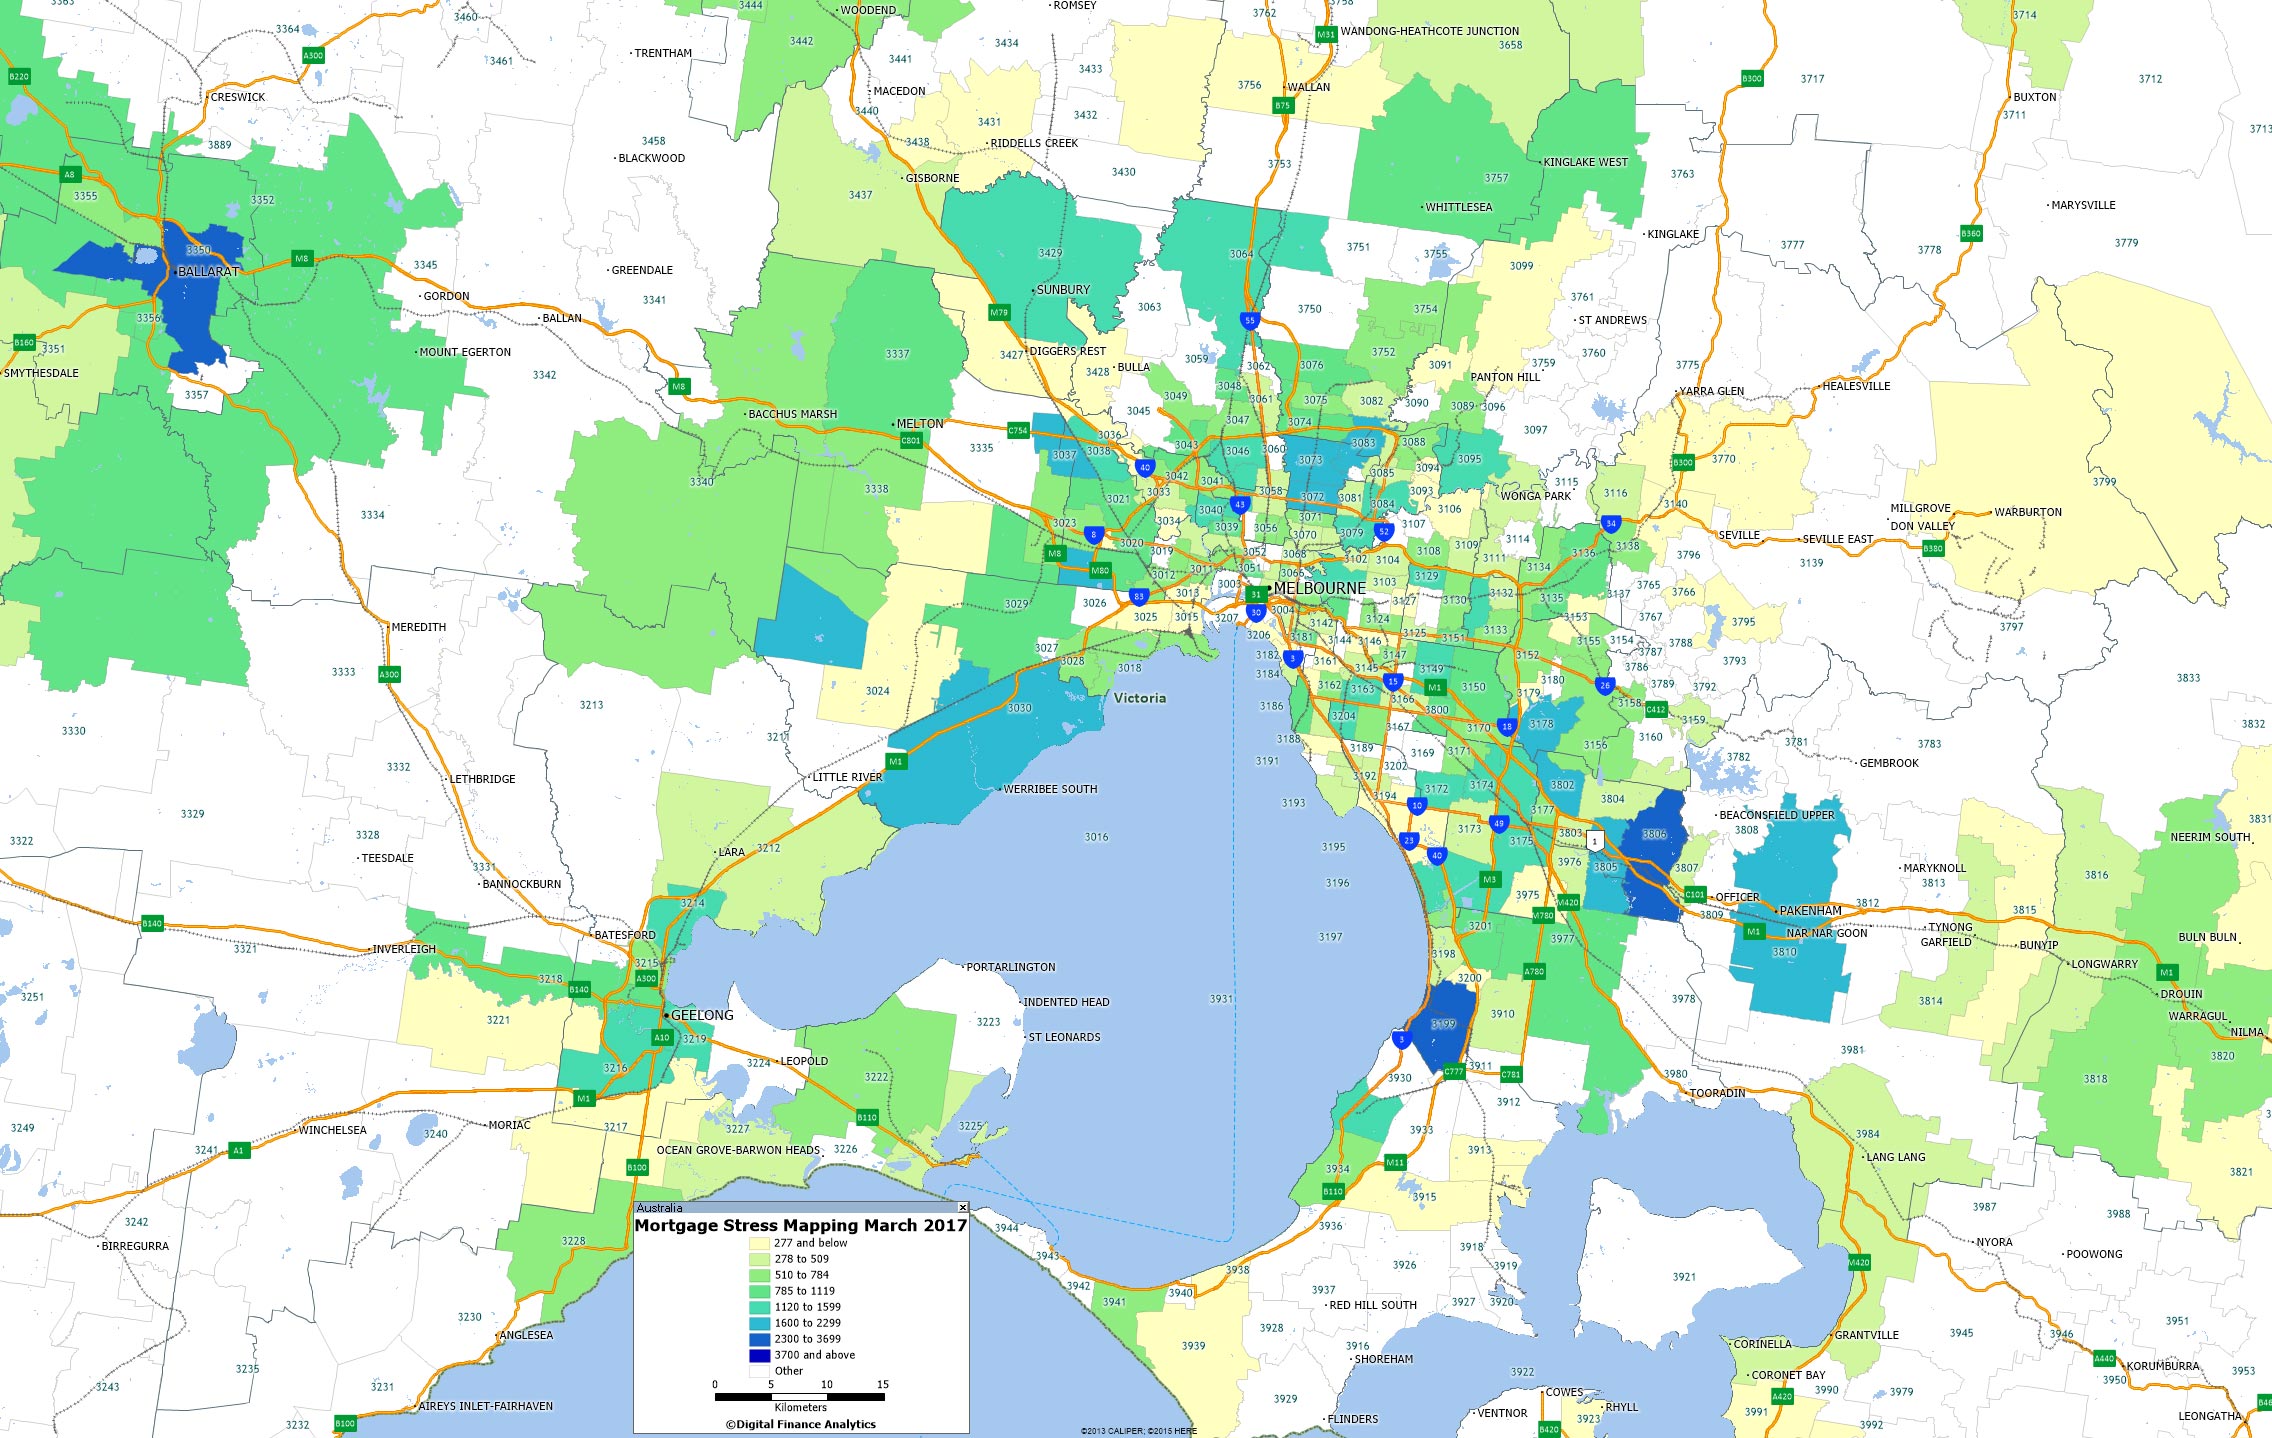
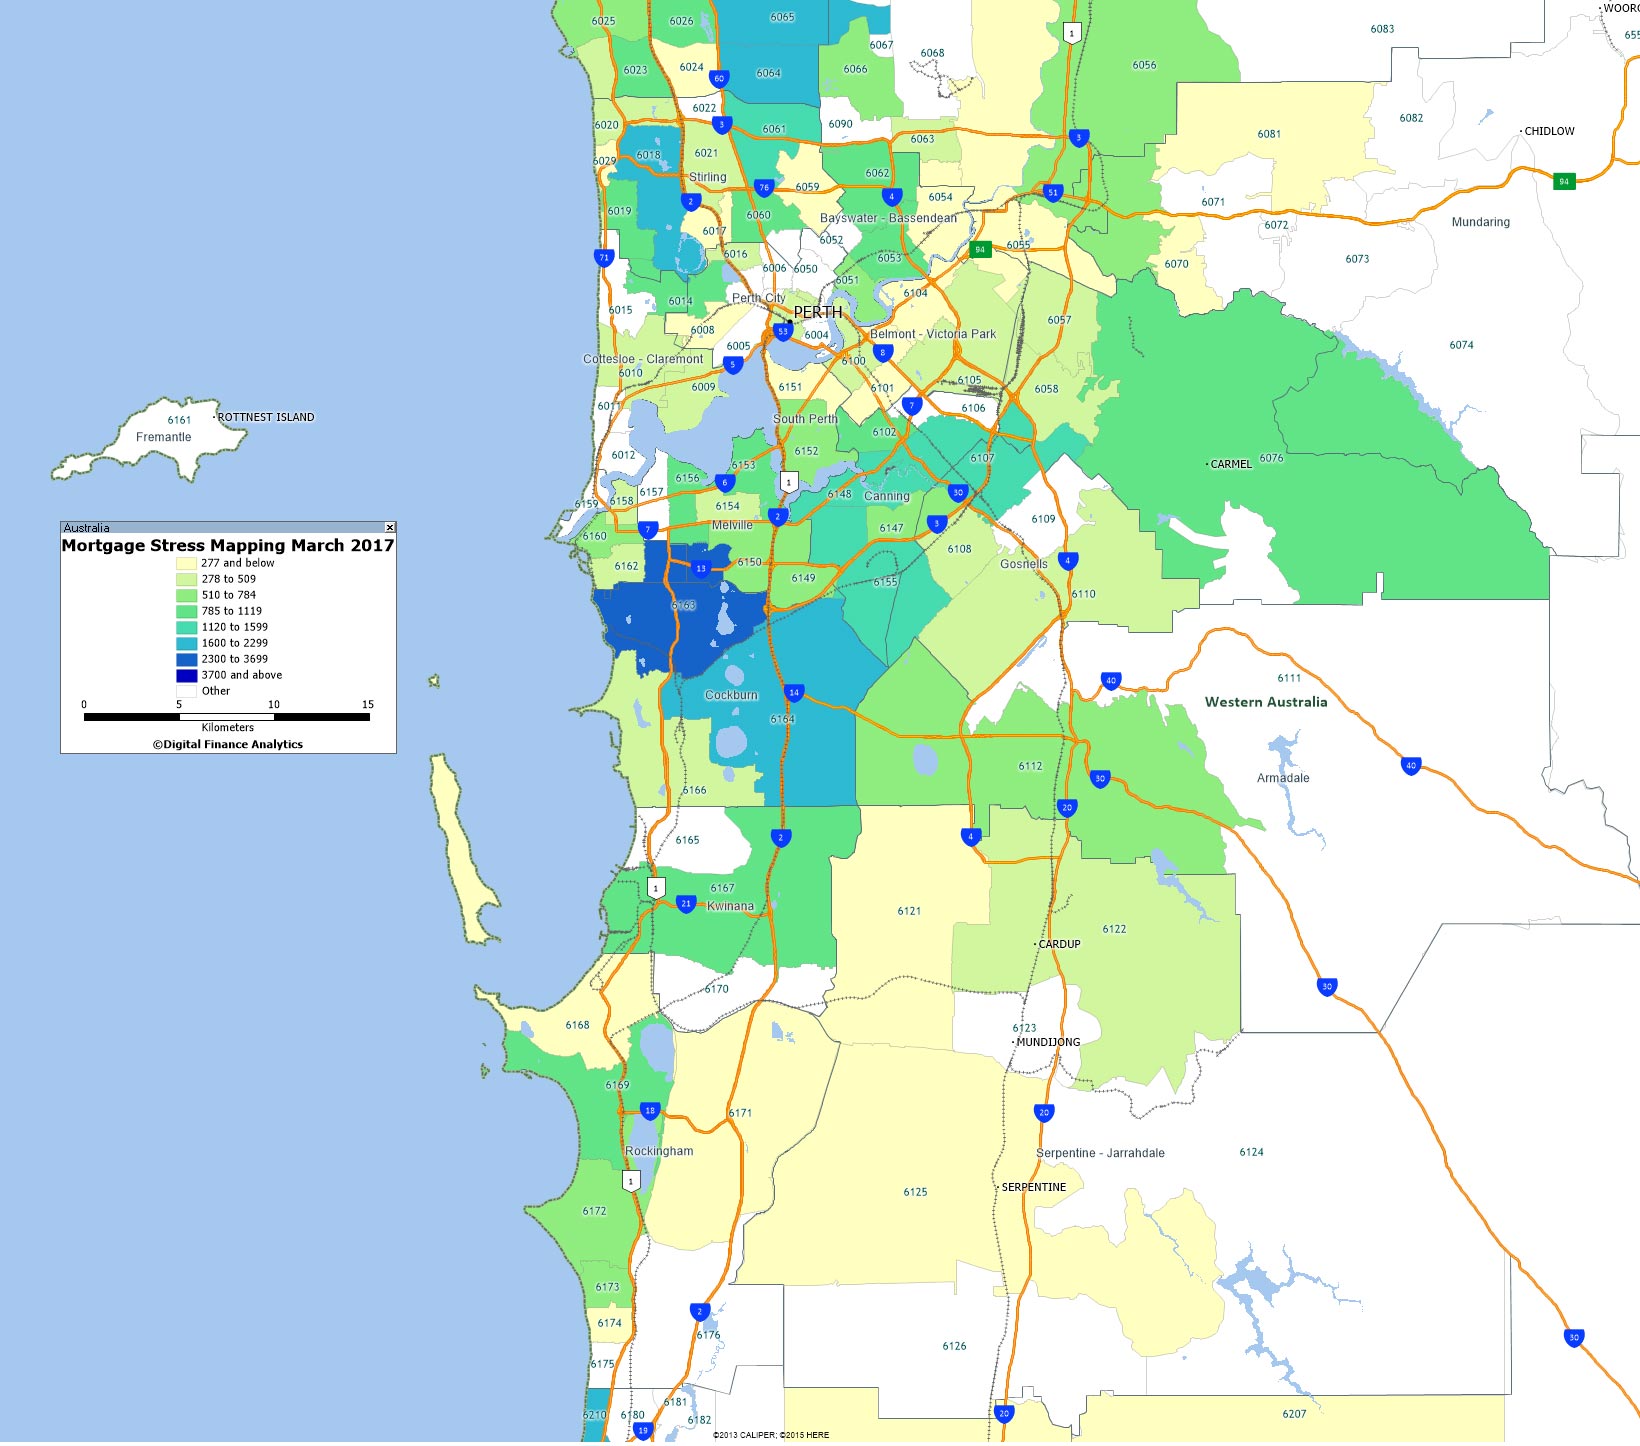
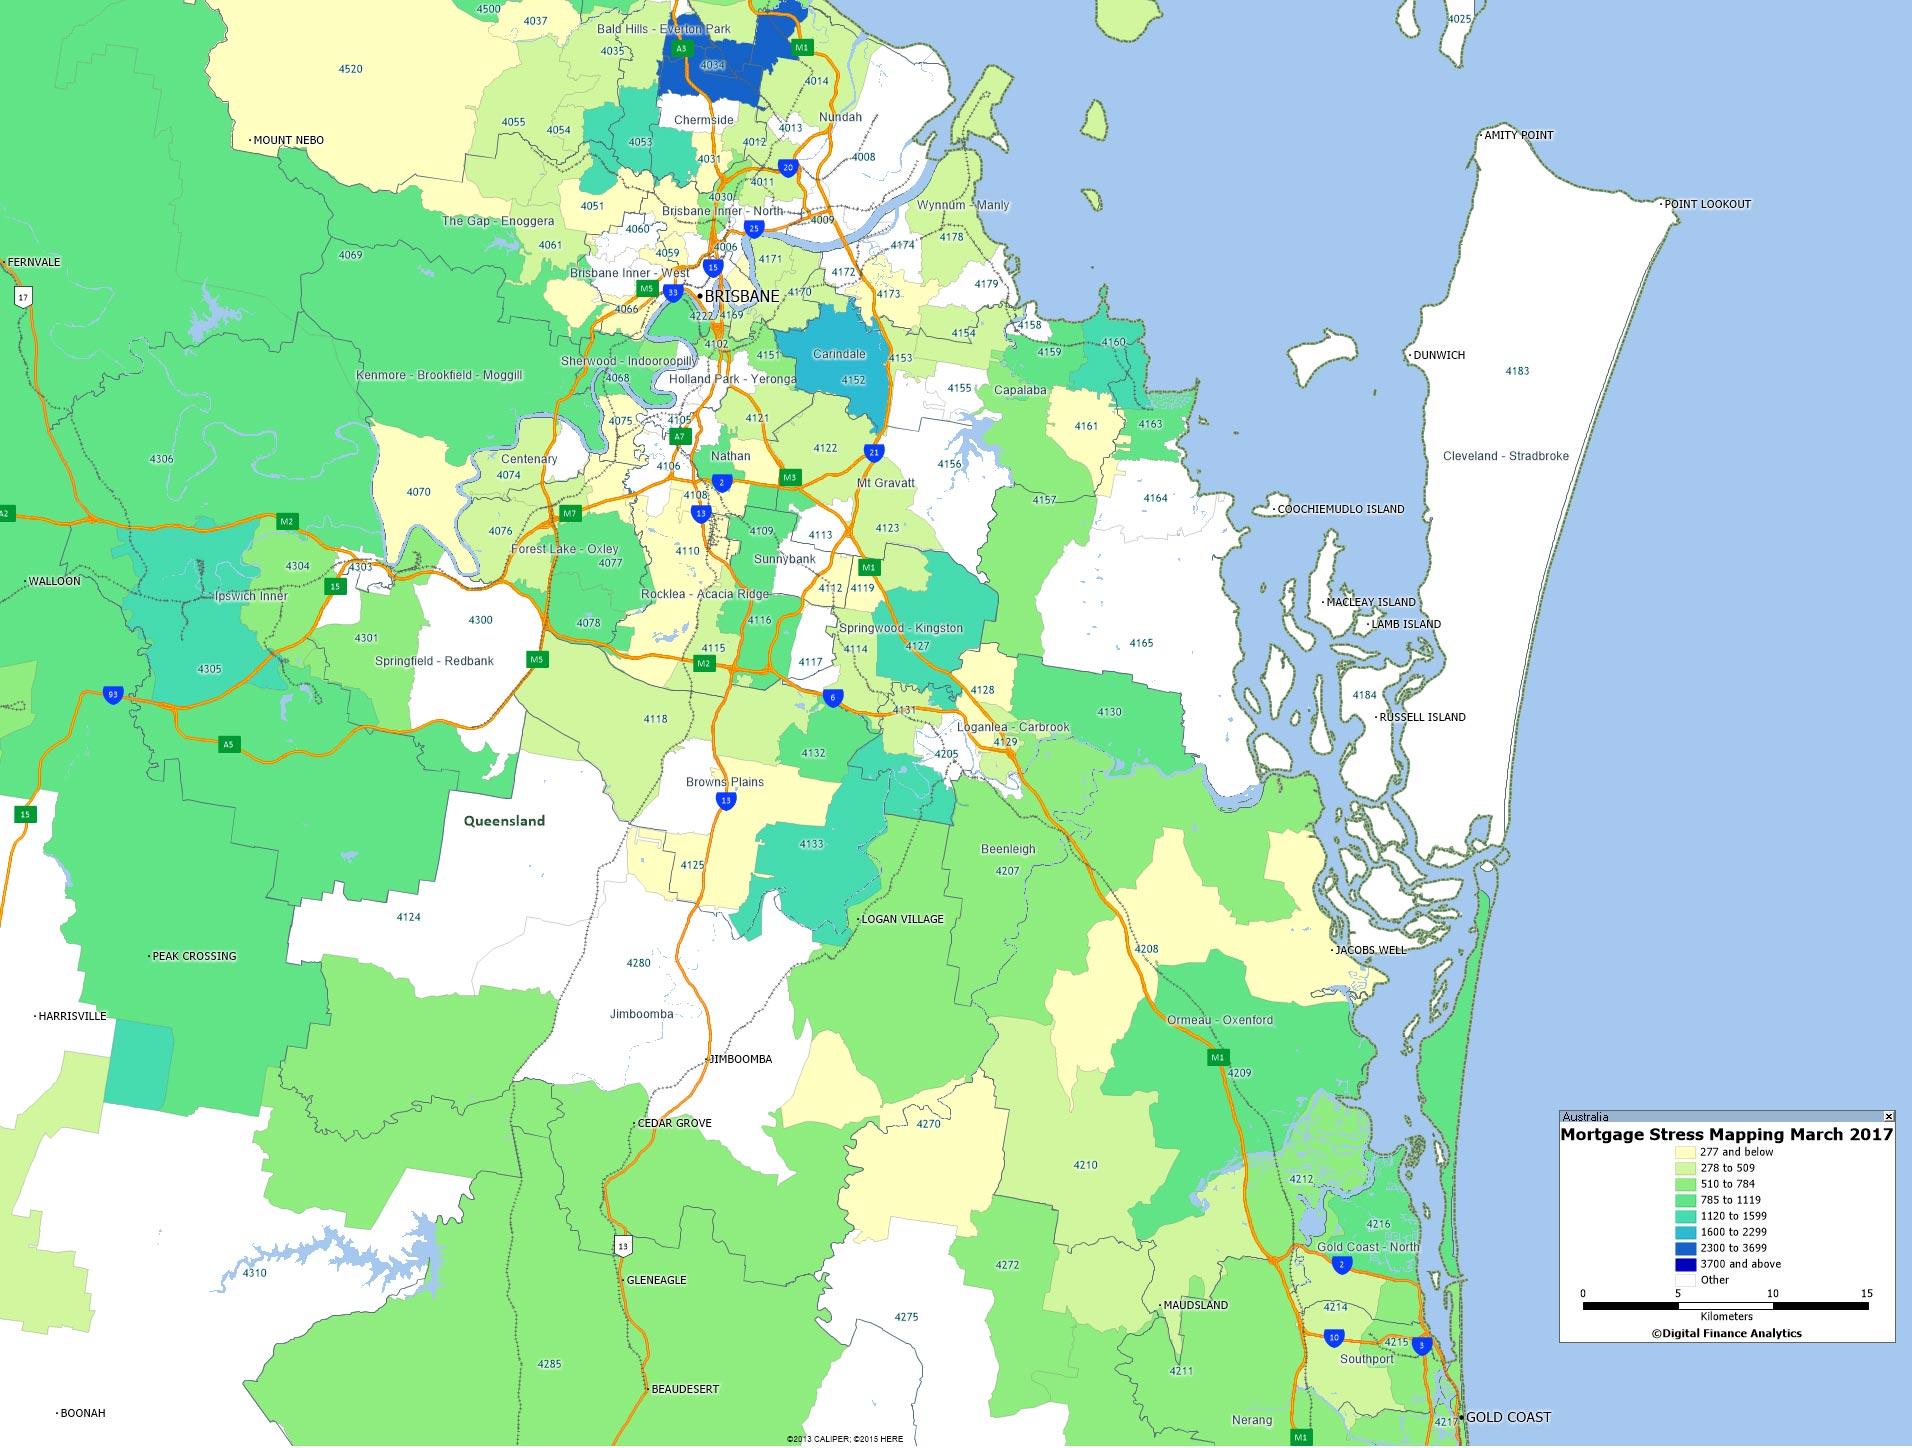
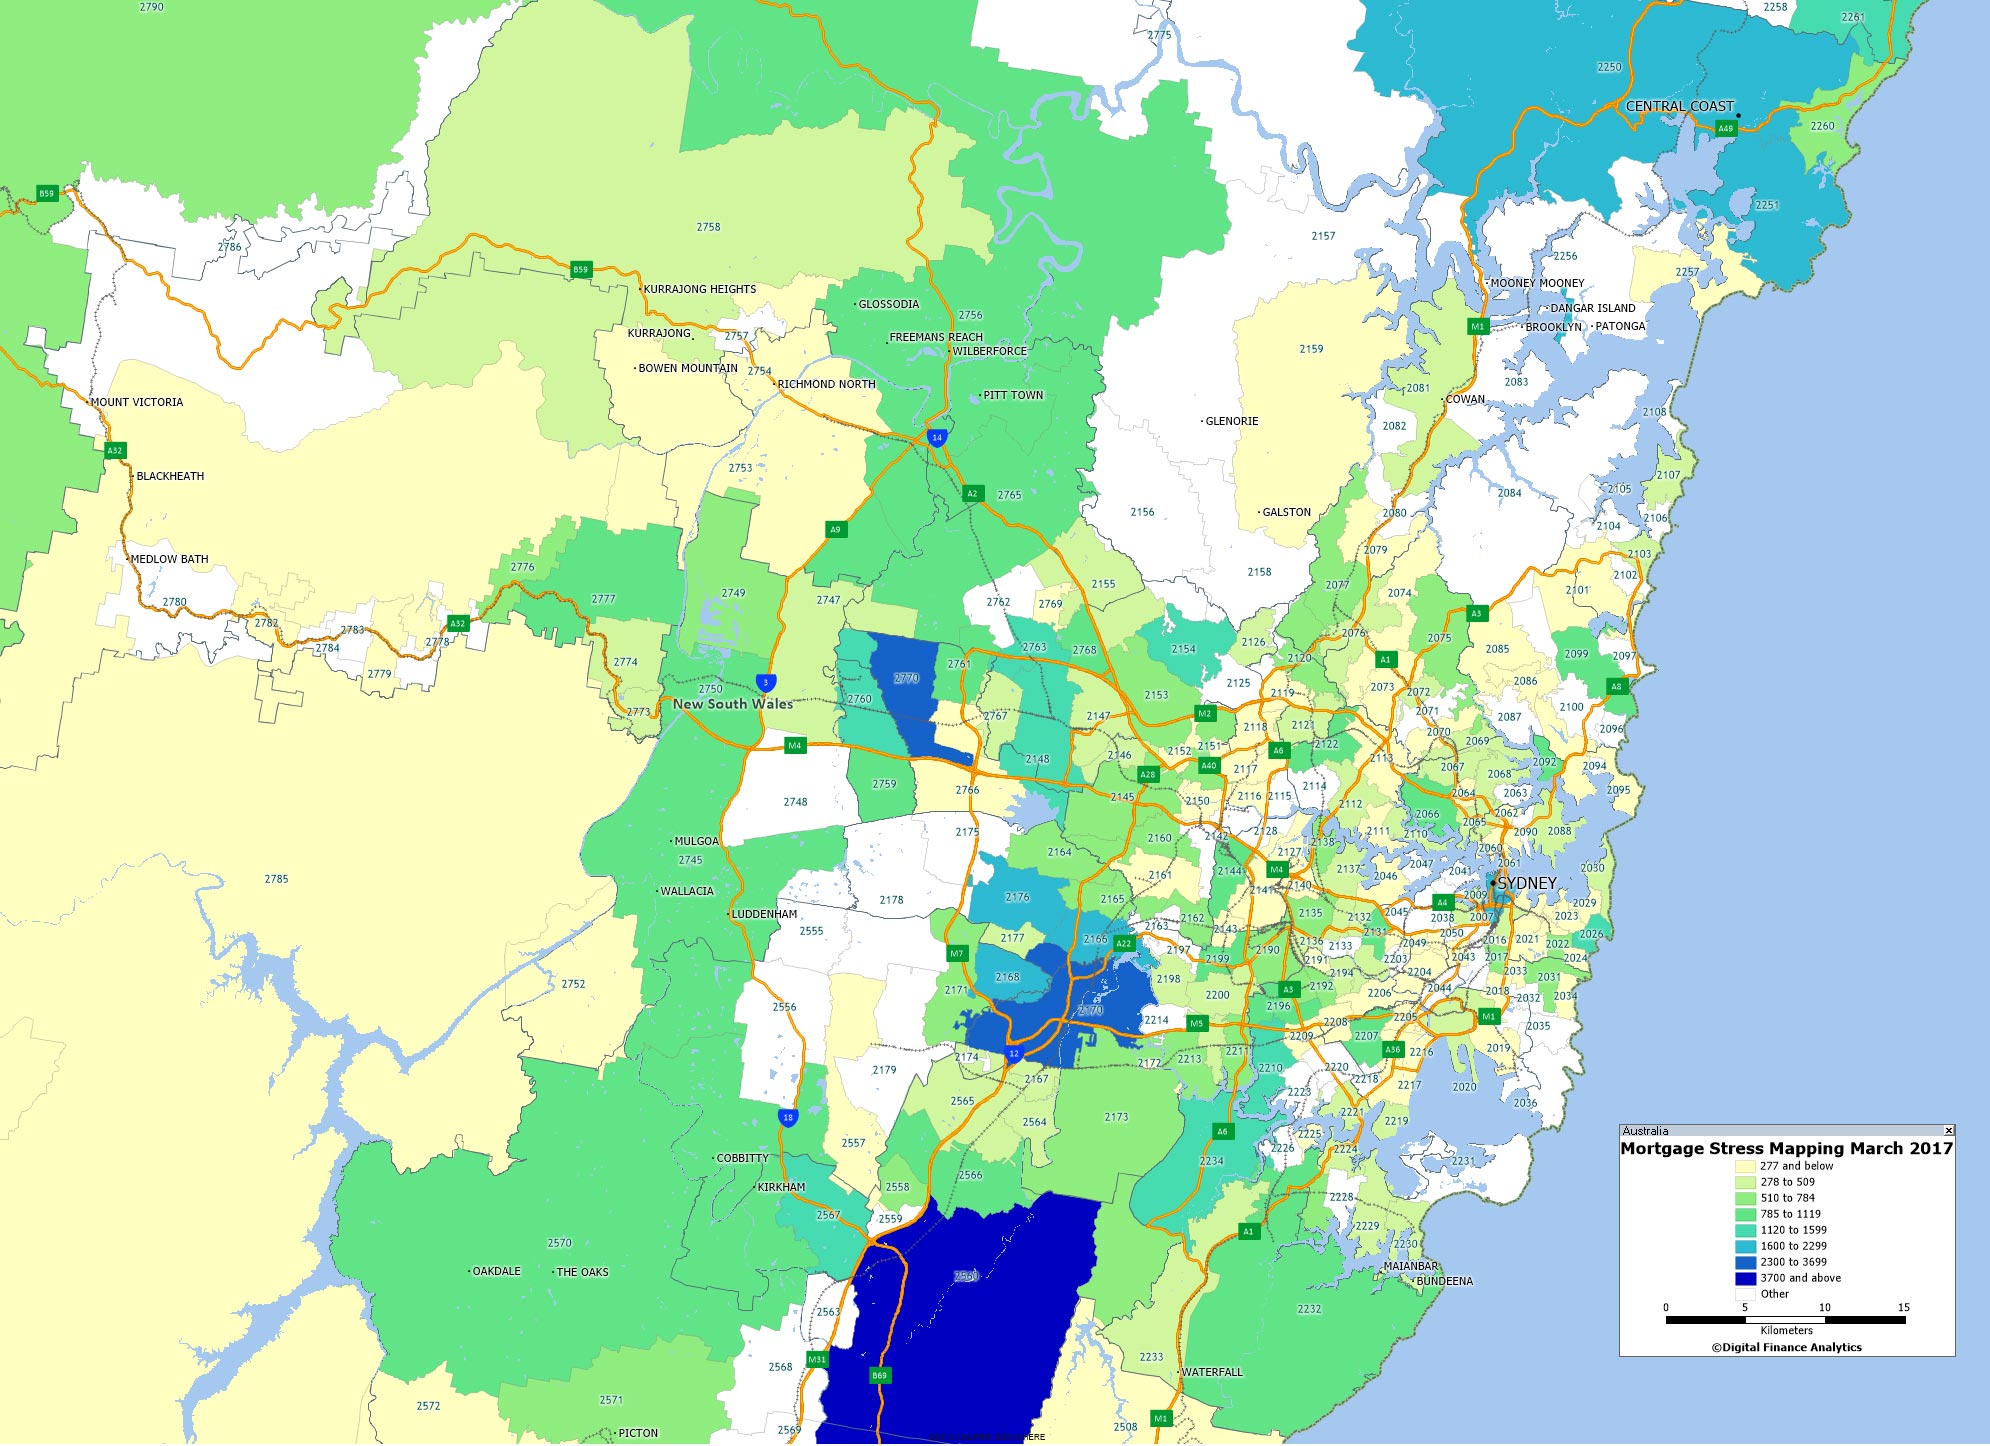
Here is a stress geo-map for the areas around Greater Melbourne. The Blue areas shows the highest stress counts.
Harristown 4350 leads the list with more than 4,000 households caught. Harriston is about 109 kms from Brisbane near Toowoomba. Around and 28% have a mortgage. The average age is 37 years old.
Next is Manunda 4870, a suburb of Cairns, and about 1391 kms from Brisbane. The average age of the people in Manunda is 38 years of age and 21% of households have a mortgage.
Third is Geebung 4034, a suburb of Brisbane about 11 kms from the CBD. The average age of the people in Geebung is 37 years of age and 38% of households have a mortgage.
Here is the mortgage stress geo-map for the area around Brisbane. The blue areas show those post codes with higher number of stressed households.
In our latest video blog we walk though some of the most important numbers in the mortgage and property market, including the latest findings from our household surveys.
Some of the questions we answer are:
How big is the mortgage market?
How many borrowing households are there?
What is the average mortgage size?
How many households are excluded from the market?
What will happen if mortgage rates rise by 3%?
Where is mortgage stress worst?
How does the Bank of Mum and Dad in Australia compare with the UK?
Following on from yesterday’s post, where we listed the post codes with the largest number of currently mortgage stressed households, we will now go into more detail across the main states. We commence this journey of pain by looking at NSW, where of course home prices have risen strongly, mortgages are large, and incomes static. Not a good recipe in a rising interest rate environment.
First we list out the top 20 post codes in stress across the state (by number of households in stress). The top three are Leumeah (2560), Chipping Norton (2170) and Bidwell (2770), all in the Sydney region. Next is South Tamworth (2340) and then Macmasters Beach on the Central Coast (2251).
Next, here is a geo-map of the Greater Sydney region with the counts of households shown. The blue areas are those with the highest counts.
We should make the point that mortgage stress measurement is getting at the current state of household finances, and is an indication the relative pressure on household budgets among households with owner occupied mortgages in the low wage growth economy. These in severe stress are nearer the edge in terms of mortgage repayments, but of course, given the significant capital growth in the region, most households will have sufficient equity to sell and repay the mortgage if need be. Thus, when we overlay our economic projections to derive a measure of default probability by end 2017, this is an indication of households missing a mortgage repayment (30-day default), not bank losses, which in our modelling remain extremely low.
The mortgage books in this region are bolstered by rising equity, Lenders Mortgage Insurance on higher LVR loans, many households paying ahead (though not those in stress) and current low interest rates. However, the scenario might change were rates to rise, home prices to slide and unemployment or underemployment were to rise.
Exclusive analysis performed for AFR Weekend has revealed that more than a million Australian home owners will struggle with mortgage stress if interest rates were to rise just three percentage points.
Data from research house Digital Finance Analytics shows that close to one in three households from Victoria, Tasmania and Western Australia will experience mortgage stress ranging from mild to severe in the event of just three rises of 25 basis points. A rise of 300 basis points, back to more normal levels, would be much more severe.
Runaway house prices in Melbourne and Sydney have added to the risks facing the economy as rising levels of household debt make home owners and property speculators vulnerable to unexpected moves in interest rates.
The Reserve Bank of Australia’s official cash rate, on which mortgage rates are based, is as an “emergency low” 1.5 per cent. In practice that means mortgage repayment rates are between about 4 per cent and 5 per cent of the loan amount per year.
Digital Financial Analytics principal Martin North says that a shake out in the property market would not be restricted to lower income areas and would include households in the trophy suburbs of Bondi and Lane Cove in Sydney as well as homes in the leafy green streets of Toorak and Prahran in Melbourne.
“The common theme here is affluent households paying top dollar for apartments with big mortgages and the potential to be caught out by rising interest rates and flat or falling incomes. Even places like the lower north shore are being hit” he said.
Under the modelling performed by Digital Finance Analytics, there are around 650,000 households in Australia experiencing some form of mortgage stress. The numbers are consistent with a Roy Morgan report from September 2016 that showed one in five households were experiencing mortgage stress.
The longstanding measure for mortgage stress has been 30 per cent of household income.
Mild mortgage stress might see household cut back on childcare expenses, dipping into savings or reaching for the credit card in order to make payments. Severe mortgage stress indicates that the mortgage holder has missed a payment or payments and is already considering selling the property.
If rates were to rise 150 basis points the number of Australians in mortgage stress would rise to approximately 930,000 and if rates rose 300 basis points the number would rise to 1.1 million – or more than a third of all mortgages. A 300 basis point rise would take the cash rate to 4.5 per cent, still lower than the 4.75 per cent for most of 2011.
Professor Roger Wilkins of the Melbourne Institute at the University of Melbourne produces the Household Income and Labour Dynamics Survey, regarded as one of the best sources of information about housing affordability in Australia.
He says that while mortgage stress hasn’t materially increased in recent years that a sharp rise in interest rates would be destructive to household finances everywhere.
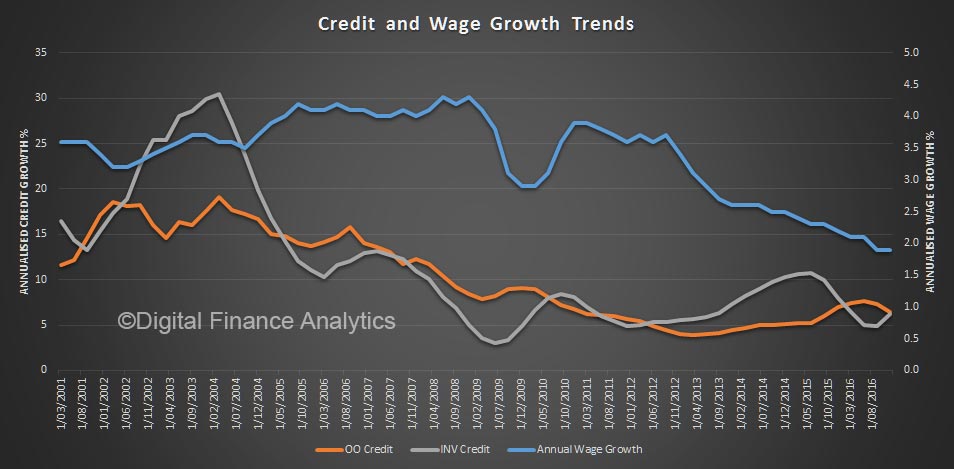
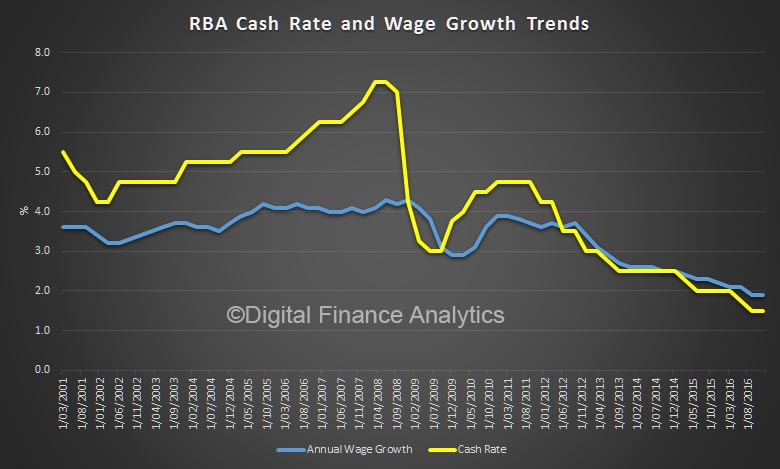
“If the cash rate goes to 6 per cent then you would expect to see a lot people in strife. Particularly with wage growth and inflation at such low levels so that does increase vulnerability to rises to interest rates” Mr Wilkins said.
We have just rerun our mortgage stress models, incorporating data to 1st March 2017. Household budgets remain under pressure, thanks to flat incomes and rising living costs – and some lifts in mortgage rates. You can read more about our approach to measuring mortgage stress here. Our current analysis concentrates on owner occupied mortgages.
Overall, 21.78% of households are in some degree of mortgage stress. We look at mild stress, meaning they are managing to meet repayments, but are doing so by cutting back on other expenditure, putting more on credit cards, and seeking to refinance or restructure to reduce monthly payments. 19.08% of households fall into this group. An additional 2.7% of households are in severe stress, meaning they are likely to miss repayments, or are in default, or are looking to sell. We look at household cash flow, not a set percentage of income going on the mortgage.
Here are the postcodes across Australia with the highest levels of stress.
Harristown, QLD 4350, which was the highest count in December 2016, still is first, followed by Leumeah NSW 2560. Leumeah is a suburb of Sydney, Macarthur/Camden, about 40 kms from the CBD. The average age of the people in Leumeah is 35 years of age. Around 37% of households there have a home loan mortgage.
Third is Frankston VIC 3199, which is a suburb of Melbourne, Bayside, It is about 39 kms from Melbourne. Frankston is in the federal electorate of Dunkley. The median/average age of the people in Frankston is 38 years of age. Around 30% of households here have a mortgage.
Fourth highest is Merriwa 6030, a suburb of South Western, Heartlands, WA. It is about 35 kms from Perth in the electorate of Pearce. 41% of homes here are mortgaged. The average age of the people in Merriwa is 35 years of age.
Once again, remember interest rates are very low, and are expected to rise, so the OECD warning about the risks in the housing sector seem well placed.
Editors Note. We updated this post to reflect the total of mild and stress, when it first appeared, we sorted only on mild stress, which changed the results slightly – and we also added back the latest probability of default metrics as well.
There was a subsequent flurry on Twitter discussing the DFA research approach.
To be clear, our household modelling is based on a rolling 26,000 statistically robust omnibus survey, to which each month we add 2,000 new households and drop off the oldest set. We have data from more than 10 years of research and it feeds our programme of activity and is reflected in the DFA blog.
From a mortgage stress perspective, we run our modelling, based on our household profiles and segments, which looks at net cash flow (before tax) and we also sensitive the modelling based on potential future rate movements. We take account of their total financial position, including other debt demands, and costs of living.
P.S. Our research is separate and distinct from other research in the housing affordability arena, including the international Demographia survey. Whilst some of the findings may align, the research is based on different underlying research sources.
Having looked at changes in investment loan supply, and the motivations of the rising number portfolio property investors, today we use updated data from our rolling household surveys to look at how property investors are positioned should mortgage rates rise. In fact, for many, rates have already been raised, thanks to lender repricing independent of any RBA cash rate move, some as much as 65 basis points. We think there is more to come, as loan supply gets tighter, international financial markets tighten and competitive dynamics allows for hikes to cover capital costs and to bolster margins.
To assess the sensitivity we model households ability to service mortgage debt, taking into account their other outgoings, and rental income. We are not here looking at default risk, but net cash flow. How high would rates rise before they were under pressure? Where they also have owner occupied loans, or other debts, we take this into account in our assessment.
The first chart is a summary of all borrowing investor households. The horizontal scale is the amount by rates may rise, and for each scenario we make an assessment of the proportion of households impacted, on a cumulative basis. So as rates rise, more households would feel pain.
The summary shows that nationally around a quarter of households would struggle with a rate hike of up to 0.5%, and as rate rose higher, this rises to 50% with a 3% rate rise, though 40% could cope with even a rise of 7%.
So a varied picture. But it gets really interesting if you segment the analysis. Those who follow DFA will know we are a great believer in segmentation to gain insight!
A state by state analysis shows that households in NSW are most exposed to a small rate rise, with 36% estimated to be under pressure from a 0.5% rise (explained by large mortgages and static rental yields), compared with 2% in TAS.
Origination channel makes a difference, with those who used a mortgage broker or advisor (third party) more exposed compared with those who when direct to a lender. The pattern is consistent across the rate rise bands. This could be explained by brokers knowing where to go to get the bigger loans, or the type of households going to brokers.
Households with interest only loans are 6% more exposed to a small rise, and this gap remains across our scenarios. No surprise, as interest only loans are more sensitive to rate movements. We have not here considered the tighter lending criteria now in play for interest only lending.
Our master segmentation reveals that it is Young Affluent and Young Growing Families who are most exposed, followed by Exclusive Professionals. Some of the more affluent are portfolio investors, so are more leveraged, despite larger incomes.
Finally, we can present the age band data, which shows that those aged 40-49 have the greatest exposure as rates rise, though young households are most sensitive to a small rise. Note this does not reveal the relative number of investor across the age groups, just their relative sensitivity.
This all suggests that lenders need to get granular to understand the risks in the portfolio. Households need to have a strategy to prepare for rate rises and should not be fixated on the capital appreciation, at the expense of cash flow management, especially in a rising rate environment.
Australia’s historically high and rising housing prices are widely debated and have prompted a number of government inquiries into housing affordability.
The question stands open: is housing affordable in Australia?
Affordability is often confused with related concepts such as ease of entry, serviceability and valuation. Ease of entry refers to the difficulty of purchase, whereas serviceability measures the burden of mortgage repayments relative to household income.
Valuation considers whether prices are efficient relative to economic fundamentals. Opinions are divided on this: housing prices could be 30% undervalued, a bubble which is 40% overvalued, or somewhere in between.
It is often claimed housing is affordable because nominal mortgage interest rates are low, having significantly declined since the peak of 17% in 1990. The standard mortgage payment formula shows nationwide debt repayments relative to household incomes are lower today than in 1990 and the smaller peak in 2008.
This metric is problematic because it is static, capturing the payments-to-income ratio at each particular point in time. The ratio at the peak in 1990, for instance, is very high if, and only if, prices, interest rates and incomes are constant over the life of the mortgage. This doesn’t reflect reality and a more dynamic approach is required.
First, the deposit-to-income ratio is the highest on record. Lenders may accept smaller deposits today but this is not a genuine choice for first home buyers. Starting out with larger loan repayments and lower equity is unlikely to be compensated for in a low interest rate and anaemic wage growth environment, especially with the added cost of lenders mortgage insurance.
Second, due to larger mortgages, repayments are higher than suggested by interest rates alone. Unfortunately, principal repayments are not officially recorded in our national accounts. The Bank of International Settlements has developed internationally standardised debt service ratios (DSR) to derive estimates of aggregate principal and interest repayments to income.
Household debt and prices escalated, interest rates declined and principal payments rose over the years. The gap has widened between interest payments to income and the DSR from around 1% between the late 1970s and early 1990s to a record 6% today.
By disregarding rising principal payments, vested interests downplay the immense debt burden assumed with a typical mortgage.
Worryingly, the bank states, “the DSR is a reliable early warning indicator for systemic banking crises. Furthermore, a high DSR has a strong negative impact on consumption and investment.” The DSR is currently 15% nationwide, far higher than the US, UK and Spain at the peaks of their housing bubbles. Estimates of the DSR for New South Wales and Victoria are 18%, which demonstrates extreme indebtedness.
Third, past research from the RBA recently surfaced in the media, examining the effects of wage inflation on mortgage payments. While high interest rates result in onerous payments relative to income, this only occurs in the early phase as high wage growth inflates away the burden. In contrast, borrowers facing high housing prices with low interest rates and poor wage growth face a greater burden across the life of the mortgage due to greater payments-to-income.
Everyone apart from the very wealthy has to purchase with a mortgage. Therefore, only by anchoring serviceability of payments-to-income can a genuine estimate of affordability be made. Generally, 30% of income is the accepted maximum.
High wage growth relative to interest rates and prices during the 1960s and 1970s made housing quite affordable. Higher prices and interest rates in the 1980s increased the burden. When interest rates peaked in 1990, payments were arduous but quickly declined.
While interest rates and wage growth for the next 25 years cannot be known, they are assumed to hold still at the present rates: 5.7% for the average imputed mortgage interest rate and 1.4% for wages. While the present interest rate may seem high, lower rates will inevitably prompt further housing price growth.
Buyers from, say, 2010 face onerous payments over the life of their mortgage compared to those who purchased in 1980 and 1990 when interest rates were much higher. The average ratio across the lifetime of the mortgage for all purchases dates are 1960 (10%), 1970 (10%), 1980 (18%), 1990 (27%), 2000 (23%) and 2010 (37%).
Although not shown, affordability is even worse in 2016 due to rising prices, with an estimated average payment ratio of 42%. The payment burden for 2010 and 2016 is still extreme and higher than 1990, even when factoring in lower estimated interest rates (4%) and higher wage growth (2%).
The measures presented above are absent from mainstream analysis today precisely because they demonstrate severe unaffordability, confirmed by the highest deposit-to-income ratios, the highest debt repayments relative to income over the lifetime of the mortgage and very high DSRs. Over 50% of first home buyers today are reliant on parental assistance.
There are three ways to assist affordability: declining interest rates, rising wage growth and falling housing prices. Aspiring first home buyers are severely disadvantaged; nominal wage growth is currently at the lowest level since the second world war and there is little room for interest rates to go lower. The only path to improved affordability is by reducing housing prices.
This is obviously opposed by political parties, the finance, insurance and real estate sector and economists employed by vested interests. Instead, we are bombarded with a disgraceful litany of pronouncements, fabricated to defend record high housing prices and unaffordability.
Young adults are condemned as lazy and inept, allegedly misspending their income on alcohol or stuffing themselves with smashed avocado toast in hipster cafes. To protect unjustified privilege – unearned rises in housing prices – vested interests have twisted a very real affordability crisis into moral failing by the young. They are told to get onto the housing ladder by purchasing an investment property or to “get a good job”.
The appalling government report recently published on home ownership (at which I testified) was a miserable 45 pages short and made no recommendations. The government made no pretense of objectivity; dissenting reports by the ALP and Greens were more informative.
The evidence shows housing prices and unaffordability are at record highs. This appalling state of affairs is maintained by an undemocratic politburo of vested interests accustomed to extracting a staggering proportion of unearned income and wealth. Manufacturing claims of youthful indolence is merely another day at the office.
Will anything be done to lower housing prices? On the contrary, the politburo endlessly champions higher prices by seeking further interest rate cuts, increasing our already third-world rates of population growth via immigration and could implement another inflationary first home owners boost on the pretext of assisting first home buyers – which enriches existing landholders and bankers.
The state of policymaking and economic management in Australia is extremely poor and entirely intentional. If the young are to learn an important lesson, it is this: no matter how hard things are, vested interests are committed to making their lives ever more difficult.