New Zealand based Property Expert Joe Wilkes and I discuss the latest on mortgage repayment holidays, and it sets up our live stream event next Tuesday 25 August where Joe will join me to take the discussion further.
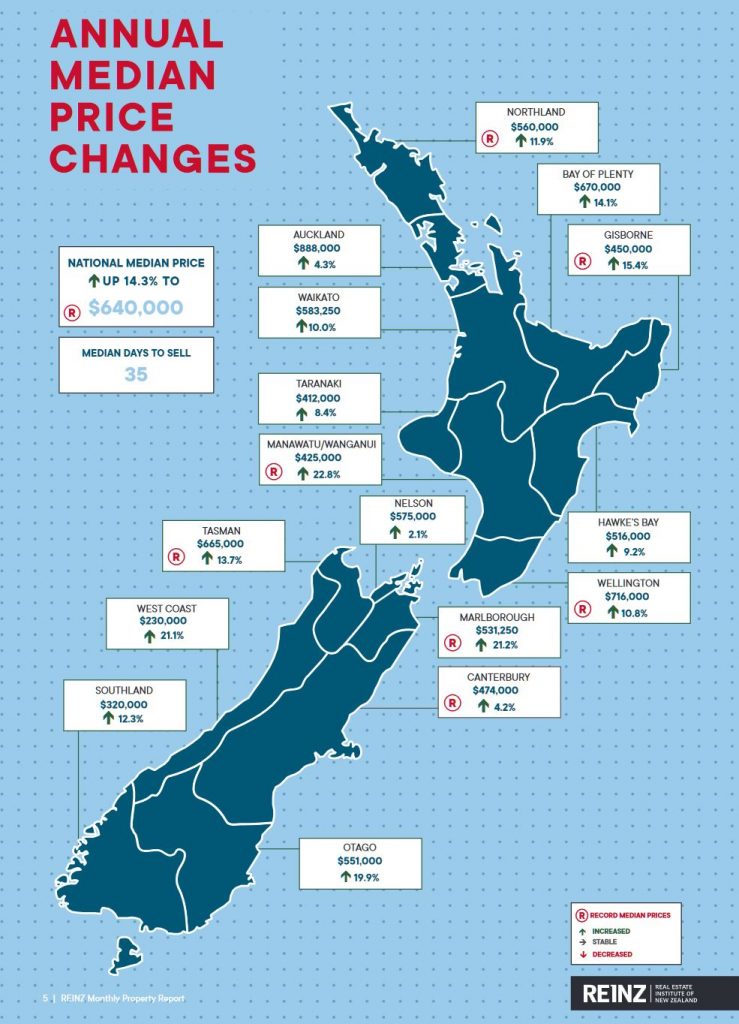
Median house prices across New Zealand increased by 14.3% in February to a new record median price of $640,000, up from $560,000 in February 2019. This was the largest percentage increase in 53 months according to the latest data from the Real Estate Institute of New Zealand (REINZ).
The number of properties sold in February across New Zealand increased by 9.2% from the same time last year (from 6,132 to 6,694) making it the highest number of properties sold in the month of February in 4 years.
For New Zealand excluding Auckland, the
number of properties sold decreased by a marginal -0.3% when compared to the
same time last year (from 4,742 to 4,726) – 16 fewer properties.
In Auckland, the number of properties sold in February increased by 41.6% year-on-year (from 1,390 to 1,968) – the highest number of residential properties sold in the month of February in 5 years.
The REINZ House Price Index for New
Zealand, which measures the changing value of property in the market, increased
8.7% year-on-year to 3,013 – a new record high.
The HPI for New Zealand excluding Auckland
increased 10.2% from February 2019 to 2,995 another new record high.
The Auckland HPI increased by 6.9%
year-on-year to 3,035 – the highest annual percentage increase in 35 months and
the first time the Auckland region crossed the 3,000 mark.
In February the median number of days to sell a property nationally decreased by 12 days from 47 to 35 when compared to February 2019 – the lowest days to sell for the month of February in 13 years.
The total number of properties available for sale nationally decreased by -22.3% in February to 20,875 down from 26,850 in February 2019 – a decrease of 5,975 properties compared to 12 months ago and the lowest level of inventory for the month of February ever. However, this was an uplift on January’s figure of 19,488.
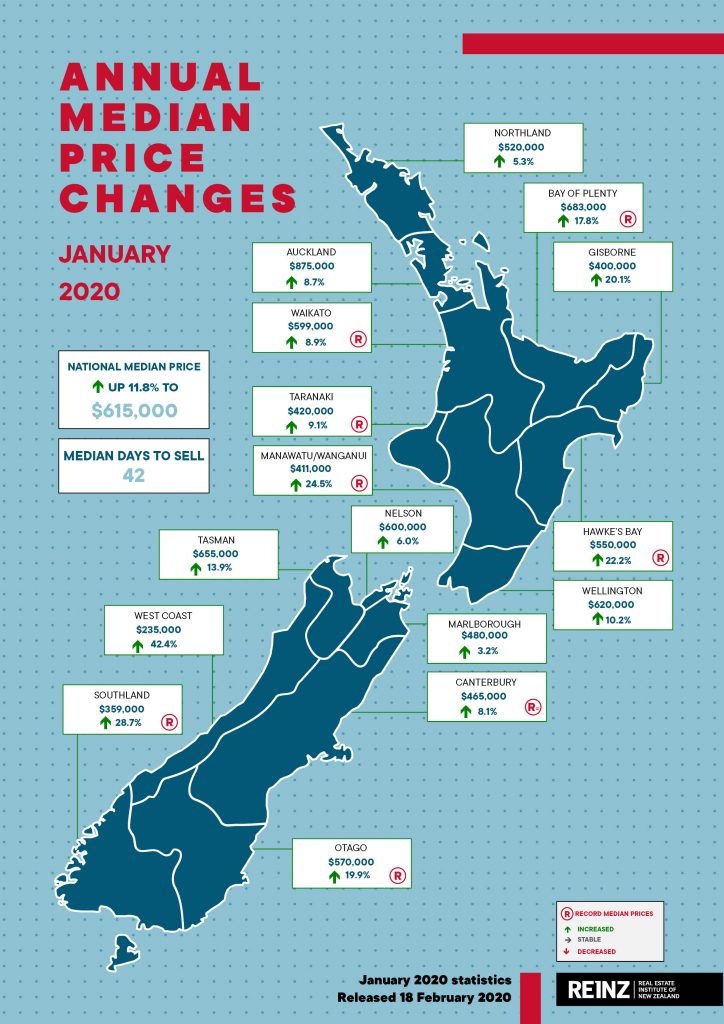
REINZ has released their January 2020 residential report today, and they reported the busiest January in 4 years. The annual average rise across New Zealand was 7%, with Auckland at 4.4% and other areas up 9.1%. Auckland is actually now among the faster-rising regions. Prices in Canterbury are rising, although to date this has been slower than many other regions.
In January the median number of days to sell a property nationally decreased by 6 days from 48 to 42 when compared to January 2019 – the lowest days to sell for the month of January in 3 years.
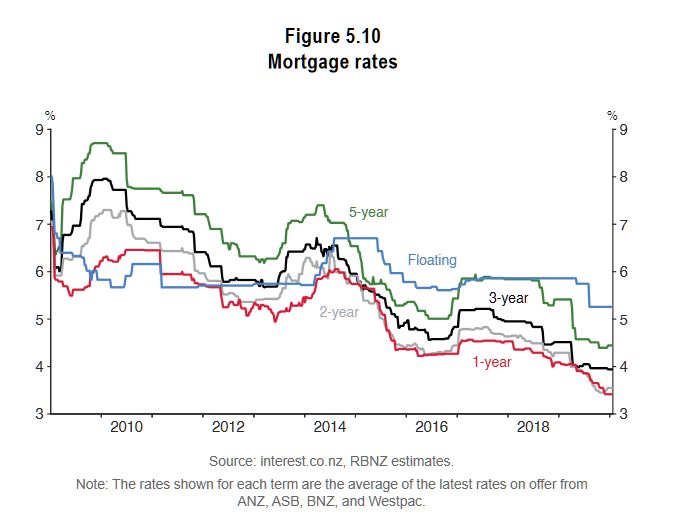
Low interest rates and lighter regulation are driving the market. Over 2019, the RBNZ cut the OCR from 1.75 percent to 1 percent and they indicate that the OCR will remain at 1 percent for some time. In response, household debt continues to rise. Lower debt servicing costs enables higher household spending on consumption, although returns from savings will be lower as well.
Over the past year New Zealand construction activity has ramped up substantially while net migration has steadily declined. The cancellation of earlier plans to introduce a capital gains tax has also helped to drive the market.
For New Zealand excluding Auckland, the number of properties sold increased by 0.9% when compared to the same time last year (from 3,279 to 3,308) – also the highest for the month of January in 4 years.
In Auckland, the number of properties sold in January increased by 9.7% year-on-year (from 1,180 to 1,295) – the highest number of residential properties sold in the month of January since January 2016.
Sales in Auckland were the highest for the month of January in four years, with particularly strong uplifts in sales volumes in North Shore City (+29.0%), Waitakere City (+28.6%) and Rodney District (+21.1%).
Regions outside Auckland with the highest percentage increase in annual sales volumes during January were: • Nelson: +42.6% (from 54 to 77 – 23 more houses) • Manawatu/Wanganui: +15.3% (from 281 to 324 – 43 more houses) – the highest for the month of January in 3 years • Bay of Plenty: +11.5% (from 340 to 379 – 39 more houses) – the highest for the month of January in 4 years • Marlborough: +11.3% (from 62 to 69 – 7 more houses). Regions with the largest decrease in annual sales volumes during January were: • Tasman: -29.3% (from 58 to 41 – 17 fewer houses) – the lowest since January 2017 • Southland: -27.2% (from 151 to 110 – 41 fewer houses) – the lowest for the month of January in 6 years • Otago: -17.1% (from 269 to 223 – 46 fewer houses) – the lowest for the month of January in 9 years.
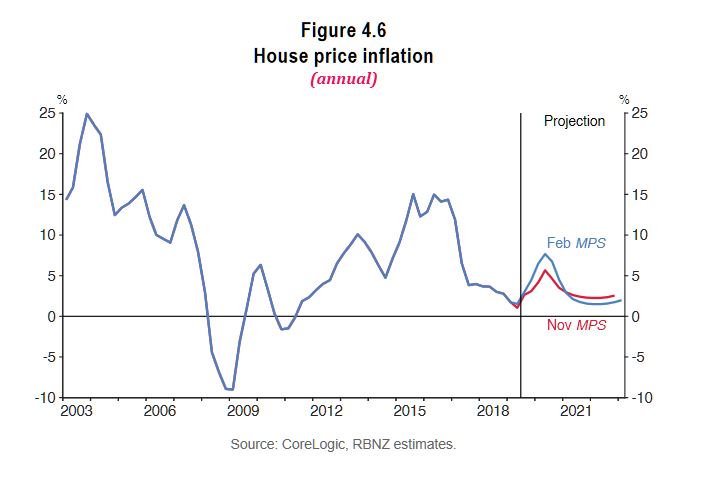
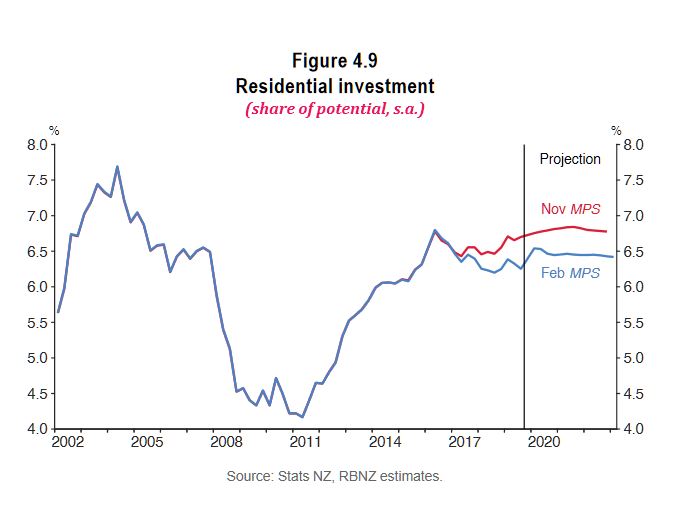
In the recent Reserve Bank NZ Monetary Policy Statement, they indicated that over the medium term, annual house price inflation is expected to slow as net immigration moderates, residential construction activity remains high, and the effects of past lower mortgage rates fade.
However, they expect residential investment growth is expected to pick up over the next six months, in line with recent high levels of residential building consent issuance. That said, residential investment is forecast to decline very gradually as a share of GDP later in the projection period, reflecting ongoing capacity constraints in the construction sector.
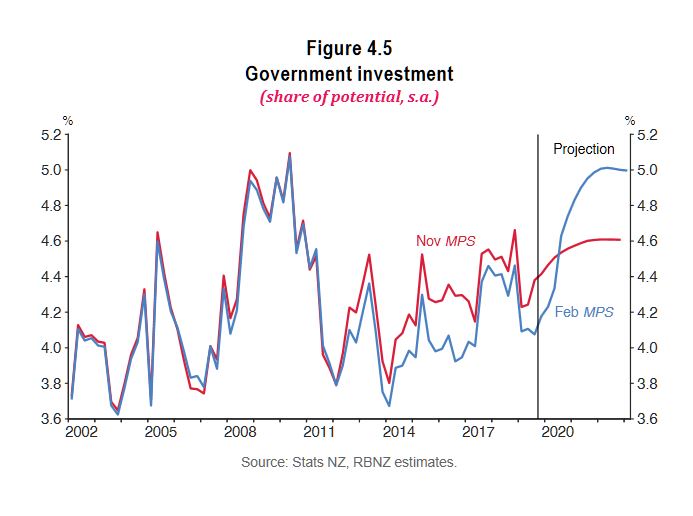
In December 2019, the Government announced a substantial investment package of $12bn, equivalent to around 4 percent of annual nominal GDP. The Treasury forecasts that $8.1bn will be spent between June 2020 and June 2024, mainly on infrastructure projects
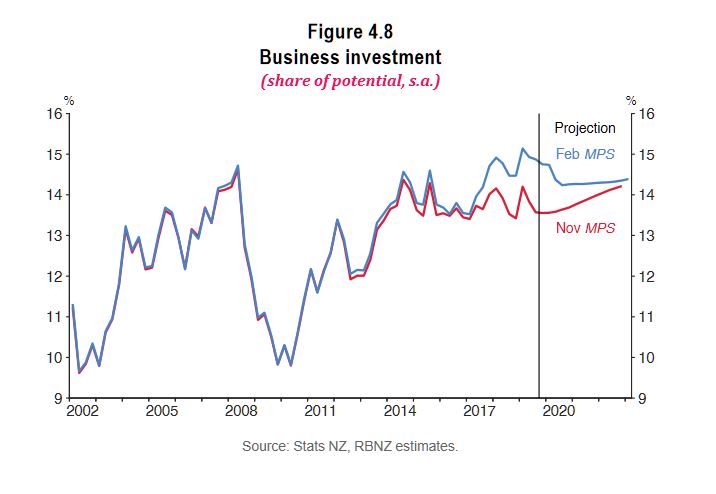
Which is probably just as well, given that business investment is forecast to fall ahead.

 Blog")