RBA Rose Tinted Specs On The Blink

The RBA minutes for October are decidedly bearish, clearly the battery in their rose-tinted specs as run down, revealing the mounting risks in the economy. Probably more risks ahead, more cuts and the proverbial QE in some form…

International Economic Conditions

Members commenced their discussion of global economic conditions by noting that heightened policy uncertainty was affecting international trade and business investment. This had continued to be apparent in a range of indicators, including new export orders and investment intentions. Conditions in the manufacturing sector had remained subdued, partly because of ongoing US–China trade tensions. These tensions had led to a contraction in bilateral trade between the United States and China, which was resulting in the diversion of some activity to other economies. Members noted that the trade and technology disputes continued to pose significant downside risks to the global economic outlook.

In general, conditions in the services sector had been relatively resilient in most advanced economies, supported by strong labour market conditions. Employment growth had continued to outpace growth in working-age populations, unemployment rates had remained at low levels and wages growth had risen. Nevertheless, inflation had remained low, although core inflation had picked up in the United States in recent months.

In the United States, GDP growth appeared to have slowed a little further in the September quarter. Growth in core capital goods orders and investment intentions had declined, whereas growth in consumption had remained robust. In the euro area, the weakness in output growth in the June quarter had been broadly based. Industrial production had fallen, particularly in Germany, and investment intentions had remained below average. In Japan, exports had declined further, although output growth in the September quarter had been supported by above-average household spending ahead of an increase in the consumption tax in October.

In east Asia, export volumes had been flat for several months. Other indicators of activity, such as industrial production and surveys of manufacturing conditions, had shown tentative signs of stabilising. Growth in output had also slowed in India, driven by weakness in consumption. Members noted that the political unrest in Hong Kong had affected economic activity there to a significant extent.

In China, a range of indicators suggested that the pace of economic activity had slowed since the start of the year. Economic indicators remained subdued in August, although they had recovered a little from broad-based weakness in July. Growth in industrial production and retail sales had edged higher in August, and fixed asset investment growth had been broadly unchanged. Conditions in housing markets also appeared to have softened. In response to the slowing in activity, the authorities had announced further measures to ease policy in September. Chinese demand for imported iron ore and coal had increased, supported by ongoing investment in infrastructure.

The iron ore benchmark price had continued to be volatile since the previous meeting. Members noted that supply concerns in the iron ore market had eased somewhat, and ongoing strength in Chinese steel demand had been met by an increase in iron ore imports. Oil prices had also been volatile, with the attacks on oil infrastructure in Saudi Arabia having disrupted oil supply and exacerbated uncertainty in the region.

Domestic Economic Conditions

Members noted that the main domestic economic news over the previous month had been the release of the national accounts data for the June quarter and updates on the labour and housing markets. On balance, the data had pointed to a continuation of recent trends.

The national accounts reported that the Australian economy had grown by 0.5 per cent in the June quarter. Year-ended growth had slowed to 1.4 per cent, the lowest outcome in a decade. Nevertheless, there had been a pick-up in quarterly GDP growth over the first half of 2019 compared with the second half of 2018. The pick-up had been driven by stronger growth in exports, led by exports of resources and manufacturing goods. Members noted that export demand was being supported by the lower level of the Australian dollar. Public demand had also been growing strongly, partly because of spending on the National Disability Insurance Scheme. Members observed that the drought had continued to affect the rural sector to a significant extent and that, as a result, farm output was expected to remain weak over the following year.

Growth in household disposable income had been subdued. Strong growth in income tax paid by households had been a contributing factor, as had been low growth in non-labour income, partly reflecting the effects of the drought on the farm sector. By contrast, strong employment growth had boosted growth in labour income.

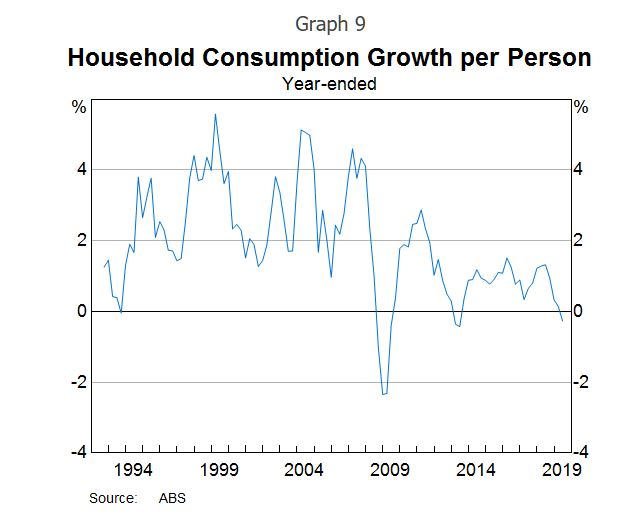
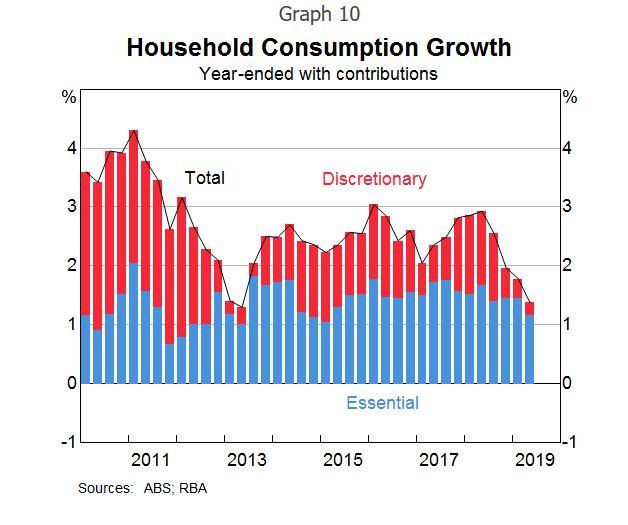
Consistent with the ongoing low growth in household disposable income, household consumption had increased by only 1.4 per cent over the year to the end of June. Members noted that there had not yet been evidence of a pick-up in household spending following the recent reductions in the cash rate and receipt of the tax offset payments, although they acknowledged that it may be too early to expect any signs of a pick-up. Retail sales had remained subdued in July and car sales had decreased in August. Despite weak reported retail sales conditions generally, on a slightly more positive note some contacts in the Bank’s liaison program had reported a mild pick-up in retail sales since July. Responses to consumer surveys in September had suggested that, on average, households planned to spend around half of their lump-sum tax payments, broadly in line with what had been assumed in the Bank’s most recent forecasts.

The residential construction sector had contracted further and this was expected to continue for some time. The decline in dwelling investment in the June quarter was greater than had been expected a few months earlier. Higher-density approvals had declined in July, to be at their lowest level in seven years; detached approvals had also declined in July. The Bank’s liaison program had continued to report weak pre-sales for higher-density developments. Taken together, this information implied that dwelling investment would decline further over coming quarters.

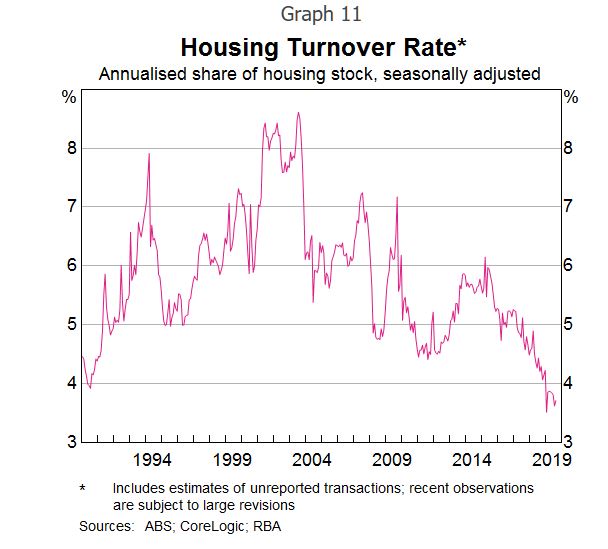
The turnaround in the established housing market had continued in September. Housing prices had increased further in Sydney and Melbourne, and auction clearance rates had remained high in both cities. The pace of growth in housing prices had also picked up in some other capital cities in recent months. However, housing turnover had remained low.

Business investment had decreased a little in the June quarter, driven by a decline in non-residential construction outside the mining sector. Nevertheless, the outlook for non-mining business investment remained favourable, supported by investment in infrastructure. Mining investment had picked up largely as expected. Members noted that mining investment was expected to continue to increase gradually, supported by projects both to sustain and to expand production. Survey measures of business conditions had remained around average in August; members noted that conditions in retailing were reported to have been very weak, while conditions in the mining industry had remained well above average.

Conditions in the labour market had continued to be mixed. Employment growth in August had remained stronger than growth in the working-age population, and the employment-to-population ratio had reached its highest level since late 2008. Employment had increased by 2½ per cent over the preceding year, the third successive year of strong employment growth. The participation rate had also increased to another record high. Members noted that the strong demand for labour had been met by an equally strong increase in supply. The unemployment rate had been around 5¼ per cent since April and the underemployment rate had remained above its recent low point. Looking ahead, job vacancies and advertisements had declined, suggesting that employment growth would probably moderate over the subsequent few quarters. Members noted that the ongoing subdued growth in wages implied that there continued to be spare capacity in the labour market.

Financial Markets

Members noted that financial conditions remained accommodative internationally and in Australia. Several major central banks had eased policy in September and market pricing implied that market participants expected the global economic expansion to be sustained by an extended period of policy stimulus. Expectations of further monetary easing had been partially scaled back in response to tentative signs of progress in the trade and technology negotiations between the United States and China and some better-than-expected US economic data. These developments had also supported the prices of equities and corporate bonds.

As expected, the US Federal Reserve had reduced its policy rate again by 25 basis points in September. The Federal Reserve had noted that, although the US economy had remained strong, easier policy was warranted given muted domestic inflation pressures, a weakening in global activity and persistent downside risks. Members of the Federal Open Market Committee did not anticipate a prolonged easing cycle, but continued to signal that they were willing to ease policy further if needed to sustain growth and meet the Federal Reserve’s inflation objective. Market pricing suggested that the federal funds rate was expected to decline by a further 50 basis points or so by mid 2020, which was a little less than had previously been anticipated.

The European Central Bank (ECB) had delivered a package of stimulus measures in response to inflation being persistently below the ECB’s target, protracted weakness in economic growth and continued downside risks. The package included cutting the ECB’s policy rate by 10 basis points to –0.5 per cent, exempting a portion of banks’ excess reserves from negative deposit rates, committing to not lifting rates until inflation returned sustainably to target, renewing purchases of government and private sector securities, and easing the conditions of the targeted long-term refinancing operations designed to encourage banks to lend to the private sector.

The People’s Bank of China had provided additional but targeted monetary stimulus, further cutting its reserve requirements, with larger adjustments for some smaller banks that are important providers of finance to small businesses. Chinese banks had also lowered the benchmark lending rate for corporate borrowers slightly.

Government bond yields in major markets had risen a little, with yields in Australia following suit. Nonetheless, bond yields remained very low, with a large portion of bonds in Europe and Japan trading at negative yields. Members noted that a sizeable proportion of the investors holding these negative-yielding bonds were constrained by their mandates or regulatory requirements, including asset managers, banks, insurance companies and pension funds.

Members noted that financing conditions for corporations remained favourable globally. Equity prices had remained close to recent peaks, spreads on corporate bonds were low and issuance volumes had been strong. In Australia, the cost of capital for corporations had been quite stable for some years, although more recently it had declined a little. Members also discussed hurdle rates for business investment, which had not changed much over recent times.

Major exchange rates had generally been little changed over September, with the US dollar having appreciated over the preceding two years or so on a trade-weighted basis. The Chinese renminbi had stabilised after its earlier depreciation, while the Japanese yen had depreciated, consistent with some easing of concerns about global risks. The Australian dollar had been little changed and remained around its lowest level in recent years.

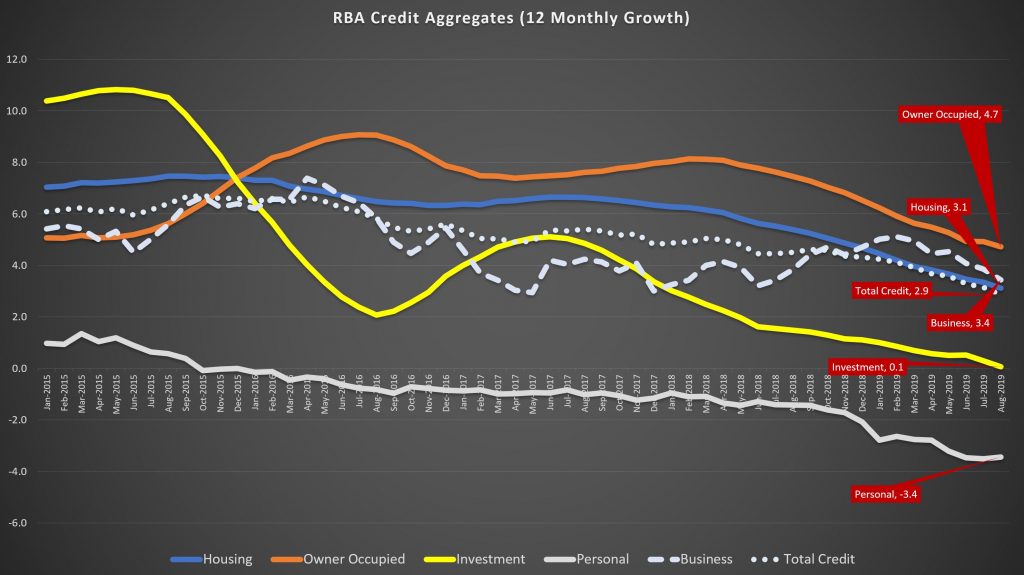
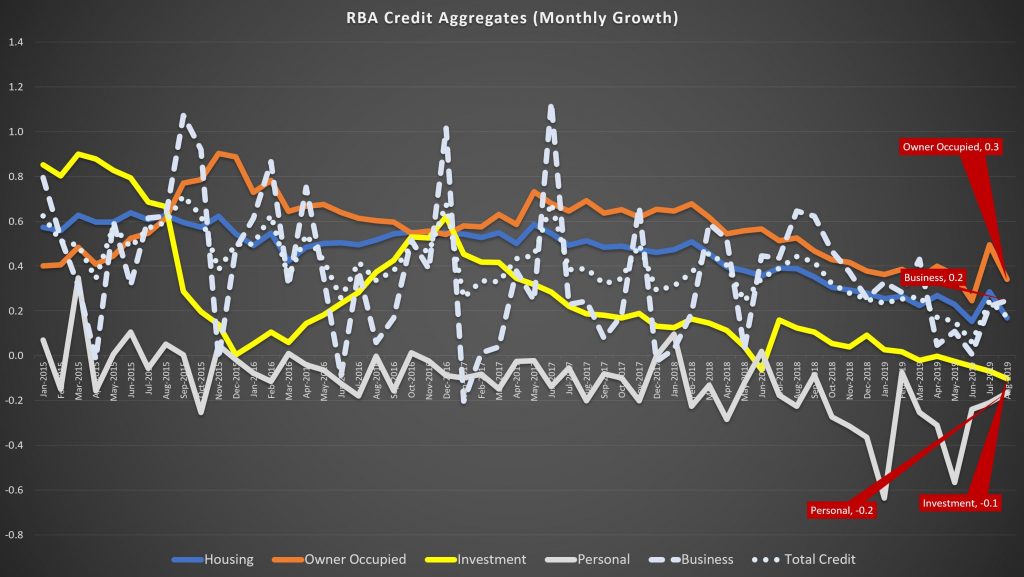
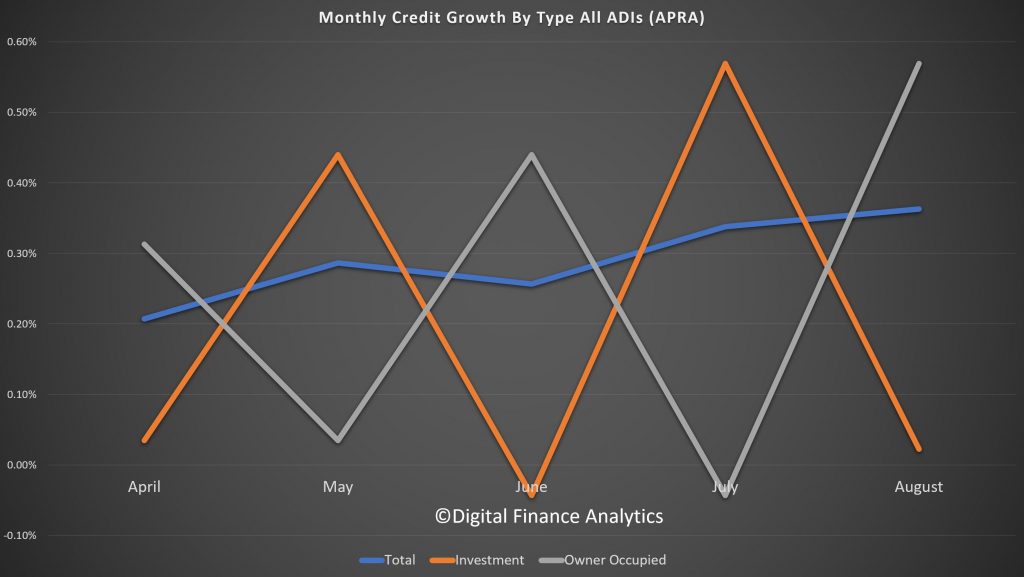
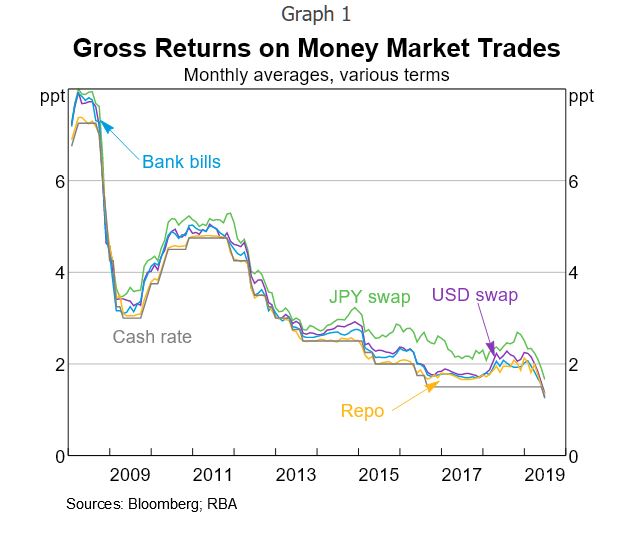
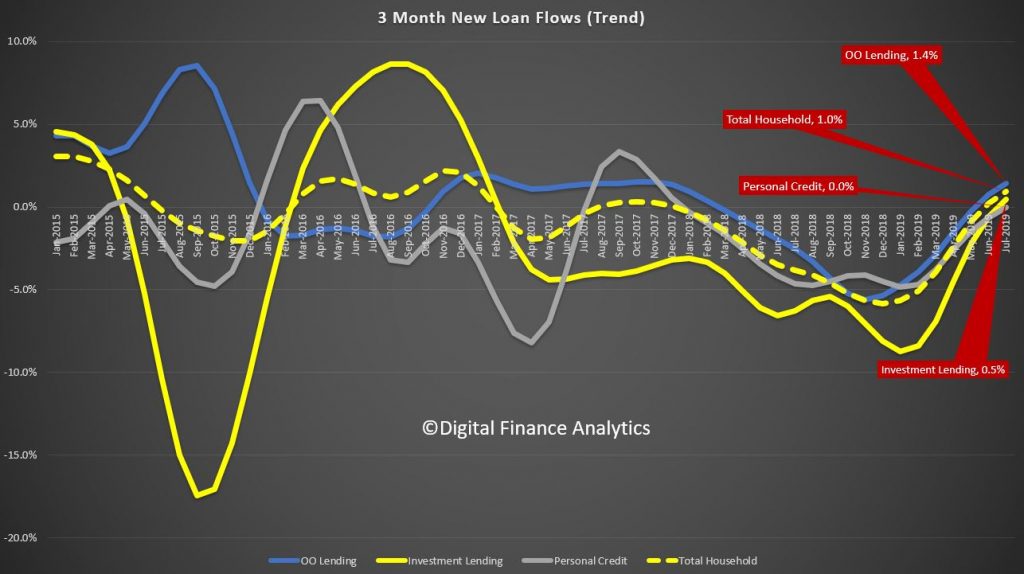
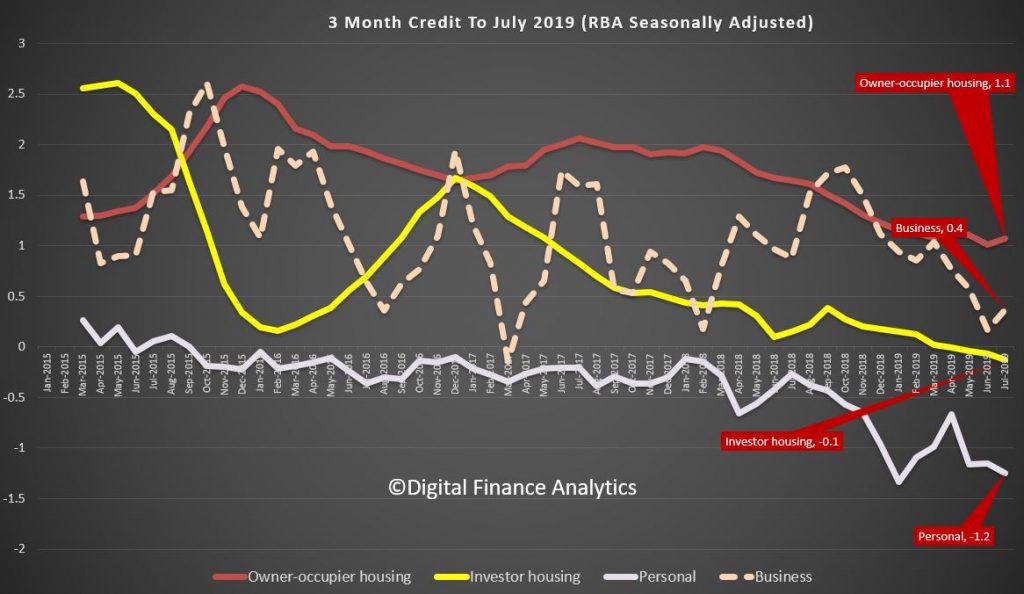
In Australia, borrowing rates for households and businesses, as well as banks’ funding costs, were at historically low levels. Housing loan approvals to both owner-occupiers and investors had increased in the three months to August, consistent with stronger conditions in some established housing markets. However, members noted that this increase in approvals had not yet translated into faster growth in housing credit. The pace of growth in housing credit for owner-occupiers had been fairly steady since the beginning of the year and the stock of housing credit for investors had continued to decline a little.

Financial market pricing indicated that a 25 basis points reduction in the cash rate was largely priced in for the October meeting, with a further reduction expected by mid 2020.

Financial Stability

Members were briefed on the Bank’s regular half-yearly assessment of the financial system.

Globally, investors were accepting low rates of compensation for bearing risk, despite the increased chance of significantly weaker economic growth. Members noted that a sharp slowdown in global growth could result from an escalation of the US–China trade and technology disputes or geopolitical tensions in the Middle East, Hong Kong or the Korean peninsula. Central banks had eased monetary policy in response to the potential for weaker growth, and additional easing was expected by markets, leading to falls in long-term government bond yields. Despite the increased uncertainty, risk premiums were low and in some cases had fallen further. The lower risk-free interest rates and low term, credit and liquidity risk premiums had seen many asset prices increase further. Any shock that caused markets to increase risk premiums or revise upwards expectations of future policy rates, such as a pick-up in inflation without accompanying stronger growth, could see a broad range of asset prices fall. Given debt levels were high in some non-financial sectors in some economies, a fall in asset prices could result in financial stress for some businesses and households, which could spill over to financial institutions.

Members observed that there had been strong growth in corporate debt in the United States, France and Canada, particularly lower-quality debt. Members noted that borrowers whose credit ratings fell below investment grade, and who relied on market-based finance, could face difficulty accessing funding, given many investors’ mandates were constrained by credit ratings. The interaction of high sovereign debt and less resilient banks in Japan and some European economies was also seen as a risk. However, in the United States and the United Kingdom, the resilience of the banking system had increased as profitability had improved.

Corporate debt in China had increased sharply over the previous decade, although in relation to GDP it had declined recently in response to policy measures to promote deleveraging. These measures included closing some unprofitable state-owned firms, restructuring some debt, reducing the size of non-bank financing and reducing non-banks’ interactions with banks.

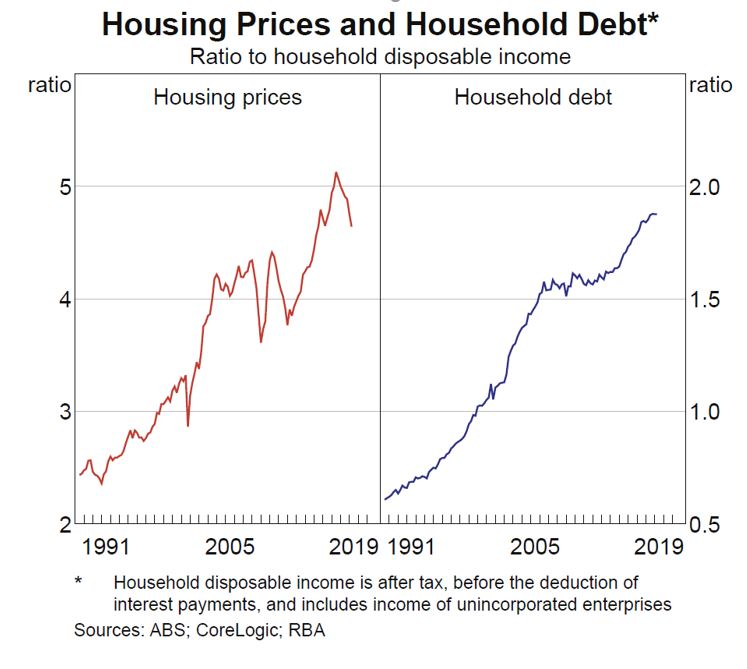
In Australia, near-term risks related to the housing market had eased in the preceding few months with a turnaround in housing prices in Sydney and Melbourne. Prices in those cities had fallen by a little under 10 per cent over the preceding 18 months, reducing the housing equity of households and resulting in a small share with negative equity. The recent increase in housing prices in those cities had reduced the risk of large increases in negative equity, which could result in losses for lenders if declines in income reduced households’ ability to meet debt repayments. Half of all loans in negative equity were in Western Australia and the Northern Territory, where housing price declines had persisted over the previous few years. Members noted that the rate of mortgage arrears in Western Australia had increased by more for riskier types of lending, including lending with smaller deposits, higher repayments relative to income, and loans to investors and self-employed borrowers.

Despite the high level of household debt in Australia relative to other countries, the risks from household debt appeared to be mostly contained. While the share of mortgages in arrears had continued to rise, it remained at a low rate relative to many other countries and in absolute terms. In addition, the quality of new lending had increased in recent years. The shares of loans with high loan-to-valuation ratios and with interest-only repayment terms had declined following a focus by regulators on this higher-risk lending. Further, members noted that households continued to have large prepayments on their housing debt. In aggregate, mortgage prepayments were equal to two-and-a-half years of repayments. However, while one-third of borrowers had prepayments exceeding two years of mortgage repayments, a slightly lower share had very little or no buffers. Of these, a little less than half appeared more likely to be vulnerable to shocks to their ability to meet their mortgage payments.

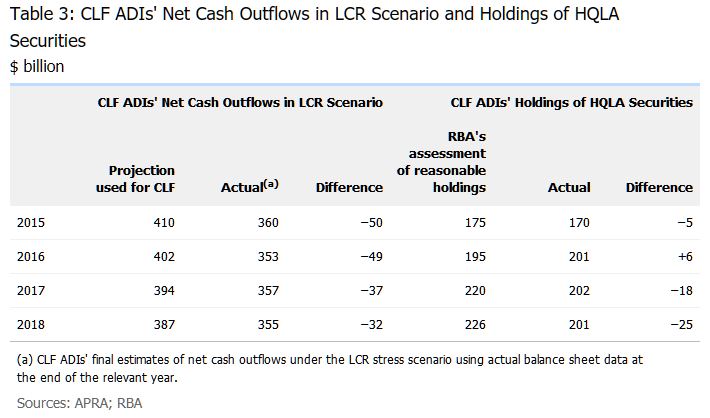
The resilience of Australian banks had increased since the financial crisis. Banks had largely completed their transition to their higher ‘unquestionably strong’ capital ratios. Banks’ resilience would increase further with the introduction by the Australian Prudential Regulation Authority of a Loss Absorbing Capacity (LAC) regime, which will require banks to raise an additional 3 percentage points of capital by 2024. Members observed that banks were already issuing new Tier 2 securities to meet their LAC requirements. Banks’ profitability had declined a little over the prior year or two, although banks remained highly profitable. The increase in housing arrears had resulted in a small decline in banks’ overall asset quality, although asset quality remained high. Rates of non-performing business loans were a little below rates for housing loans.

Members also discussed non-financial risks facing the financial system. Members noted that cyber risks, and IT risks more broadly, were increasing as technology systems become more complex and embedded in all operations. Members also noted that climate change presented a risk to financial institutions. While extreme weather events were thought unlikely to produce large losses for the financial system as a whole, at least at present, losses could be larger in future if financial institutions do not manage the risks carefully.

Considerations for Monetary Policy

In considering the policy decision, members observed that the risks to the global growth outlook remained tilted to the downside. The trade and technology disputes between the United States and China were affecting international trade and investment, as businesses scaled back their spending plans in response to increased uncertainty. In China, the authorities had taken further steps to support the economy, while continuing to address risks in the financial system. In most advanced economies, inflation remained subdued despite low unemployment rates and rising wages growth.

In this context, global interest rates had continued to decline, with the central banks in the United States and Europe reducing interest rates in the previous month. Further monetary easing was widely expected, as central banks continued to respond to the downside risks to the global economy and subdued inflation. Long-term government bond yields were close to record lows in many countries, including in Australia. Borrowing rates for both businesses and households were at historically low levels, and the Australian dollar was at its lowest level in recent years.

Members considered the case for a further easing in monetary policy at the present meeting, to support employment and income growth and to provide greater confidence that inflation would be consistent with the medium-term target. Members noted that the Bank’s most recent forecasts suggested that the unemployment and inflation outcomes over the following couple of years were likely to be short of the Bank’s goals. The most recent run of data had not materially altered this assessment and, on balance, had been on the softer side. The ongoing subdued rate of wages growth also suggested that the economy still had spare capacity. There was therefore a case to respond to the general outlook with a further easing of monetary policy.

Members were mindful, however, that monetary policy was already expansionary and that the lower exchange rate was also supporting growth. They acknowledged that these factors and the recent tax cuts could combine to boost growth by more than their individual effects would imply, especially given the context of the mining and established housing sectors seeming to have reached turning points. At the same time, members recognised that it was possible that the effects may be smaller than expected and the global risks were to the downside.

Members also considered the argument that some monetary stimulus should be kept in reserve to address any future negative shocks. However, that argument requires changes in interest rates to be the key driver of demand, rather than the level of interest rates, which experience has shown to be the more important determinant. Members concluded that the Board could reduce the likelihood of a negative shock leading to outcomes that materially undershot the Bank’s goals by strengthening the starting point for the economy.

The Board’s discussions also focused on the ongoing strength in employment growth. The period of strong employment growth had not reduced spare capacity in the labour market significantly. Almost all of the strength in employment growth over the preceding three years had been matched by higher participation, so there had been little progress on reducing unemployment and underemployment. It was also possible that participation was rising partly in response to weak growth in incomes. Moreover, employment growth was forecast to slow over the period ahead.

Members also discussed the possibility that policy stimulus might be less effective than past experience suggests. They recognised that some transmission channels, such as a pick-up in borrowing or the effect on the home-building sector, may not be operating in the same way as in the past, and that the negative effect of low interest rates on the income and confidence of savers might be more significant. Notwithstanding this, transmission through the exchange rate channel was still considered likely to work effectively, and evidence suggested that the positive effects of lower interest rates on aggregate household cash flows via lower debt repayments was likely to support household spending, given that household interest payments exceed receipts by more than two to one.

Members also noted that the housing market and other asset prices might be overly inflated by lower interest rates. Members acknowledged that asset prices were part of the transmission mechanism of policy, including by encouraging home building. By themselves, higher asset prices were considered unlikely to present a risk to macroeconomic and financial stability. This assessment would need to be reviewed if rapidly increasing asset prices were accompanied by materially faster credit growth, weak lending standards and rising leverage. Although household debt was still considered high, members saw only a limited risk of excessive borrowing at the current juncture: household disposable income growth (and thus borrowing capacity) is weak; the memory of recent housing price falls is still fresh; and banks are still quite cautious in their appetite to lend. Nonetheless, members assessed that close monitoring of this risk was warranted.

Members concluded that these various factors did not outweigh the case for a further easing of monetary policy at the present meeting. Taking into account all the available information, including the reductions in interest rates since the middle of the year, the Board decided to lower the cash rate by a further 25 basis points. Members judged that lower interest rates would help reduce spare capacity in the economy by supporting employment and income growth and providing greater confidence that inflation would be consistent with the medium-term target. Members also noted the trend to lower interest rates globally and the effect this was having on the Australian economy and inflation outcomes.

Members judged it reasonable to expect that an extended period of low interest rates would be required in Australia to reach full employment and achieve the inflation target. The Board would continue to monitor developments, including in the labour market, and was prepared to ease monetary policy further if needed to support sustainable growth in the economy, full employment and the achievement of the inflation target over time.

The Decision

The Board decided to lower the cash rate by 25 basis points to 0.75 per cent.

RBA On ‘Emergency Liquidity Injections’

The RBA released “Research Discussion Paper – RDP 2019-10 Emergency Liquidity Injections” by Nicholas Garvin.

Here is the non-technical summary.

Understanding liquidity crises has long been, and will probably long be, an important objective for economic policymakers. Liquidity risk is inherent to banking systems because banks fund long-term assets (like mortgages) with short-term and at-call debt (like deposits). This process benefits the economy by making more credit available for households and businesses. However, it also generates the risk that if short-term debtholders withdraw their funds en masse, banks are unlikely to be able to pay them. This paper contributes to the research literature that studies how a policymaker can handle such a situation, which broad monetary stimulus is not designed for, by modelling the scenario faced by the United States and other global financial centres in late 2008. This type of situation appears highly unlikely in Australia in the foreseeable future.

The model depicts a banking system that is solvent, but a system-wide withdrawal by debtholders leaves banks with short-term payment obligations that exceed their available funds (i.e. their liquidity). It is then in the policymaker’s interests to inject liquidity into the banking system, which can prevent bank failures and the harm to the economy that would likely follow. However, injecting liquidity incentivises banks to take more liquidity risk the next time around, which makes future liquidity crises more likely. This paper compares different types of liquidity injection policies by where they sit in the trade-off between the perverse incentives generated, and the ability to support the banking system during a crisis.

To address the subject, I develop a game-theoretic model in which banks decide how many liquid assets to hold as protection against funding withdrawals. Banks consider the losses they would suffer if a crisis eventuated, which depend on the type of liquidity injection policy implemented by the policymaker. If a crisis eventuates, the type of policy also influences how the crisis unfolds. By placing a particular type of policy into the model, we can therefore analyse that policy’s influence on banks’ risk-taking decisions and on crisis outcomes. The model replicates some features of liquidity injection policies highlighted previously in the research literature. It also generates two new insights, which are the paper’s main contributions.

The first insight is that, if the policymaker injects liquidity by lending to banks, there is an indirect benefit of requiring them to provide collateral. The benefit arises through the (secondary) markets for the securities that the policymaker accepts as collateral. In the model, the crisis is characterised by falling prices in these markets, driven by selling pressure from the banks that need more cash. However, banks cannot sell securities that they are providing as collateral. Collateral requirements can therefore alleviate ‘fire sales’ in these markets, which benefits other banks through the higher market prices. In aggregate, the banking system ends up better off after the crisis, but, for each individual bank, there is no increase in the return to taking more liquidity risk.

The second insight is about whether a policymaker can disincentivise risk-taking by charging high ‘penalty’ interest rates on its emergency lending. Farhi and Tirole (2012) argue that, regardless of the effects on banks’ incentives, once a crisis occurs, the policymaker will then offer low rates. This is because the risk-taking that caused the crisis has already taken place, and charging banks penalty rates could now put them in further distress. Therefore, banks view any claims by the policymaker that it would charge penalty rates in a crisis as not credible, so such claims are powerless to influence risk-taking. I present a counterargument: penalty rates can be credible if the emergency loans are long term. In the crisis I model, banks are in liquidity distress but they are still solvent (i.e. they have not run out of capital). This means they will have no trouble making the repayments once liquidity conditions in the banking system improve. Charging banks penalty rates on long-term loans during a crisis will therefore not put them in further distress, which gives penalty rates more credibility.

RBA Cuts Yet Again!

At its meeting today, the Board decided to lower the cash rate by 25 basis points to 0.75 per cent.

While the outlook for the global economy remains reasonable, the risks are tilted to the downside. The US–China trade and technology disputes are affecting international trade flows and investment as businesses scale back spending plans because of the increased uncertainty. At the same time, in most advanced economies, unemployment rates are low and wages growth has picked up, although inflation remains low. In China, the authorities have taken further steps to support the economy, while continuing to address risks in the financial system.

Interest rates are very low around the world and further monetary easing is widely expected, as central banks respond to the persistent downside risks to the global economy and subdued inflation. Long-term government bond yields are around record lows in many countries, including Australia. Borrowing rates for both businesses and households are also at historically low levels. The Australian dollar is at its lowest level of recent times.

The Australian economy expanded by 1.4 per cent over the year to the June quarter, which was a weaker-than-expected outcome. A gentle turning point, however, appears to have been reached with economic growth a little higher over the first half of this year than over the second half of 2018. The low level of interest rates, recent tax cuts, ongoing spending on infrastructure, signs of stabilisation in some established housing markets and a brighter outlook for the resources sector should all support growth. The main domestic uncertainty continues to be the outlook for consumption, with the sustained period of only modest increases in household disposable income continuing to weigh on consumer spending.

Employment has continued to grow strongly and labour force participation is at a record high. The unemployment rate has, however, remained steady at around 5¼ per cent over recent months. Forward-looking indicators of labour demand indicate that employment growth is likely to slow from its recent fast rate. Wages growth remains subdued and there is little upward pressure at present, with increased labour demand being met by more supply. Caps on wages growth are also affecting public-sector pay outcomes across the country. A further gradual lift in wages growth would be a welcome development. Taken together, recent outcomes suggest that the Australian economy can sustain lower rates of unemployment and underemployment.

Inflation pressures remain subdued and this is likely to be the case for some time yet. In both headline and underlying terms, inflation is expected to be a little under 2 per cent over 2020 and a little above 2 per cent over 2021.

There are further signs of a turnaround in established housing markets, especially in Sydney and Melbourne. In contrast, new dwelling activity has weakened and growth in housing credit remains low. Demand for credit by investors is subdued and credit conditions, especially for small and medium-sized businesses, remain tight. Mortgage rates are at record lows and there is strong competition for borrowers of high credit quality.

The Board took the decision to lower interest rates further today to support employment and income growth and to provide greater confidence that inflation will be consistent with the medium-term target. The economy still has spare capacity and lower interest rates will help make inroads into that. The Board also took account of the forces leading to the trend to lower interest rates globally and the effects this trend is having on the Australian economy and inflation outcomes.

It is reasonable to expect that an extended period of low interest rates will be required in Australia to reach full employment and achieve the inflation target. The Board will continue to monitor developments, including in the labour market, and is prepared to ease monetary policy further if needed to support sustainable growth in the economy, full employment and the achievement of the inflation target over time.

The Credit Impulse Hiccups In August 2019

Both the RBA and APRA released their respective credit aggregates to end August today. And its not running to script, despite the rate cuts, some stronger buying signs in some housing markets (but on low, low volumes), and increased competition for loans. Overall credit growth rates continue to decline.

The RBA data over the rolling 12 months showed that credit growth dropped to 2.9%, compared with 4.5% just one year ago. That is the slowest rate of growth since 2011. It peaked in 2015 at 6.6%.

Housing sector growth rose 3.1% over 12 months, compared with 5.4% a year back and from a high of 7.4% back in 2015. Within that owner occupied lending fell to 4.7%, compared with 9.1% back in 2016, and investment lending rose at just 0.1% over 12 months, compared with 10.8% back in May 2015.

Business credit growth eased back to 3.4% annualised, from 3.8% a year ago, and 7.4% back in 2016, reflecting weaker business confidence and concerns about the local and international economic outlook.

Annual personal credit is down 3.4%, compared with down 1.4% a year ago, and up 0.3% in 2015.

The more noisy one month series shows that owner occupied lending rose 0.3%, compared with 0.9% in 2015, investment lending fell 0.1%, compared with a rise of 0.9% in 2015, business credit rose 0.2%, way lower than peaks of more than 1% in 2015 and 2017, and personal credit fell 0.2% again.

Note the RBA makes seasonal adjustments to the data – though they do not disclose the basis of these adjustment, and this year has been far from typical.

They also say:

Historical levels and growth rates for the financial aggregates have been revised owing to the resubmission of data by some financial intermediaries, the re-estimation of seasonal factors and the incorporation of securitisation data. The RBA credit aggregates measure credit provided by financial institutions operating domestically. They do not capture cross-border or non-intermediated lending.

So more data noise. And talking of that the new APRA data is all over the shop. They started running a parallel series in March, and as we discussed last month, the proportion of investment loans in the stock data have risen.

Overall credit stock of housing loans for the ADI’s is running at 0.36% and appears to be rising since April. However, the swings between growth in investor and owner occupied loans are massive, (and in opposite directions). This is not a sign of good data collection in my view.

The overall portfolio market shares indicate that CBA remains the largest lender for owner occupied loans, with a 26.1% share, followed by Westpac 21%, and ANZ at 14.7%. In investment lending, Westpac remains a clear leader, with 28.6% of all lending, followed by CBA at 24% and NAB at 17.5%.

The monthly movements tells an interesting story, with CBA driving the largest growth in owner occupied loans (2.3 billion), while dropping investment loans by a small amount. Westpac extended its investment loans by $0.6 billion, and owner occupied loans by $1.3 billion. NAB and ANZ both lost investor share and ME Bank lost owner occupied and investor loans. Other lenders picked some of these up.

Finally, our analysis of the proportion of individual bank portfolios in investment loans (generally more risky in a down-turn), shows that 44.9% of Westpac’s portfolio is investment lending (worth $185 billion), compared with an ADI market average of 37.4%. NAB is at 43.4% and Macquarie at 43.7% and Bank of Queensland at 42.7%. On the other hand CBA is at 35.6% and ANZ at 35.3%.

Data from our surveys suggests weakening demand for credit, and if this eventuates, it is quite possible recent home prices will be confirmed as a bear trap. While some down traders and more affluent households are in the market, many other segments are sitting this one out.

Remember that falling credit growth will translate to falling home prices, the math is that simple. And more rate cuts won’t help much at all!

Mortgage Growth, The Only Game In Town

The recent RBA Bulletin included an article “Bank Balance Sheet Constraints and Money Market Divergence“, which in summary shows that money market trades have generally not been profitable for the four major banks since the financial crisis.

This is partly because debt funding costs have fallen by less than money market returns. In addition, equity funding, which is more expensive than debt, has increased. Consequently, the incentive for banks to arbitrage between money market interest rates has fallen.

They show that residential mortgages are always significantly more profitable than money market trades over the sample period (Graph 4). This suggests that there has been a substantial opportunity cost associated with diverting equity funding away from mortgages and towards lower-margin activities such as money market trading. This is consistent with the balance sheets of the major banks being weighted towards mortgages and away from trading investments.

According to the latest property exposure statistics from the Australian Prudential Regulation Authority (APRA), the ADI’s sector exposure to residential mortgages increased by 3.6 per cent when comparing the June quarter 2019 to the previous corresponding period.

Thus banks tend to prefer more profitable lines of business, such as lending for residential housing, over the narrow margins implied by money market arbitrage. In other words, bank profitability is strongly connected with mortgage growth.

We know that APRA has reduced the rules on minimum lending standards for mortgages in July, and since then, banks have dropped their minimum rate requirements, opening the taps for more loans. As Australian Broker reported recently:

Westpac will decrease its floor rate from 5.75% to 5.35%, effective 30 September.

The same change will go into effect at its subsidiaries: St. George, BankSA and Bank of Melbourne. 

After the initial round of floor reductions across lenders of all sizes, Westpac matched CBA with the higher floor rate of the big four banks at 5.75%, while ANZ and NAB each amended theirs to 5.50%.

Smaller lenders followed suit, the majority also updating their rates to either the 5.50% or 5.75% figure. 

While some went even lower, ME Bank amending its rate down to 5.25% and Macquarie to 5.30%, Westpac has taken a step away from the other majors with its newest update.  

With July marking the strongest demand for new mortgages in five years and further RBA rate cuts expected in the near future, the floor reduction seems well timed to capitalise on the strong market activity forecasted to continue into the coming

Now of course there are still tighter guidelines on income and cost analysis for mortgage applications than a couple of years ago, but have no doubt standards are lowering again, and mortgage lending momentum appears to be on the turn, judging by the most recent data.

And the RBA stock data showed a small rise in to total value of owner occupied loans outstanding, though investor loans are still sliding on a 3 month seasonally adjusted rolling basis.

We expect a further rise in the results to be released at the end of September, to end August 2019

In addition, as reported in the AFR, they are being encouraged to lend.

Scott Morrison says Australia’s banks must not shy away from lending after the Hayne commission as he pushes back against what he calls an “instinctiveness” in society towards responsible lending standards that are too onerous.

Speaking to the Australian American Association in New York, the Prime Minister said that while it was important to implement the findings of the royal commission, as well as other reforms such as the Banking Executive Accountability Regime, “we need our banks to keep lending”.

“We can’t be scared of our own shadows in our economy, the animal spirits in our economy and the role of the banking and financial system in extending credit.

And lenders are responding with a tranche of mortgage rate cuts to attract new borrowers or new refinances (rather than passing cheaper funding costs through to existing borrowers).

For example, the Commonwealth Bank of Australia changed its New Wealth Package fixed rates for owner-occupied and investment home loans, for both new and existing customers switching to a fixed rate home/investment home loan as of Tuesday, 24 September.

The largest rate drop is for owner-occupiers with interest-only home loans on a five-year fixed rate, who will see rates drop by 90 basis points to 3.99 per cent, as will investors with an interest-only home loans on a four-year fixed rate.

Owner-occupiers with IO mortgages on one-year and four-year fixed rates will see rates drop by 65 basis points (to 3.89 and 3.99 per cent, respectively), while those with a three-year fixed rate will see their new rate start from 3.79 per cent (10 basis points lower than previous).

Other sizeable rate drops include investors with a four-year fixed rate on P&I repayments, who will see their interest rates fall by 75 basis points to 3.64 per cent.

Investors with P&I repayments on other fixed rate terms will see rates drop from between 5 and 50 basis points.

Owner-occupiers with a P&I home loan that is on a one-year fixed rate term will see a range change of 60 basis points, dropping the new rate to 3.29 per cent. Those with a four-year fixed rate will also see their rates drop by the same amount, bringing the new rate to 3.49 per cent.

And ME Bank announced reductions of up to 49 basis points across its variable home loan products for investors.

The rate reduction announcement comes a week following ME bank’s 2019 financial year results, which saw its home loan portfolio grow by 7.3 per cent, from $24.5 billion to $26.3 billion (or 2.5 times system growth).

The bank has cut rates for investors on both principal and interest (P&I) and interest-only (IO) loans with a loan-to-value ratio of less than, or equal to, 80 per cent.

The changes have been applied to the “flexible home loan member package” for investors, as well as the “basic home loan” investor product, with all changes effective as of Tuesday, 24 September 2019.

The largest rate reduction (49 basis points) was applied to the bank’s basic home loan product, for investors making principal and interest repayments.

For investors on the bank’s basic home loan product, the new rates are as follows:

  • P&I repayments, any loan amount – 49 basis point reduction to 3.68 per cent p.a. (3.70 per cent comparison rate)
  • IO repayments, any loan amount – 45 basis point reduction to 3.89 per cent p.a. (3.79 per cent comparison rate)

Investors currently on the flexible home loan package (which requires an annual fee of $395) will see the following changes:

  • P&I repayments on a loan amount above $700,000 – 14 basis point reduction to 3.63 per cent p.a. (4.06 per cent comparison rate)
  • IO repayments on a loan amount between $400,000-$700,000 – 23 basis point reduction to 3.89 per cent p.a. (4.19 per cent comparison rate)

So to Philip Lowe’s recent speech “An Economic Update” where he said that…

…the global economy is that while it is still growing reasonably well, the risks are increasingly tilted to the downside. The main source of these downside risks are geopolitical developments in many parts of the world. These developments are creating considerable uncertainty and this uncertainty is causing businesses to reconsider their spending plans. This is making the international environment more challenging for us.

On the Australian economy, he said after having been through a soft patch, a gentle turning point has been reached. While we are not expecting a return to strong economic growth in the near term, we are expecting growth to pick up. Against this backdrop, the main source of domestic uncertainty continues to be the strength of household spending.

He went on to say over the past year, there has been no growth at all in consumption per person, which is an unusual outcome at a time when employment is growing strongly (Graph 9). An important part of the explanation here is that household disposable income has been increasing only slowly for an extended period, reflecting both subdued wage increases and strong growth in taxes paid.

The persistence of slow growth in household income has led many people to reassess how fast their incomes will increase in the future. As they have done this, they have also reassessed their spending, particularly on discretionary items, which has been quite weak over recent times (Graph 10). Not surprisingly, spending on household essentials has been much less affected.

Another part of the explanation for weak growth in household spending is the adjustment in the housing market. As housing prices have fallen, there has been a marked decline in housing turnover, with the turnover rate having declined to the lowest level in more than 20 years (Graph 11). With fewer of us moving homes, spending on new furniture and household appliances has been quite soft. So too has expenditure on moving costs and real estate fees. More broadly, the correction in the housing market has also affected the economy through its impact on residential construction activity.

Thus, we can join the dots, if banks lend more and stoke the housing market, this may reverse the weak consumer spending and drive the economy harder. This is of course why the Government and regulators are doing all they can to pull prices higher (though volumes remain very low, and the number of new listings have hardly moved).

And according to the ABC, more building firms are failing.

Statistics, provided by ASIC, show 169 NSW-based construction companies went into administration, receivership or a court-ordered shutdown in the June quarter — the highest number since the September quarter in 2015.

Over the whole 2018-19 financial year, 556 construction companies went under — 101 more than the previous financial year.

Experts say it is a reflection of the state’s slowing apartment and housing market, with about 50,000 less apartments being constructed compared to the same time two years ago, and a marked slowdown in housing construction.

An increasing number of half-finished apartment projects are doting the Sydney landscape, with property development giant Ralan Group — which collapsed in July owing $500 million to creditors — the most high-profile example.

Yet, despite all this in a Q&A the Governor was asked if he was concerned about the recent developments in the housing market. Lowe said the RBA was not worried about the recent lift in dwelling prices and he does not expect credit growth to materially lift due to lower interest rates – meaning that the recent acceleration in the housing market will not be an impediment to a near term rate cut.

In fact the only point of resistance against looser lending and more credit is ASIC’s appeal against the recent ruling relating to HEM (Household Expenditure Measures) that found knowing a customer’s current living expenses was immaterial to deciding whether they could afford repayments on a loan.

In the most famous line of his judgment, Justice Perram found that

“Knowing the amount I actually expend on food tells one nothing about what that conceptual minimum [of how much one can spend without going into “substantial hardship”] is. But it is that conceptual minimum which drives the question of whether I can afford to make the repayments on the loan.”

ASIC commissioner Sean Hughes said the regulator felt compelled to appeal after Justice Perram ruled that a lender “may do what it wants in the assessment process”.

“The Credit Act imposes a number of legal obligations on credit providers, including the need to make reasonable inquiries about a borrower’s financial circumstances, verifying information obtained from borrowers and making an assessment of whether a loan is unsuitable for the borrower,” he said in a statement.

“ASIC considers that the Federal Court’s decision creates uncertainty as to what is required for a lender to comply with its assessment obligation, nor does ASIC regard the decision as consistent with the legislative intention of the responsible lending regime.

“For those reasons, ASIC will appeal to the Full Court of the Federal Court.”

If ASIC loses then the final drag on future credit growth will be blown away.

I have to say, I find this whole narrative very unconvincing. Remember home prices relative to income remain very stretched, the debt burden has never been higher, and yet people are being encouraged to borrow big, and help resurrect the housing market (and the economy), at any cost.

If rates are cut again, the flow of credit will rise (thanks to the APRA changes and heightened competition among lenders). And of course the main driver of this is that banks need lending growth to drive future profitability. But my own modelling suggests that as we approach the zero bounds, profitability will actually be squeezed some more. That said, we can see why it is that Mortgage Growth is The Only Game In Town. From Polys, to Regulators, to Lenders, they all want it. Household though will bear the consequences.

Lowe On The Economy – “Extended Period Of Low Rates Required”

The main message from The RBA Governor tonight on the global economy is that while it is still growing reasonably well, the risks are increasingly tilted to the downside. The main source of these downside risks are geopolitical developments in many parts of the world. These developments are creating considerable uncertainty and this uncertainty is causing businesses to reconsider their spending plans. This is making the international environment more challenging for us.

On the Australian economy, there are two main messages.

The first is that after having been through a soft patch, a gentle turning point has been reached. While we are not expecting a return to strong economic growth in the near term, we are expecting growth to pick up. Against this backdrop, the main source of domestic uncertainty continues to be the strength of household spending.

The second message is a longer-term one. And that is the fundamental factors underpinning the longer-term outlook for the Australian economy remain strong. One of the ongoing challenges we face as a country is to capitalise on those strong fundamentals.

The Global Economy

This first graph shows global economic growth and the International Monetary Fund’s (IMF) forecasts for the next few years (Graph 1). Looking at this graph, one might ask why the concern: global growth has been stable and reasonable over recent times and the IMF is forecasting this to continue over the next couple of years. If this forecast were to come to pass, that would make for 12 years of solid growth.

Graph 1: World Growth
Graph 1

Looking at labour markets, one might also ask why the concern. Unemployment rates in most advanced economies are the lowest they have been in many decades, and businesses are finding it more difficult to fill jobs (Graph 2). These tighter labour markets are finally translating into stronger wages growth, with wages now increasing at close to the rates seen before the financial crisis in some countries. With inflation remaining low, this pick-up in wage growth is translating into real wage increases and strong growth in household spending.

Graph 2: Unemployment Rate
Graph 2

So why the concern?

The answer is the increased downside risks generated by various geopolitical developments. The most prominent of these are the trade and technology disputes between the United States and China. Others include: the Brexit issue, developments in the Middle East, the problems in Hong Kong and the tensions between Japan and South Korea.

The US–China disputes, in particular, are having a disruptive effect on international trade flows. Over the past year there has been no growth at all in international trade, despite the global economy growing at a reasonable rate (Graph 3). This weakness on the trade front is flowing through to factory output, with growth in industrial production slowing considerably.

Graph 3: Global Economic Activity
Graph 3

More broadly, though, the geopolitical concerns are creating considerable uncertainty about the future. This can be seen in measures of economic policy uncertainty constructed from news stories in leading media around the world (Graph 4).

Graph 4: Global Economic Policy Uncertainty
Graph 4

In the face of this uncertainty, it is not surprising that many businesses are preferring to wait before committing to significant investments; they are inclined to sit on their hands for a while and see how things play out. This is evident in the surveys of business investment intentions, which have fallen considerably (Graph 5). The effect is also evident in June quarter GDP figures, with GDP declining in Germany, the United Kingdom and Singapore.

Graph 5: Advanced Economies: Investment Intentions
Graph 5

A particular concern is that if this uncertainty continues, businesses might decide not only to defer investment, but to also defer hiring. Of course, it is also possible that some of these uncertainties will be resolved. If this were to happen, the global economy could grow quite strongly as firms caught up on their capital spending in an environment of easy financial conditions.

Notwithstanding this possibility, as the downside risks have come more clearly into focus, there has been a marked shift in the outlook for monetary policy globally. Almost all major central banks are expected to ease monetary policy over the year ahead, with the United States Federal Reserve and the European Central Bank having already moved in this direction (Graph 6). Given that inflation is low – and forecast to remain low – investors are also expecting central banks to maintain very accommodative settings of monetary policy for years to come.

Graph 6: Policy Rate Expectations
Graph 6

This expectation has had a major effect on long-term bond yields around the world. In Europe and Japan, investors are paying governments to hold their money for them (Graph 7). The Swiss Government, for example, can borrow for 30 years at a negative interest rate of 0.5 per cent. For the world as a whole, around a quarter of the total stock of government bonds on issue has negative yields. And where yields are in positive territory, they are at very low levels and in many cases at the lowest on record.

Graph 7: 10-year Government Bond Yields
Graph 7

All this is making for a challenging international environment.

The Australian Economy

I would now like to move to the Australian economy.

Over recent times, our economy has been going through a soft patch. Over the year to June, GDP grew by just 1.4 per cent, which is the slowest year-ended growth for some years (Graph 8). We did not expect this slowdown, so it has come as a bit of a surprise.

Graph 8: GDP Growth
Graph 8

It is important, though, that we keep things in perspective. The economic expansion in Australia has now been running for 28 years. That is quite an achievement. Over such a long expansion, there are going to be ebbs and flows in growth. There are also going to be periods where growth is stronger than expected – as it was in the first half of 2018 – and other periods, like now, where growth is weaker than expected.

With the benefit of hindsight, there are a few factors that help explain the slowing in the Australian economy over the past year.

One is the international developments that I spoke about earlier. While Australia has been less directly affected by the US–China trade disputes than have many other countries, there is an indirect effect through slower global growth and increased global uncertainty.

A second and more important factor is weak consumption growth.

Over the past year, there has been no growth at all in consumption per person, which is an unusual outcome at a time when employment is growing strongly (Graph 9). An important part of the explanation here is that household disposable income has been increasing only slowly for an extended period, reflecting both subdued wage increases and strong growth in taxes paid.

Graph 9: Household Consumption Growth per Person
Graph 9

The persistence of slow growth in household income has led many people to reassess how fast their incomes will increase in the future. As they have done this, they have also reassessed their spending, particularly on discretionary items, which has been quite weak over recent times (Graph 10). Not surprisingly, spending on household essentials has been much less affected.

Graph 10: Household Consumption Growth
Graph 10

Another part of the explanation for weak growth in household spending is the adjustment in the housing market. As housing prices have fallen, there has been a marked decline in housing turnover, with the turnover rate having declined to the lowest level in more than 20 years (Graph 11). With fewer of us moving homes, spending on new furniture and household appliances has been quite soft. So too has expenditure on moving costs and real estate fees. More broadly, the correction in the housing market has also affected the economy through its impact on residential construction activity.

Graph 11: Housing Turnover Rate
Graph 11

A third factor contributing to the slower growth has been the drought.

Across the Murray-Darling Basin, including here in the Northern Tablelands, farmers have faced extremely dry conditions. Indeed, as indicated in this graph, in some areas conditions have been the driest on record (Graph 12). Reflecting this, farm output in Australia has fallen for the past two years and there has been a sharp drop in farm income as farmers have had to cope with the increased costs for obtaining feed and water. These difficult conditions have contributed to the weakness in overall household incomes and consumption, and the effects are particularly felt in regional communities. The drought has also put upward pressure on food prices over the past year, particularly for bread, milk and meat. We are all hoping that the drought breaks soon.

Graph 12: Rainfall Deficiencies
Graph 12

Even after accounting for these three factors – the slowdown overseas, weak growth in household disposable incomes and the drought – part of the slowing in the Australian economy remains unexplained. This is especially so taking into account the labour market data, which continue to paint a stronger picture of the economy than the GDP data.

Over recent times, employment growth has been stronger than was expected. Over the past year, the number of people with a job increased by 2½ per cent (Graph 13). Reconciling this with GDP growth of just 1½ per cent remains a challenge, because, normally, output growth exceeds employment growth, rather than falls short. We are seeking to understand what is going on here. It is possible that it is just measurement noise, but we can’t yet rule out something more structural.

Graph 13: Employment Growth
Graph 13

The other striking feature of the labour market over recent times has been a large increase in labour supply. In particular, there has been a material lift in the labour force participation by women and by older Australians (Graph 14). As a result, the increase in labour supply has more than outstripped the increase in labour demand. Reflecting this and despite the strong employment growth, the unemployment rate has moved higher since the start of the year to 5¼ per cent.

Graph 14: Participation Rate
Graph 14

This increase in labour supply is a positive development, but it does mean that it is proving quite difficult to generate a tight labour market with the flow-on consequence that wage increases remain subdued. Over the past year, the Wage Price Index increased by just 2.3 per cent (Graph 15). This is a pick-up from the rates of recent years, but the lift in wages growth looks to have stalled recently. Another relevant factor here is the ongoing caps on wage increases in the public sector.

Graph 15: Wage Price Index Growth
Graph 15

Low wages growth is one of the factors contributing to low inflation outcomes. Over the year to June, inflation was 1.6 per cent, in both headline and underlying terms (Graph 16). Another contributing factor is the adjustment in the housing market, with rents increasing at the slowest rate in decades and declines being recorded in the price of building a new home in some cities (Graph 17). Another factor is various government initiatives to address cost-of-living pressures, with these initiatives pushing down inflation in administered prices. The price rises for utilities are also much lower than over recent years. Working in the other direction, the drought and the depreciation of the exchange rate have been pushing up retail prices over the past year.

Graph 16: Inflation
Graph 16
Graph 17: Inflation by Component
Graph 17

Looking forward, there are some signs that, after a soft patch, the economy has reached a gentle turning point. This is evident in the fact that GDP growth over the first half of this year was stronger than it was over the second half of last year (Graph 8). We are expecting a further modest pick-up in the quarters ahead.

This outlook is supported by a number of developments, including lower interest rates, the recent tax cuts, the depreciation of the Australian dollar, ongoing spending on infrastructure, the stabilisation of the housing markets in some cities and a brighter outlook for the resources sector. It is reasonable to expect that, together, these factors will see growth in the Australian economy return to around its trend rate next year, although there are some obvious risks to this outlook.

One factor that should help is an expected pick-up in household disposable income. Many households are currently receiving larger tax refunds due to the low and middle income tax offset. These payments will boost aggregate household income by 0.6 per cent this year. Past experience suggests that around half of these tax refunds will be spent over coming quarters. Household disposable income is also being boosted by lower interest rates, although the effect is uneven across the community, with lower rates reducing the income of those households who rely on interest income. Household spending should also be supported by an increase in housing turnover. Working in the other direction, though, is a further contraction in residential construction activity.

Another positive element is likely to come from the resources sector. Mining investment is expected to increase over the next year, after having declined for six years as the LNG investment boom wound down (Graph 18). Mining companies are increasing their investment not only to sustain their current production levels but, in some cases, to expand capacity as well. There has also been a pick-up in exploration activity. To be clear, we are not predicting a return to boom-time conditions in the resources sector. But we are predicting better times for the sector ahead.

Graph 18: Mining Investment
Graph 18

Business investment elsewhere in the economy is also expected to move higher. Earlier I discussed how uncertainty globally is affecting the outlook for investment in many countries. Fortunately, we don’t see the same spike in the measure of policy uncertainty in Australia that I showed in the earlier graph for the world economy. There has, however, been some softening in measures of business conditions – from well above average to around average.

The investment outlook is being supported by a solid pipeline of infrastructure projects. This ongoing investment in infrastructure is not only supporting demand in the economy at a time when this is needed, but it is also adding to the supply capacity of the economy and directly improving people’s lives, including through providing better services and reducing transport congestion.

Together, it is reasonable to expect that these various factors will see annual growth pick up from here. Apart from the international uncertainties, the main source of uncertainty around this outlook continues to be the strength of household spending. It remains the case that a sustained pick-up in household spending will require faster growth in household incomes than we have seen over recent times.

As we grapple with these issues, it is important that we do not lose sight of the fact that the Australian economy has strong fundamentals.

Australia is fortunate in having enviable endowments of natural resources, both in terms of minerals and agricultural land. We have a reputation as a highly reliable supplier and a producer of high-quality clean food. We also have close links with the rapidly growing countries of Asia. Three of the four most populous countries in the world – China, India and Indonesia – are in our neighbourhood. And our ties with these countries are strengthened by the many people from there who live, work and study in Australia.

Our demographics are also reasonably favourable. Our population is aging less quickly than that of many other advanced economies. The population is also growing relatively rapidly for an advanced economy – 1.7 per cent a year, compared with 0.6 per cent in the United States and declining populations in some countries in north Asia and Europe. Immigration has been a strong contributor to this: almost half of us were born overseas or have at least one parent who was born overseas. While we have struggled to meet the infrastructure needs that come with this growing population, it does bring a dynamism that is not easily matched in countries with declining populations.

We also have a highly talented, flexible and adaptive workforce. We have strong public institutions, a well-established macroeconomic framework, and the rule of law is respected. There is also a demonstrated record of responsible fiscal policy and low public debt. And, finally we benefit from having both a flexible exchange rate and a flexible labour market. So, our fundamentals are strong.

The challenge we face is to fully capitalise on these fundamentals. If we can do this then I am confident that we can, once again, experience strong growth in real incomes in Australia.

Monetary Policy

I would like to finish with some remarks about monetary policy.

As you would be aware, the Reserve Bank Board lowered the cash rate in June and July to a new low of 1 per cent. Financial markets are pricing in further reductions in the cash rate over the next year.

Our decisions – and the expectations of investors about the future – reflect both international and domestic factors.

On the international front, as I discussed earlier, interest rates around the world are low and they are moving lower. There are many reasons for this, but the central reason is that the global appetite to save is elevated relative to the global appetite to use those savings to invest in new productive capital. When lots of people want to save and there is not much demand for those savings, savers earn low returns.

We live in an interconnected world, which means that we cannot completely insulate ourselves from long-lasting shifts in global interest rates. Our floating exchange rate gives us a degree of monetary independence, but we can’t ignore structural shifts in global interest rates. If we did seek to ignore these shifts, our exchange rate would appreciate, which, in the current environment, would be unhelpful in terms of achieving both the inflation target and full employment.

As I have spoken about on other occasions, the key to more normal interest rates globally is addressing the factors that are leading to a depressed appetite to invest relative to the appetite to save. Whether or not this will happen, time will tell. But as a small open economy, we have to take the world and global interest rates as we find them.

On the domestic front, there has been an accumulation of evidence over recent times that the economy can sustain lower rates of unemployment and underemployment than previously thought likely. The flexibility of labour supply also means that strong rates of employment growth can be sustained without inflation becoming a problem. These are both positive developments.

Inflation has been below the 2–3 per cent medium-term target range for some time now for the reasons that I spoke about earlier. Looking ahead, inflation is expected to pick up, but to remain below the midpoint of the target range for some time to come.

The decisions to ease monetary policy in June and July were taken to help make more assured progress towards full employment and the inflation target. Further monetary easing may well be required. While we are at a gentle turning point and expect growth to pick up, the strength and durability of this pick-up remains to be seen.

Regardless of the short-term outlook for monetary policy, the point about the solution to low global rates is relevant here in Australia too. We will all be better off if businesses have the confidence to expand, invest, innovate and hire people. Given Australia’s strong fundamentals, this is not out of our reach, but it does require constant effort.

At our Board meeting next week, we will again take stock of the evidence. It is nevertheless likely that an extended period of low interest rates will be required in Australia to make progress in reducing unemployment and achieving more assured progress towards the inflation target. The Board is prepared to ease monetary policy further if needed to support sustainable growth in the economy, make further progress towards full employment, and achieve the inflation target over time.

QE Through The Back Door? [Podcast]

We look at the RBA’s Committed Liquidity Facility as featured in this months RBA Bulletin.

Digital Finance Analytics (DFA) Blog
QE Through The Back Door? [Podcast]
Loading
/

RBA On The CLF

In the latest RBA Bulletin there is an article on the Committed Liquidity Facility, which is a facility designed to support some of our major banks. Under the CLF, the Reserve Bank will provide an ADI with liquidity via repurchase agreements (repos), for a fee. Since the CLF was introduced in 2015, the number of ADIs that have applied to APRA to have a facility has risen from 13 to 15.

Under the Basel liquidity standard, the liquidity coverage ratio (LCR) requires authorised deposit-taking institutions (ADIs) to have enough high-quality liquid assets (HQLA) to cover their net cash outflows in a 30-day liquidity stress scenario. Jurisdictions with a clear shortage of domestic currency HQLA can use alternative approaches to enable financial institutions to satisfy the LCR – hence the CLF in Australia.

The RBA says the CLF has been in operation for five years and continues to be required given the still relatively low level of government debt in Australia. However, because the volume of HQLA securities has increased over recent years and they appear to have become more available for trading in secondary and repo markets, the Reserve Bank has assessed that the CLF ADIs should be able to raise their holdings to 30 per cent of the stock of HQLA securities. This increase will occur at a pace of 1 percentage point each year, commencing with an increase to 26 per cent in 2020. Taking into account how the CLF ADIs have responded to the framework between 2015 and 2019, the Reserve Bank has also concluded that the CLF fee should be increased from 15 basis points to 20 basis points by 2021; this is to proceed in two steps, with the fee rising to 17 basis points on 1 January 2020 and to 20 basis point on 1 January 2021.

These pricing changes will have only a minor impact on the CLF Banks in terms of their net interest margins, at a time when many other factors are in play, such as reductions in the RBA’s cash rate, competition for mortgages and the yield curve driving pricing in the 2-5 years portion of banks treasury portfolios.

But there are two bigger questions to ask and answer. First, given the size of Government debt now, and the flow of bonds available, why do we still need this facility at all?

Net general government debt at June 2019 is $374bn (19.2% of GDP), some $12.5bn higher than forecast in the April 2019 Budget

The answer to that, and the second point is the CLF is essentially a back-door QE measure. If international liquidity became an issue, or if rate decreases triggered a capital flight, the CLF allows the RBA to step in and fund the banks’ funding shortfall from a loss of international investors, at rates below the banks’ international funding rates. Thus, high cost international funding by the banks can easily be replaced by cheap RBA funding through a form of QE or money printing subsidising bank profits and banker bonuses – for a short period.

This also distorts the markets because there are many lenders unable to get the CLF, creating a two-tier banking system with the “blessed” 15 supported by the CLF.

This is what the RBA says:

The Reserve Bank provides the Committed Liquidity Facility (CLF) as part of Australia’s implementation of the Basel III liquidity standard.[1] This framework has been designed to improve the banking system’s resilience to periods of liquidity stress. In particular, the liquidity coverage ratio (LCR) requires authorised deposit-taking institutions (ADIs) to have enough high-quality liquid assets (HQLA) to cover their net cash outflows in a 30-day liquidity stress scenario. Under the Basel liquidity standard, jurisdictions with a clear shortage of domestic currency HQLA can use alternative approaches to enable financial institutions to satisfy the LCR. These include the central bank offering a CLF. This is a commitment by the central bank to provide funds secured by high-quality collateral through the period of liquidity stress. This commitment can then be counted by the ADI towards meeting its LCR requirement given the scarcity of HQLA. The Australian Prudential Regulation Authority (APRA) has implemented the LCR in Australia, incorporating a CLF provided by the Reserve Bank.[2]

The CLF Is Required Due to the Low Level of Government Debt in Australia

The Australian dollar securities that have been assessed by APRA to be HQLA are Australian Government Securities (AGS) and securities issued by the central borrowing authorities of the states and territories (semis). All other forms of HQLA available in Australian dollars are liabilities of the Reserve Bank, namely banknotes and Exchange Settlement Account (ESA) balances. For securities to be considered HQLA, the Basel liquidity standard requires that they have a low risk profile and be traded in an active and sizeable market. AGS and semis satisfy these requirements since they are issued by governments in Australia and are actively traded in financial markets. In contrast, there is relatively little trading in other key types of Australian dollar securities, such as those issued by supranationals and foreign governments (supras), covered bonds, ADI-issued paper and asset-backed securities (Graph 1). Given this, these securities are not classified as HQLA.

Graph 1: Monthly Turnover Ratio for AUD Bonds
Graph 1

The supply of AGS and semis is not sufficient to meet the liquidity needs of the Australian banking system. This reflects the relatively low levels of government debt in Australia (Graph 2). When the CLF was first introduced in 2015, ADIs would have needed to hold around two-thirds of the stock of HQLA securities to be able to cover their LCR requirements. Such a high share of ownership by the ADIs would have reduced the liquidity of these securities, defeating the purpose of them being counted on as HQLA.

Graph 2: Gross Government Debt
Graph 2

Jurisdictions with low government debt have used a range of approaches to address the resulting shortage of domestic currency HQLA. Australia is one of three countries that have put in place a CLF, along with Russia and South Africa. Some other jurisdictions have allowed financial institutions to hold HQLA in foreign currencies to cover their liquidity needs in domestic currency. The main downsides of the latter approach is that it relies on foreign exchange markets to be functioning smoothly in a time of stress and increases the foreign currency exposures in the banking system. Some jurisdictions have classified a broader range of domestic currency securities as HQLA. However, this approach has not been taken in Australia due to the low liquidity of Australian dollar securities other than AGS and semis.

The Conditions for Accessing the CLF

APRA determines which ADIs can establish a CLF with the Reserve Bank. Access is limited to those ADIs domiciled in Australia that are subject to the LCR requirement.[3] Before establishing a CLF, these ADIs must apply to APRA for approval. In these applications, the ADIs have to demonstrate that they are making every reasonable effort to manage their liquidity risk independently rather than relying on the CLF. APRA also sets the size of the CLF, both in aggregate and for each ADI.

The Reserve Bank makes a commitment under the CLF to provide a set amount of liquidity against eligible securities as collateral, subject to the ADI having satisfied several conditions.[4] The ADI is required to pay a CLF fee to the Reserve Bank that is charged on the entire committed amount (not just the amount drawn). To access liquidity through the CLF, an ADI must make a formal request to the Reserve Bank that includes an attestation from its CEO that the institution has positive net worth. The ADI must also have positive net worth in the opinion of the Reserve Bank.

Under the CLF, the Reserve Bank will provide an ADI with liquidity via repurchase agreements (repos). In a repo, funds are exchanged for high-quality securities as collateral until the funds are repaid. These securities must meet criteria set by the Reserve Bank. The types of securities that the ADIs can hold for the CLF include self-securitised residential mortgage backed securities (RMBS), ADI-issued securities, supras, and other asset-backed securities. To protect against a decline in the value of these securities should an ADI not meet its obligation to repay, the Reserve Bank requires the value of the securities to exceed the amount of liquidity provided by a certain margin. These margins are set by the Reserve Bank to manage the risks associated with holding these securities.[5] If the CLF is drawn upon, the ADI must also pay interest to the Reserve Bank for the term of the repo at a rate set 25 basis points above the cash rate.

The First Five Years of the CLF

Since the CLF was introduced in 2015, the number of ADIs that have applied to APRA to have a facility has risen from 13 to 15.[6] Each year, APRA sets the total size of the CLF by taking the difference between the Australian dollar liquidity requirements of the ADIs and the amount of HQLA securities that the Reserve Bank assesses can be reasonably held by these ADIs (the CLF ADIs) without unduly affecting market functioning.

For 2015-19, the Reserve Bank assessed that the CLF ADIs could reasonably hold 25 per cent of the stock of HQLA securities. In determining this, the Reserve Bank took into account the impact of the CLF ADIs’ holdings on the liquidity of HQLA securities in secondary markets, along with the holdings of other market participants. The volume of HQLA securities that the CLF ADIs could reasonably hold increased from $175 billion in 2015 to $225 billion in 2019, reflecting growth in the stock of HQLA securities (Table 1). Over the period, the CLF ADIs held a significantly higher share of the stock of HQLA securities than in the years leading up to the introduction of the LCR (Graph 3). The CLF ADIs have been holding a larger share of the stock of semis compared to AGS.

Graph 3: CLF ADIs' Holdings of AUD HQLA Securities
Graph 3

The CLF ADIs’ projected LCR requirements, which were used in calculating the CLF, increased modestly in aggregate from $449 billion in 2015 to $468 billion in 2019. This increase can be entirely explained by the CLF ADIs seeking to raise their liquidity buffers over time to be well above the minimum LCR requirement of 100. Reflecting this, the aggregate LCR for these ADIs increased from around 120 per cent in 2015 to around 130 per cent in 2019; this was the case for their Australian dollar liquidity requirements as well as for their requirements across all currencies (Graph 4).[7]

Graph 4: CLF ADIs' Aggregate Liquidity Coverage Ratio
Graph 4

The aggregate CLF amount is the CLF ADIs’ projected LCR requirements less the RBA’s assessment of their reasonable holdings of HQLA securities. APRA reduced the aggregate size of the CLF from $274 billion in 2015 to $243 billion in 2019. This reflected that the volume of HQLA securities that the CLF ADIs could reasonably hold increased by more than their projected liquidity requirements over this period.

From 2015 to 2019, the Reserve Bank charged a CLF fee of 15 basis points per annum on the commitment to each ADI. The fee is set so that ADIs face similar financial incentives to meet their liquidity requirements through the CLF or by holding HQLA. The amount of CLF fee paid by the CLF ADIs to the Reserve Bank declined from $413 million in 2015 to $365 million in 2019, which is in line with the reduction in the size of the CLF. Since the CLF was established, no ADI has drawn on the facility in response to a period of financial stress.[8]

Assessing ADIs’ Reasonable Holdings of HQLA Securities

When assessing the volume of HQLA securities that the CLF ADIs can reasonably hold, the Reserve Bank seeks to ensure that these holdings are not so large that they impair market functioning or liquidity. For the period from 2015 to 2019, the Reserve Bank assessed that the CLF ADIs could reasonably hold 25 per cent of HQLA securities without materially reducing their liquidity. This was informed by the fact that a large proportion of HQLA securities were owned by ‘buy and hold’ investors. These investors were price inelastic and generally did not lend these securities back to the market, reducing the free float of HQLA securities. Many of these investors were non-residents (such as sovereign wealth funds), which were holding nearly 60 per cent of the stock of HQLA securities earlier in the decade (Graph 5). So overall, the Reserve Bank concluded that these bond holdings were not contributing significantly to liquidity in the market.

Graph 5: Non-resident Holdings of HQLA Securities
Graph 5

Over recent years, the volume of HQLA securities has risen and they have become more readily available in bond and repo markets (Table 1). The Australian repo market has grown considerably, driven by more HQLA securities being sold under repo. Since 2015, non-residents have emerged as significant lenders of AGS and semis (and borrowers of cash) in the domestic market (Graph 6). Over the same period, repo rates at the Reserve Bank’s open market operations have risen relative to unsecured funding rates (Graph 7). This is consistent with market participants financing a larger volume of HQLA securities on a short-term basis through the repo market. For this assessment, the increased availability of HQLA securities in the market suggests that the CLF ADIs should be able to hold a higher share of these securities without impairing market functioning.

Graph 6: Repurchase Agreements
Graph 6
Graph 7: Repo Rates at Open Market Operations
Graph 7

Analysis of transactions in the bond and repo markets using data from 2015–17 suggests that most HQLA securities were being actively traded.[9] Monthly turnover ratios for AGS bond lines were well above zero, and much higher than turnover ratios for other Australian dollar securities such as asset-backed securities, covered bonds, ADI-issued paper and supras (Graph 1). Although semis bond lines were traded less frequently than AGS, relatively few semis had low turnover ratios (Graph 8). As such, some increase in ADIs’ holdings of AGS and semis would appear unlikely to jeopardise liquidity in these markets.

Graph 8: Bonds With Low Turnover Ratios
Graph 8

Earlier in the decade, a ‘scarcity premium’ had emerged in the pricing of HQLA securities. Australia’s relatively strong economic performance and AAA sovereign rating have been of considerable appeal to investors with a preference for highly rated securities. Higher yields compared to other AAA-rated sovereigns also contributed to strong demand from foreign investors, particularly for AGS. The scarcity premium was most prominent before 2015, when the yield on 3-year AGS was well below the expected cash rate over the equivalent horizon (as measured by overnight indexed swaps (OIS); Graph 9). However, the scarcity premium has dissipated alongside an increase in the stock of AGS on issue. This suggests that there is scope for the CLF ADIs to hold more HQLA securities without impairing market functioning.

Graph 9: Spread of 3-year AGS to OIS
Graph 9

Given these developments, the Reserve Bank has assessed that the CLF ADIs should be able to increase their holdings to 30 per cent of the stock of HQLA securities.[10] To ensure a smooth transition and thereby minimise the effect on market functioning, the increase in the CLF ADIs’ reasonable holdings of HQLA securities will occur at a pace of 1 percentage point per year until 2024, commencing with an increase to 26 per cent in 2020.

The CLF Fee

The Reserve Bank sets the level of the CLF fee such that ADIs face similar financial incentives when holding additional HQLA securities or applying for a higher CLF in order to satisfy their liquidity requirements. A useful starting point to assess the appropriate CLF fee is to compare the yields on the CLF collateral and the HQLA securities held by the relevant ADIs.[11] The Reserve Bank estimated that the weighted average yield differential between the CLF collateral and the HQLA securities was around 90 basis points in the March quarter 2019 (Table 2). This includes the compensation required by ADIs to account for the higher credit risk associated with holding CLF collateral rather than HQLA securities, which would be a sizeable share of the spread. However, it is only the additional liquidity risk associated with holding CLF collateral that should be reflected in the CLF fee. In practice, adjusting the spread between CLF collateral and HQLA securities to remove the credit risk component is not straightforward.

When the Reserve Bank set the CLF fee earlier this decade, it looked at repo rates on some CLF-eligible securities to gauge how much a one-month liquidity premium might be worth. Before late 2013, it was possible to separately identify repo rates on government securities (AGS and semis) and private securities (such as ADI-issued securities) in the Reserve Bank’s market operations. Based on these data, it was estimated that the one-month liquidity premium for private securities was less than 10 basis points in normal circumstances. However, given that part of the purpose of the liquidity reforms was to recognise that the market had under-priced liquidity in the past, it was judged to have been appropriate to set the fee at 15 basis points.

It has since become more difficult to gauge a liquidity premium by using repo rates. In particular, in late 2013 the Reserve Bank ceased to charge different repo rates for government and private securities. Instead, the Bank revised its margin schedule to manage the credit risk on different types of collateral accepted under repo. Moreover, most of the collateral now being purchased by the Reserve Bank under repo is HQLA securities. This suggests that repo rates mostly reflect the price for converting HQLA securities into ESA balances, rather than CLF collateral into HQLA.

At the same time, it is now possible to take into account how the CLF ADIs have responded to the existing framework when setting the future CLF fee. Since the CLF was introduced, the CLF ADIs (in aggregate) have consistently overestimated their liquidity requirements (Table 3). This has resulted in the CLF ADIs being granted larger CLF amounts, which they have mainly used to hold larger buffers above the minimum required LCR of 100 (Graph 4).[12] In recent years, the CLF ADIs have also been holding fewer HQLA securities than the Reserve Bank had judged could be reasonably held without impairing the market for HQLA securities. Taken together, these two observations suggest that the CLF fee should be set at a higher level in future.

However, there is uncertainty about the exact level of the fee that would make ADIs indifferent between holding more HQLA or applying for a larger CLF. If the CLF fee is set too high, this could trigger a disruptive shift away from using the facility and distort the markets that use HQLA. This has potential implications for the implementation of monetary policy, since the market that underpins the cash rate involves the trading of ESA balances, which are also HQLA.[13] The remuneration on ESA balances is purposefully set at a rate of 25 basis points below the cash rate target in order to encourage ADIs to recycle their surplus ESA balances rather than holding them. There are scenarios where holding ESA balances could be a cheaper way to satisfy the LCR than holding HQLA securities. For instance, earlier in the decade, the yield on AGS was at or below the expected return from holding ESA balances (Graph 9). In this context, the CLF fee should be set such that ADIs would not have an incentive to meet their LCR requirements by holding excessive ESA balances.

As a result of these considerations, the RBA has concluded that the CLF fee should be increased moderately. This should ensure that ADIs have strong incentives to manage their liquidity risk appropriately, without generating unwarranted distortions in the markets that use HQLA. To ensure a smooth transition by minimising the effect on market functioning, the increase will occur in two steps, with the CLF fee rising to 17 basis points on 1 January 2020 and to 20 basis points on 1 January 2021.[14]