The US government’s proposal to impose tariffs on USD50 billion-USD60 billion worth of imports from China is unlikely to have a significant impact on the Chinese or global economy, says Fitch Ratings.
The risk that piecemeal protectionist measures escalate into a more damaging trade war has risen in recent months, but China’s measured response so far and US indications of openness to negotiation suggest this scenario should still be avoided.
The US administration has proposed the tariffs in response to what it considers to be unfair Chinese trade policies that have led to the acquisition of US technologies – invoking the authority provided by Section 301 of the US Trade Act. Aerospace, information and communication technology, and machinery will be targeted, with details due within the next two weeks. The administration will also consider measures to block Chinese acquisition of US technology through M&A and press the World Trade Organization to examine China’s technology licensing practices.
USD60 billion is equivalent to around 2.5% of China’s total merchandise exports, or 0.5% of its GDP, but the impact of the tariffs on the Chinese economy would be much smaller. Some of these goods will still end up going to the US, given the lack of substitutes, while others could be diverted to different markets. Moreover, the domestic value-added content of China’s exports is typically only around two-thirds, or less than one-half in the case of ICT goods, which contain a high proportion of imported inputs. Overall, we would not expect these tariffs to create a drag on Chinese GDP growth of much more than 0.1 percentage point this year.
The bigger risk is that the US eventually imposes across-the-board tariffs on China, either because its bilateral trade deficit with China stays large or in the context of an escalating trade war between the two countries. The US accounts for almost one-fifth of China’s total exports, equivalent to 3.6% of Chinese GDP, so broader tariffs could have a sizeable impact on China’s economy, and would have knock-on effects for the supply chain across the rest of Asia. A China-US trade war would also undermine global investor sentiment.
This more severe scenario cannot be ruled out, but we still expect new policies, either from the US or China in retaliation, to continue to fall under sector-specific measures. China has announced its own tariffs targeting USD3 billion worth of US agricultural goods in response to previous US tariffs on steel and aluminium, but Premier Li Keqiang has stated that “a trade war does no good to either side”. Meanwhile, US President Donald Trump has stated that the US and China are in negotiations. In that respect, the 30-day consultation period following the release of US tariff details should temper the prospect of immediate escalation and could provide time for a compromise to be reached.
A more challenging external environment could add to the risk of Chinese policymakers falling back on credit-fuelled stimulus, which would also be a major setback to the deleveraging agenda. Strong external demand was a key factor behind the outperformance of China’s economy last year, which allowed the authorities to focus on addressing financial risks without jeopardising GDP growth targets.
Today we examine the recent Financial Market Earthquakes and ask, are these indicators of more trouble ahead?
Welcome to the Property Imperative Weekly to 24th March 2018. Watch the video or read the transcript.
In this week’s review of property and finance news we start with the recent market movements and consider the impact locally.
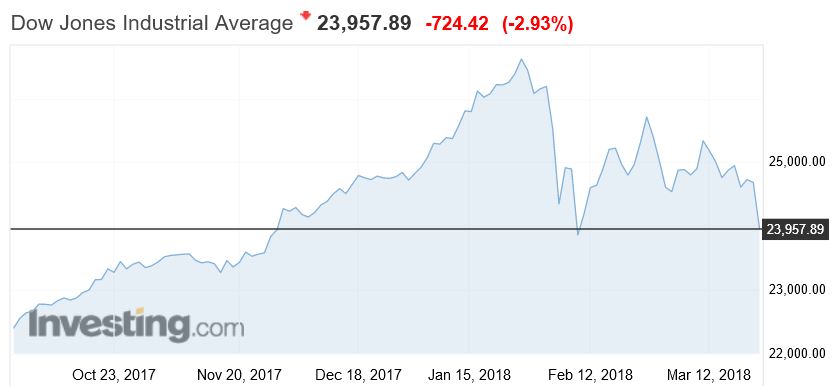
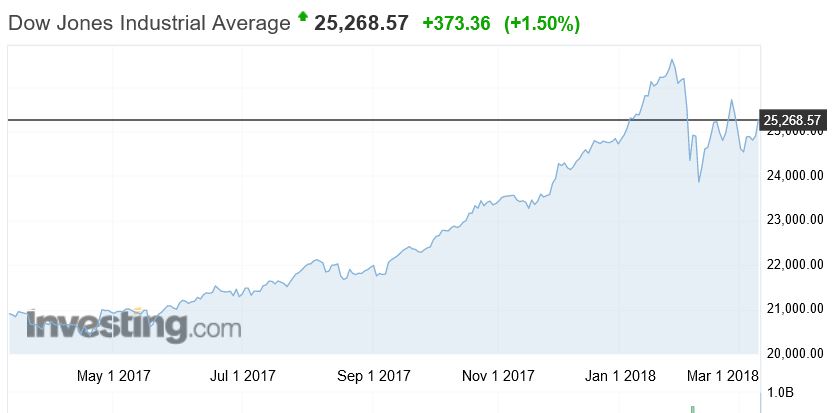
The Dow 30 has come back, slumping more than 1,100 points between Thursday and Friday, and ending the week in correction territory – meaning down more than 10% from its recent high.
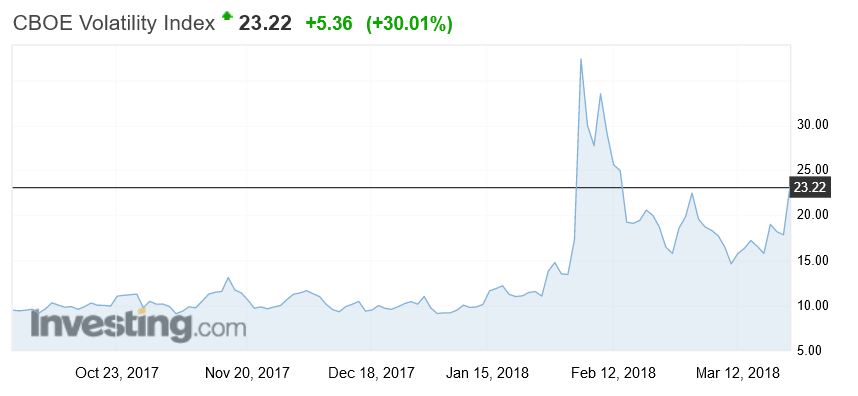
The volatility index – the VIX which shows the perceived risks in the financial markets also rose, up 6.5% just yesterday to 24.8, not yet at the giddy heights it hit in February, but way higher than we have seen for a long time – so perceived risks are higher.
And the Aussie Dollar slipped against the US$ to below 77 cents from above 80, and it is likely to drift lower ahead, which may help our export trade, but will likely lead to higher costs for imports, which in turn will put pressure on inflation and the RBA to lift the cash rate. The local stock market was also down, significantly. Here is a plot of the S&P ASX 100 for the past year or so. We are back to levels last seen in October 2017. Expect more uncertainty ahead.
So, let’s look at the factors driving these market gyrations. First of course U.S. President Donald Trump’s signed an executive memorandum, imposing tariffs on up to $50 billion in Chinese imports and in response the Dow slumped more than 700 points on Thursday. There was a swift response from Beijing, who released a dossier of potential retaliation targets on 128 U.S. products. Targets include wine, fresh fruit, dried fruit and nuts, steel pipes, modified ethanol, and ginseng, all of which could see a 15% duty, while a 25% tariff could be imposed on U.S. pork and recycled aluminium goods. We also heard Australia’s exemptions from tariffs may only be temporary.
Some other factors also weighed on the market. Crude oil prices rose more than 5.5% this week as following an unexpected draw in U.S. crude supplies and rising geopolitical tensions in the middle east. Crude settled 2.5% higher on Friday after the Saudi Energy Minister said OPEC and non-OPEC members could extend production cuts into 2019 to reduce global oil inventories. Here is the plot of Brent Oil futures which tells the story.
Bitcoins promising rally faded again. Earlier Bitcoin rallied from a low of $7,240 to a high of $9175.20 thanks to easing fears that the G20 meeting Monday would encourage a crackdown on cryptocurrencies. Finance ministers and central bankers from the world’s 20 largest economies only called on regulators to “continue their monitoring of crypto-assets” and stopped short of any specific action to regulate cryptocurrencies. So Bitcoin rose 2% over the past seven days, Ripple XRP fell 8.93%and Ethereum fell 14.20%. Crypto currencies remain highly speculative. I am still working on my more detailed post, as the ground keeps shifting.
Gold prices enjoyed one of their best weeks in more than a month buoyed by a flight-to-safety as investors opted for a safe-haven thanks to the events we have discussed. However, the futures data shows many traders continued to slash their bullish bets on gold. So it may not go much higher. So there may be no relief here.
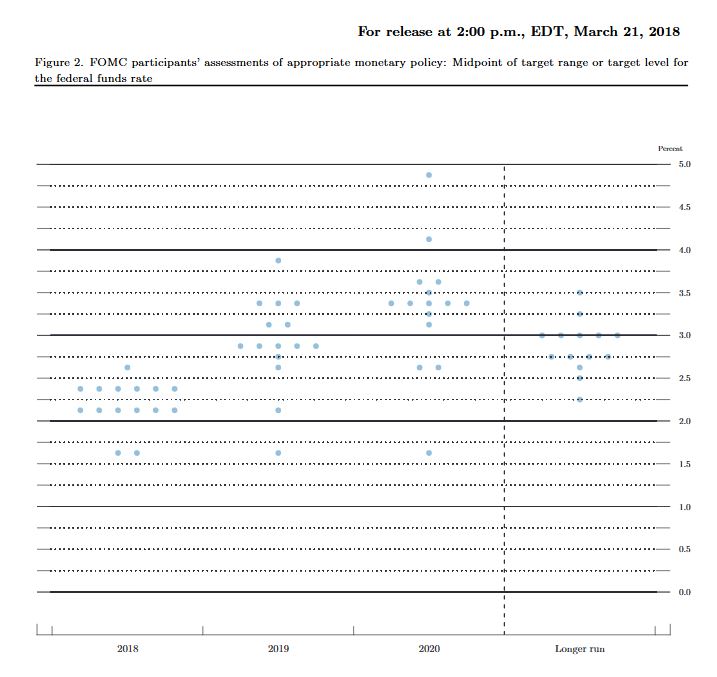
Then there was the Federal Reserve statement, which despite hiking rates by 0.25%, failed to add a fourth rate hike to its monetary policy projections and also scaled back its labour market expectations. Some argued that the Fed’s decision to raise its growth rate but keep its outlook on inflation relatively unchanged was dovish. Growth is expected to run at 3%, but core inflation is forecast for 2019 and 2020 at 2.10%. They did, however, signal a faster pace of monetary policy tightening, upping its outlook on rates for both 2019 and 2020. You can watch our separate video blog on this. The “dots” chart also shows more to come, up to 8 lifts over two years, which would take the Fed rate to above 3%. The supporting data shows the economy is running “hot” and inflation is expected to rise further. This will have global impact. The era of low interest rates in ending. The QE experiment is also over, but the debt legacy will last a generation.
All this will have a significant impact on rates in the financial markets, putting more pressure on borrowing companies in the US, and the costs of Government debt. US mortgage interest rates rose again, a precursor to higher rates down the track.
Moodys’ said this week, that the U.S.’ still relatively low personal savings rate questions how easily consumers will absorb recent and any forthcoming price hikes. Moreover, the recent slide by Moody’s industrial metals price index amid dollar exchange rate weakness hints of a levelling off of global business activity.
The flow on effect of rate rises is already hitting the local banks in Australia. To underscore that here is a plot of the A$ Bill/OIS Swap rate, a critical benchmark for bank funding. In fact, looking over the past month, the difference, or spread has grown by around 20 basis points, and is independent from any expectation of an RBA rate change. The BBSW is the reference point used to set interest rates on most business loans, and also flows through to personal lending rates and mortgages.
As a result, there is increasing margin pressure on the banks. In the round, you can assume a 10 basis point rise in the spread will translate to a one basis point loss of margin, unless banks reduce yields on deposit accounts, or lift mortgage rates. Individual banks ae placed differently, with ANZ most insulated, thanks to their recent capital initiatives, and Suncorp the most exposed.
In fact, Suncorp already announced that Variable Owner Occupier Principal and Interest rates will rise by 5 basis points. Variable Investor Principal and Interest rates will increase by 8 basis points, and Variable Interest Only rates increase go up by 12 basis points. In addition, their variable Small Business rates will increase by 15 basis points and their business Line of Credit rates will increase by 25 basis points. Expect more ahead from other lenders. The key takeaway is that funding costs in Australia are going up at a time when the RBA is stuck in neutral. It highlights how what happens with rates and in money markets overseas, and particularly in the US, can have repercussions here – repercussions that many are possibly unprepared for.
Locally, the latest Australian Bureau of Statistics showed that home prices to December 2017 fell in Sydney over the past quarter, along with Darwin. Other centres saw a rise, but the rotation is in hand. Overall, the price index for residential properties for the weighted average of the eight capital cities rose 1.0% in the December quarter 2017. The index rose 5.0% through the year to the December quarter 2017.
The capital city residential property price indexes rose in Melbourne (+2.6%), Perth (+1.1%), Brisbane (+0.9%), Hobart (+3.9%), Canberra (+1.7%) and Adelaide (+0.6%) and fell in Sydney (-0.1%) and Darwin (-1.5%). You can watch our separate video on this, where we also covered in more detail the January 2018 mortgage default data from Standard & Poor’s. It increased to 1.30% from 1.07% in December. No area was exempt from the increase with loans in arrears by more than 30 days increasing in January in every state and territory. Western Australia remains the home of the nation’s highest arrears, where loans in arrears more than 30 days rose to 2.44% in January from 2.08% in December, reaching a new record high. Conversely, New South Wales continues to have the lowest arrears among the more populous states at 0.98% in January. Moody’s is now expecting a 10% correction in some home prices this year.
According to latest figures released by the Australian Bureau of Statistics (ABS), the seasonally adjusted unemployment rate increased to 5.6 per cent and the labour force participation rate increased by less than 0.1 percentage points to 65.7 per cent. The number of persons employed increased by 18,000 in February 2018. So no hints of any wage rises soon, as it is generally held that 5% unemployment would lead to higher wages – though even then, I am less convinced.
The latest final auction clearance results from CoreLogic, published last Thursday showed the final auction clearance rate across the combined capital cities rose to 66 per cent across a total of 3,136 auctions last week; making it the second busiest week for auctions this year, compared with 63.3 per cent the previous week, and still well down from 74.1 per cent a year ago. Although Melbourne recorded its busiest week for auctions so far this year with a total of 1,653 homes taken to auction, the final auction clearance rate across the city fell to 68.7 per cent, down from the 70.8 per cent over the week prior. In Sydney, the final auction clearance rate increased to 64.8 per cent last week, from 62.2 per cent the week prior. Across the smaller auction markets, clearance rates improved in Brisbane, Perth and Tasmania, while Adelaide and Canberra both returned a lower success rate over the week. They say Geelong was the best performing non-capital city region last week, with 86.1 per cent of the 56 auctions successful. However, the Gold Coast region was host to the highest number of auctions (60). This week they are expecting a high 3,689 planned auctions today, so we will see where the numbers end up. I am still digging into the clearance rate question, and should be able to post on this soon. But remember that number, 3,689, because the baseline seems to shift when the results arrive.
As interest rates rise, in a flat income environment, we expect the problems in the property and mortgage sector to show, which is why our forward default projections are higher ahead. We will update that data again at the end of the month. Household Financial Confidence also drifted lower again as we reported. It fell to 94.6 in February, down from 95.1 the previous month. This is in stark contrast to improved levels of business confidence as some have reported. Our latest video blog covered the results.
Finally, The Royal Commission of course took a lot of air time this week, and I did a separate piece on the outcomes yesterday, so I won’t repeat myself. But suffice it to say, we think the volume of unsuitable mortgage loans out there is clearly higher than the lenders want to admit. Mortgage Broking will also get a shake out as we discussed on the ABC this week. And that’s before they touch on the wealth management sector!
We think there are a broader range of challenges for bankers, and their customers, as I discussed at the Customer Owned Banking Association conference this week. There is a separate video available, in which you can hear about what the future of banking will look like and the importance of customer centricity. In short, more disruption ahead, but also significant opportunity, if you know where to look. I also make the point that ever more regulation is a poor substitute for the right cultural values. At the end of the day, a CEO’s overriding responsibility is to define the right cultural values for the organisation, and the major banks have been found wanting. A quest for profit at any cost will ultimately destroy a business if in the process it harms customers, and encourages fraud and deceit. You simply cannot assume banks will do the right thing, unless the underlying corporate values are set right. Remember Greenspans testimony after the GFC, when he said “I made a mistake in presuming that the self-interests of organisations, specifically banks and others, were such that they were best capable of protecting their own shareholders and their equity in the firms.”
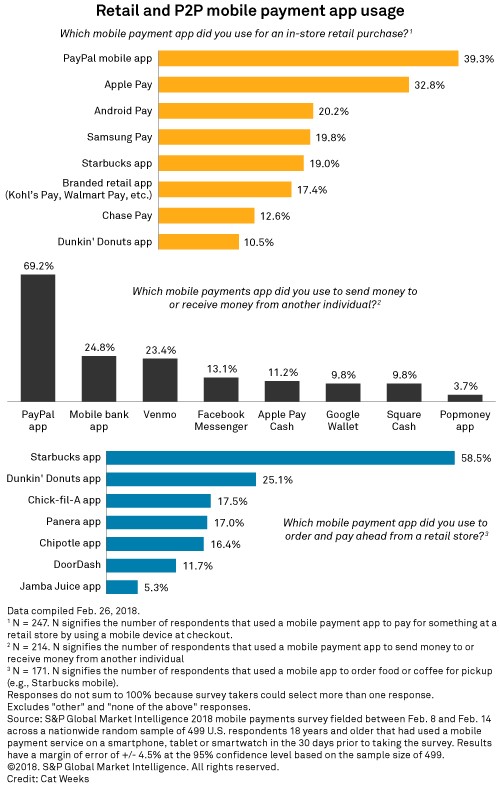
JPMorgan Chase & Co. has work to do if it wants Chase Pay to have the same kind of customer adoption as PayPal Holdings Inc.’s digital wallet, based on the results of a recent survey commissioned by S&P Global Market Intelligence.
About 39% of the individuals that used a mobile payment app to pay for an in-store retail purchase in the 30 days prior to taking the survey had used PayPal, versus 13% for Chase Pay.
This was one of several findings of the survey, which began with 904 respondents. Of those, 405 had not used a mobile payment app in the past 30 days, which gave us insight into why respondents would not want to use such services. The 499 that did use mobile payment services, meanwhile, yielded clues on what people do with their apps, such as the aforementioned in-store retail purchases.
Despite offering alternative services, Chase Pay recently partnered with PayPal, letting clients link their cards to their PayPal accounts through Chase Pay to access the PayPal wallet. This is not uncommon, as PayPal partners with other large banks and credit card issuers, such as Bank of America Corp. and Citigroup Inc., to link customer cards to their app. And as our survey data illustrated, respondents often used more than one wallet service.
PayPal also dominated in the survey question regarding person-to-person payments. Nearly 70% of those that had transferred money to an individual used PayPal, and the third most-used app was Venmo, which PayPal also owns.
Based on our survey, bank apps were slightly more popular than Venmo for person-to-person payments, with about 25% of respondents saying they had used a mobile bank app and about 23% saying they had used Venmo.
Markets are beginning to ask whether companies will be capable of passing on higher costs to the U.S.’ less than financially robust middle class, according to Moodys.
The U.S.’ still relatively low personal savings rate questions how easily consumers will absorb recent and any forthcoming price hikes. Moreover, the recent slide by Moody’s industrial metals price index amid dollar exchange rate weakness hints of a leveling off of global business activity.
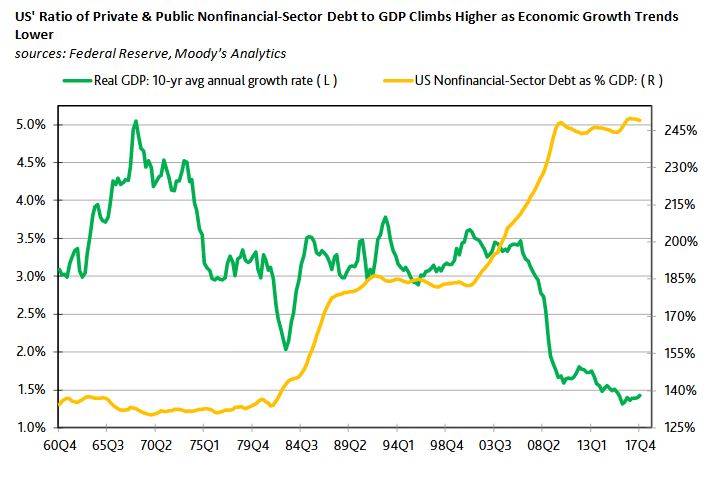
Missing from last week’s discussion of a record ratio of U.S. nonfinancial-corporate debt to GDP was any mention of 2017’s near-record high ratio of total U.S. private and public nonfinancial-sector debt relative to GDP. The yearlong averages of 2017 showed $49.05 trillion of total nonfinancial-sector debt and $19.74 trillion of nominal GDP that put nonfinancial-sector debt at 249% of GDP—or just a tad under 2016’s record 250%.
The leveraging up of the U.S. economy has coincided with a downshifting of U.S. economic growth. From 1961 through 1979, U.S. real GDP expanded by an astounding 3.9% annually, on average, while total nonfinancial-sector debt approximated 133% of nominal GDP. When real GDP’s average annual rate of growth eased to the 3.2% of 1979-2000, the ratio of nonfinancial-sector debt to GDP rose to 176%. Since the end of 2000, U.S. economic growth has averaged only 1.8% annually and, in a possible response to subpar growth, nonfinancial-sector debt has soared to 232% of GDP
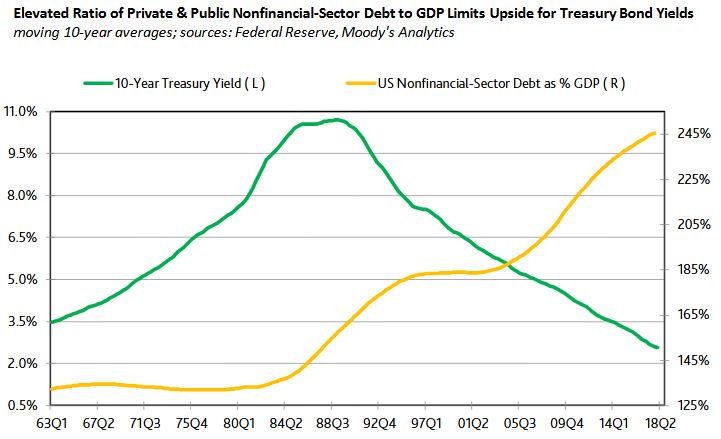
High Systemic Leverage Reins in Benchmark Yields
Over time, the record shows that the climb by the moving 10-year ratio of nonfinancial-sector debt to GDP has been accompanied by a declining 10-year moving average for the 10-year Treasury yield. For example, as the moving 10-year ratio of debt to GDP rose from 1997’s 183% to 2017’s 245%, the 10-year Treasury yield’s moving 10-year average fell from 7.31% to 2.59%.
Two factors may be at work. First, lower interest rates encourage an increase in balance-sheet leverage. Second, to the degree an elevated ratio of debt to GDP heightens the economy’s sensitivity to an increase in interest rates, lofty readings for leverage limit the upside for interest rates. Moreover, as shown by the historical record, if higher leverage tends to occur amid a slower underlying pace of economic growth, then the case favoring relatively low interest rates amid high leverage is strengthened.
None of this dismisses the possibility of an extended stay above 3% by the 10-year Treasury yield. Instead, today’s record ratio of debt to GDP warns of greater downside risk for business activity whenever interest rates enter into a protracted climb.
Trump has fired the next shot in the Trade Wars, announcing $64 billion of measures targetting China. But the measures seem somewhat calibrated, and there is some wriggle room.
US President Donald Trump has signed a presidential memorandum that could impose tariffs on up to $US50 billion ($64 billion) of imports from China, although his action was far removed from the threats that could have ignited a global trade war.
Under the terms of the memorandum, Mr Trump will target the Chinese imports only after a consultation period, a measure that will give industry lobbyists and legislators a chance to water down a proposed target list which runs to 1,300 products.
China will also have space to respond to Mr Trump’s actions, reducing the risk of immediate dramatic retaliation from Beijing, and Mr Trump struck an emollient tone as he started speaking, saying “I view them as a friend”.
Alleged intellectual property law breaches by China will also be pursued through the WTO.
The US markets have fallen sharply, down nearly 3%.
The volatility index is kicking higher, though still below the 30+ level we hit in February.
The Fed lifted, as expected. The “dots” chart also shows more to come. The supporting data shows the economic is running “hot” and inflation is expected to rise further. This will have global impact. The era of low interest rates in ending. The QE experiment is also over, but the debt legacy will last a generation.
This chart is based on policymakers’ assessments of appropriate monetary policy, which, by definition, is the future path of policy that each participant deems most likely to foster outcomes for economic activity and inflation that best satisfy his or her interpretation of the Federal Reserve’s dual objectives of maximum employment and stable prices.
Each shaded circle indicates the value (rounded to the nearest ⅛ percentage point) of an individual participant’s judgment of the midpoint of the appropriate target range for the federal funds rate or the appropriate target level for the federal funds rate at the end of the specified calendar year or over the longer run.
Information received since the Federal Open Market Committee met in January indicates that the labor market has continued to strengthen and that economic activity has been rising at a moderate rate. Job gains have been strong in recent months, and the unemployment rate has stayed low. Recent data suggest that growth rates of household spending and business fixed investment have moderated from their strong fourth-quarter readings. On a 12-month basis, both overall inflation and inflation for items other than food and energy have continued to run below 2 percent. Market-based measures of inflation compensation have increased in recent months but remain low; survey-based measures of longer-term inflation expectations are little changed, on balance.
Consistent with its statutory mandate, the Committee seeks to foster maximum employment and price stability. The economic outlook has strengthened in recent months. The Committee expects that, with further gradual adjustments in the stance of monetary policy, economic activity will expand at a moderate pace in the medium term and labor market conditions will remain strong. Inflation on a 12-month basis is expected to move up in coming months and to stabilize around the Committee’s 2 percent objective over the medium term. Near-term risks to the economic outlook appear roughly balanced, but the Committee is monitoring inflation developments closely.
In view of realized and expected labor market conditions and inflation, the Committee decided to raise the target range for the federal funds rate to 1-1/2 to 1-3/4 percent. The stance of monetary policy remains accommodative, thereby supporting strong labor market conditions and a sustained return to 2 percent inflation.
In determining the timing and size of future adjustments to the target range for the federal funds rate, the Committee will assess realized and expected economic conditions relative to its objectives of maximum employment and 2 percent inflation. This assessment will take into account a wide range of information, including measures of labor market conditions, indicators of inflation pressures and inflation expectations, and readings on financial and international developments. The Committee will carefully monitor actual and expected inflation developments relative to its symmetric inflation goal. The Committee expects that economic conditions will evolve in a manner that will warrant further gradual increases in the federal funds rate; the federal funds rate is likely to remain, for some time, below levels that are expected to prevail in the longer run. However, the actual path of the federal funds rate will depend on the economic outlook as informed by incoming data.
Voting for the FOMC monetary policy action were Jerome H. Powell, Chairman; William C. Dudley, Vice Chairman; Thomas I. Barkin; Raphael W. Bostic; Lael Brainard; Loretta J. Mester; Randal K. Quarles; and John C. Williams.
Strategically, the economic risks relating to the changing climate are one of the most significant challenges we face. But what are the potential long term impacts likely to be? In this Federal Reserve of St. Louis, on the economy blog, this important subject is explored.
We think there is a need for similar modelling to be done in Australia, as many of the most populated areas are most likely to be impacted.
How might climate change impact the economy over the long term? Some potential impacts include increased mortality, higher demand for electricity and reduced yields for certain crops.
At a recent Dialogue with the Fed presentation, William Emmons, lead economist with the St. Louis Fed’s Center for Household Financial Stability, highlighted research1 that identified geographic “winners and losers” on a county-by-county level across the United States.
Looking out to the year 2090, the findings showed that the St. Louis region could expect a significant impact on its economic activity, Emmons said.
“And if you zoom in and look at our region, [the researchers’] estimates are that we could lose the economic equivalent of 5 to 10 percent of GDP as a result of these effects,” he said, noting that impacts would be gradual.
Last Wednesday, the US Senate passed the Economic Growth, Regulatory Relief, and Consumer Protection Act. A key component of this bill increases the asset threshold for a bank to be designated a systemically important financial institution (SIFI) to $250 billion of total consolidated assets from $50 billion, the threshold defined in the Dodd-Frank Act of 2010.
For US banks with assets of less than $250 billion, the higher asset threshold for SIFI designation is likely to lead to a relaxation of risk governance and encourage more aggressive capital management, a credit-negative outcome.
SIFI banks are subject to the enhanced prudential standards of the US Federal Reserve (Fed). The regulatory oversight of SIFIs is greater than for other banks, and SIFIs participate in the Fed’s annual Dodd-Frank Act stress test (DFAST) and the Comprehensive Capital Analysis and Review (CCAR), which evaluate banks’ capital adequacy under stress scenarios. Furthermore, transparency will decline with fewer participants in the public comparative assessment the stress tests provide.
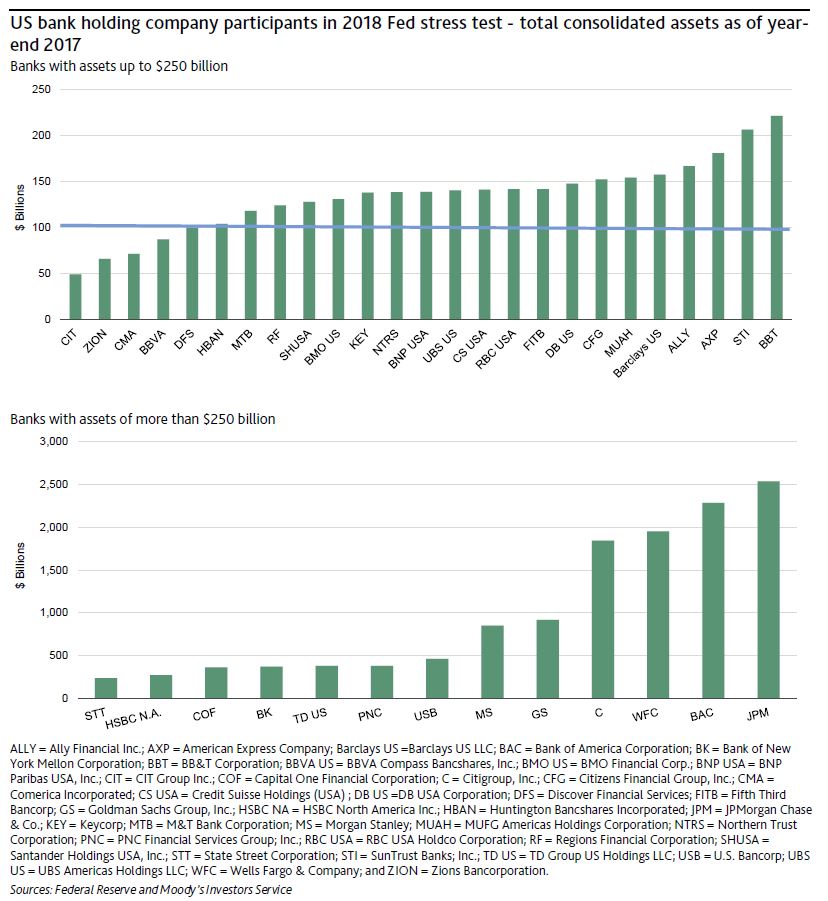
In 2018, the 38 bank holding companies shown in the exhibit below are subject to the Fed’s annual capital stress test. Passage of the bill into law would immediately exempt four banks with less than $100 billion of assets from the Fed’s enhanced prudential standards, which includes the stress test and living will requirements. These banks will have the most leeway in relaxing risk governance practices and managing their capital.
The 21 banks at the right of the top exhibit that have assets of $100-$250 billion1 could become exempt from enhanced prudential standards 18 months after passage of the bill into law. However, the Fed will have the authority to apply enhanced oversight to any bank holding company of this asset size and will still conduct periodic stress tests. In the 18 months after passage into law, it will be up to the Fed to develop a more tailored enhanced oversight regime for the $100-$250 billion asset group. The Fed also could continue to apply the same enhanced prudential standards. Therefore, it is difficult to assess the potential for their easier risk governance practices until more about the regulatory oversight is known.
If many of these banks are no longer required to participate in the public stress tests, it would reduce transparency. The quantitative results of DFAST and CCAR provide a relative rank ordering of stress capital resilience under a common set of assumptions. The loss of such transparency is credit negative.
For the largest banks, those with more than $250 billion in assets that remain SIFIs, there are no changes in the Fed’s supervision. The bill also specifies that foreign banking organizations with consolidated assets of $100 billion or more are still subject to enhanced prudential standards and intermediate holding company requirements.
In order to become law, the bill must also be passed by the US House of Representatives and signed by the president. This year’s annual Fed stress test will proceed as usual with submissions by the banks due 5 April, with results announced in June.
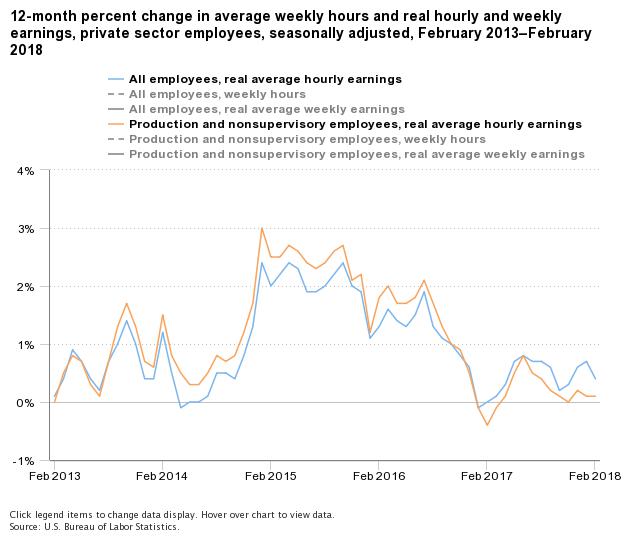
Data from the US Bureau of Labor Statistics shows from February 2017 to February 2018, real average hourly earnings increased 0.4 percent, seasonally adjusted. The increase in real average hourly earnings combined with a 0.3-percent increase in the average workweek resulted in a 0.6-percent increase in real average weekly earnings over the 12-month period.
Real average hourly earnings for production and nonsupervisory employees increased 0.2 percent from January to February, seasonally adjusted. This result stems from a 0.3-percent increase in average hourly earnings combined with a 0.1-percent increase in the Consumer Price Index for Urban Wage Earners and Clerical Workers.
Real average weekly earnings increased 0.8 percent over the month due to the increase in real average hourly earnings combined with a 0.6-percent increase in average weekly hours.
From February 2017 to February 2018, real average hourly earnings increased 0.1 percent, seasonally adjusted. The increase in real average hourly earnings combined with a 0.6-percent increase in the average workweek resulted in a 0.7-percent increase in real average weekly earnings over this period.
NOTE: Seasonally adjusted data are used for estimates of percent change from the same month a year ago for current and constant average hourly and weekly earnings. Special techniques are applied to the CES hours and earnings data in the seasonal adjustment process to mitigate the effect of certain calendar-related fluctuations. Thus, over-the-year changes of these hours and earnings are best measured using seasonally adjusted series. A discussion of the calendar-related fluctuations in the hours and earnings data and the special techniques to remove them is available in the February 2004 issue of Employment and Earnings or at www.bls.gov/ces/cesfltxt.htm.
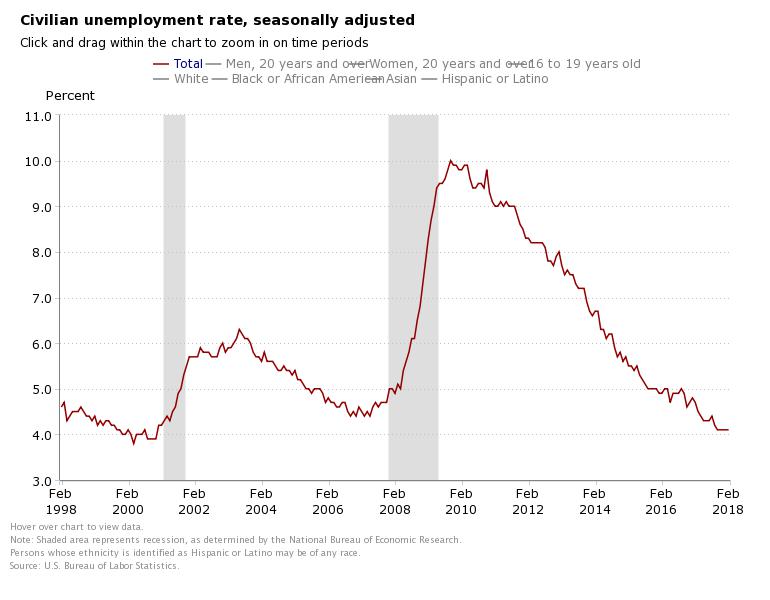
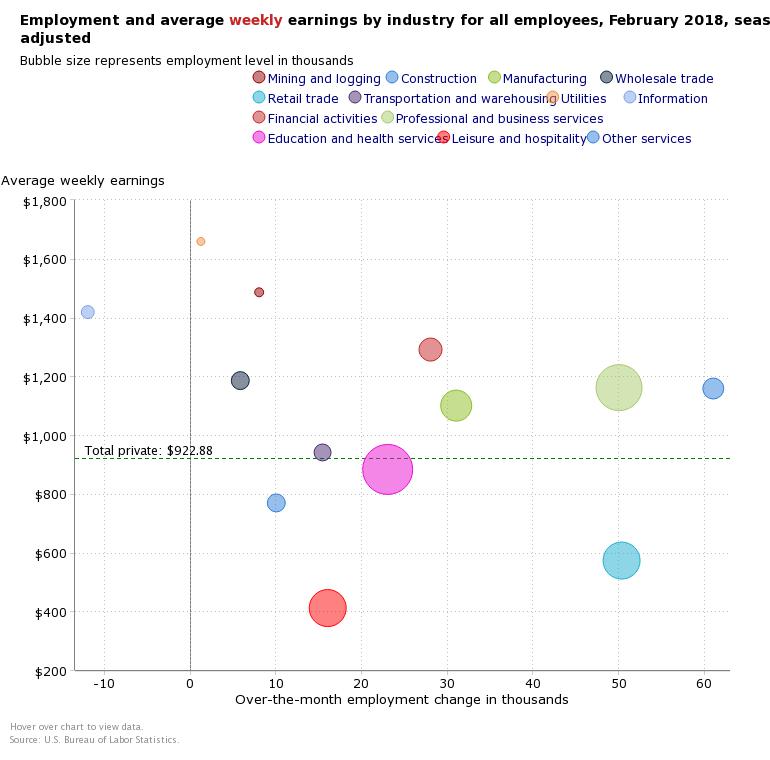
The latest data from the US Bureau of Labor Statistics for February 2018 shows that total nonfarm payroll employment increased by 313,000 in February, and the unemployment rate was unchanged at 4.1 percent. Employment rose in construction, retail trade, professional and business services, manufacturing, financial activities, and mining.
This is a strong result, and provides further support for potential rate rises this year. On the other hand, wage growth was a little more contained, alleviating concerns about rising inflation. In February, average hourly earnings for all employees on private nonfarm payrolls rose by 4 cents to $26.75, following a 7-cent gain in January. Over the year, average hourly earnings have increased by 68 cents, or 2.6 percent
The US markets reacted positively.
Here is the release:
Household Survey Data
In February, the unemployment rate was 4.1 percent for the fifth consecutive month, and the number of unemployed persons was essentially unchanged at 6.7 million.
Among the major worker groups, the unemployment rate for Blacks declined to 6.9 percent in February, while the jobless rates for adult men (3.7 percent), adult women (3.8 percent), teenagers (14.4 percent), Whites (3.7 percent), Asians (2.9 percent), and Hispanics (4.9 percent) showed little change.
The number of long-term unemployed (those jobless for 27 weeks or more) was essentially unchanged at 1.4 million in February and accounted for 20.7 percent of the unemployed. Over the year, the number of long-term unemployed was down by 369,000.
The civilian labor force rose by 806,000 in February. The labor force participation rate increased by 0.3 percentage point over the month to 63.0 percent but changed little over the year.
In February, total employment, as measured by the household survey, rose by 785,000. The employment-population ratio increased by 0.3 percentage point to 60.4 percent in February, following 4 months of little change.
The number of persons employed part time for economic reasons (sometimes referred to as involuntary part-time workers) was little changed at 5.2 million in February. These individuals, who would have preferred full-time employment, were working part time because their hours had been cut or because they were unable to find full-time
jobs.
In February, 1.6 million persons were marginally attached to the labor force, little different from a year earlier. (The data are not seasonally adjusted.) These individuals were not in the labor force, wanted and were available for work, and had looked for a job sometime in the prior 12 months. They were not counted as unemployed because they had not searched for work in the 4 weeks preceding the survey.
Among the marginally attached, there were 373,000 discouraged workers in February, down by 149,000 from a year earlier. (The data are not seasonally adjusted.) Discouraged workers are persons not currently looking for work because they believe no jobs are available for them. The remaining 1.2 million persons marginally attached to the labor force in February had not searched for work for reasons such as school attendance or family responsibilities.
Establishment Survey Data
Total nonfarm payroll employment rose by 313,000 in February. Job gains occurred in construction, retail trade, professional and business services, manufacturing, financial activities, and mining.
In February, construction employment increased by 61,000, with gains in specialty trade contractors (+38,000) and construction of buildings (+16,000). Construction has added 185,000 jobs over the past 4 months.
Retail trade employment increased by 50,000 over the month. Within the industry, employment rose in general merchandise stores (+18,000) and in clothing and clothing accessories stores (+15,000). However, over the past 4 months, which traditionally see the bulk of the holiday hiring and layoff, employment in these industries has changed little on net. Elsewhere in retail trade, building material and garden supply stores added jobs over the month (+10,000).
Employment in professional and business services increased by 50,000 in February and has risen by 495,000 over the year. Employment in temporary help services edged up over the month (+27,000).
Manufacturing added 31,000 jobs in February. Within the industry, employment rose in transportation equipment (+8,000), fabricated metal products (+6,000), machinery (+6,000), and primary metals (+4,000). Over the past year, manufacturing has added 224,000 jobs.
Financial activities added 28,000 jobs over the month, with gains in credit intermediation and related activities (+8,000); insurance carriers and related activities (+8,000); and securities, commodity contracts, and investments (+5,000). Over the year, financial activities has added 143,000 jobs.
Employment in mining rose by 9,000 in February, with most of the increase in support activities for mining (+7,000). Since a recent low in October 2016, mining has added 69,000 jobs.
Employment in health care continued to trend up in February (+19,000), with a gain of 9,000 in hospitals. Health care has added 290,000 jobs over the past year.
Employment in other major industries, including wholesale trade, transportation and warehousing, information, leisure and hospitality, and government, showed little change over the month.
The average workweek for all employees on private nonfarm payrolls rose by 0.1 hour to 34.5 hours in February. In manufacturing, the workweek increased by 0.2 hour to 41.0 hours, while overtime edged up by 0.1 hour to 3.6 hours. The average workweek for production and nonsupervisory employees on private nonfarm payrolls increased by 0.2 hour to 33.8 hours.
In February, average hourly earnings for all employees on private nonfarm payrolls rose by 4 cents to $26.75, following a 7-cent gain in January. Over the year, average hourly earnings have increased by 68 cents, or 2.6 percent. Average hourly earnings of private-sector production and nonsupervisory employees increased by 6 cents to $22.40 in February.
The change in total nonfarm payroll employment for December was revised up from +160,000 to +175,000, and the change for January was revised up from +200,000 to +239,000. With these revisions, employment gains in December and January combined were 54,000 more than previously reported. (Monthly revisions result from additional reports received from businesses and government agencies since the last published
estimates and from the recalculation of seasonal factors.) After revisions, job gains have averaged 242,000 over the last 3 months.