The Baby Boom and the U.S. Productivity Slowdown

From The St. Louis Fed On The Economy Blog.

The U.S. economy is currently experiencing a prolonged productivity slowdown, comparable to another slowdown during in the 1970s.

Economists have debated the causes for these slowdowns: The reasons range from the 1970s oil price shock to the 2007-08 financial crisis.

But did the baby boom generation partly cause both periods of slowing productivity growth?

A Demographic Shift

Guillaume Vandenbroucke, an economist at the St. Louis Fed, explored the role of the baby boom generation—specifically, those born in the period of 1946 to 1957 when the birth rate increased by 20 percent—in these slowdowns.

In a recent article in the Regional Economist, he pointed out a demographic shift: Many baby boomers began entering the labor market as young, inexperienced workers during the 1970s, and now they’ve begun retiring after becoming skilled, experienced workers.

“This hypothesis is not to say that the baby boom was entirely responsible for these two episodes of low productivity growth,” the author wrote. “Rather, it is to point out the mechanism through which the baby boom contributed to both.”

Productivity 101

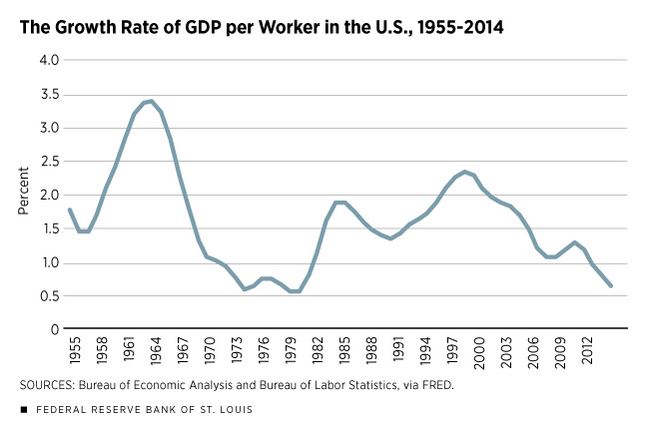
One measure of productivity is labor productivity, which can be measured as gross domestic product (GDP) per worker. By this measure, the growth of labor productivity was low in the 1970s. Between 1980 and 2000, this growth accelerated, but then has slowed since 2000.

“It is interesting to note that the current state of low labor productivity growth is comparable to that of the 1970s and that it results from a decline that started before the 2007 recession,” Vandenbroucke wrote.

How does a worker’s age affect an individual’s productivity? According to economic theory, young workers have relatively low human capital; as they grow older, they accumulate human capital, Vandenbroucke wrote.

“Human capital is what makes a worker productive: The more human capital, the more output a worker produces in a day’s work,” the author wrote.

The Demographic Link

Vandenbroucke gave an example of how this simple idea could affect overall productivity. His example looked at a world in which there are only young and old workers. Each young worker produces one unit of a good, while the older worker—who has more human capital—can produce two goods. If there were 50 young workers and 50 old workers in this simple economy, the total number of goods produced would be by 150, which gives labor productivity of 1.5 goods per worker.

Now, suppose the demographics changed, with this economy having 75 young workers and 25 old workers. Overall output would be only 125 goods. Therefore, labor productivity would be 1.25.

“Thus, the increased proportion of young workers reduces labor productivity as we measure it via output per worker,” he wrote. “The mechanism just described is exactly how the baby boom may have affected the growth rate of U.S. labor productivity.”

The Link between Boomers and Productivity Growth

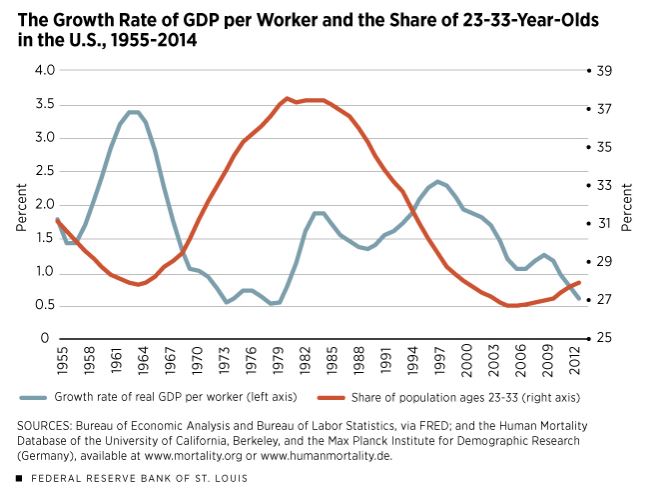
Vandenbroucke then compared the growth rate of GDP per worker (labor productivity) with the share of the population 23 to 33 years old, which he used as a proxy for young workers.

This measure of young workers began steadily increasing in the late 1960s before peaking circa 1980, which represented the time when baby boomers entered the labor force.

Looking at these variables from 1955 to 2014, he found the two lines move mostly in opposite directions (the share of young people growing as labor productivity growth declined) except in the 2000s.

(To see these trends, see the Regional Economist article, “Boomers Have Played a Role in Changes in Productivity.”)

“The correlation between the two lines is, indeed, –37 percent,” Vandenbroucke wrote.1

The share of the population who were 23 to 33 years old began to increase in the late 2000s, which can be viewed as the result of baby boomers retiring and making the working-age population younger.

“This trend is noticeably less pronounced, however, during the 2000s than it was during the 1970s,” the author wrote. “Thus, the mechanism discussed here is likely to be a stronger contributor to the 1970s slowdown than to the current one.”

Conclusion

If this theory is correct, it may be that the productivity of individual workers did not change at all during the 1970s, but that the change in the composition of the workforce caused the productivity slowdown, he wrote.

“In a way, therefore, there is nothing to be fixed via government programs,” Vandenbroucke wrote. “Productivity slows down because of the changing composition of the labor force, and that results from births that took place at least 20 years before.”

Notes and References

1 A correlation of 100 percent means a perfect positive relationship, zero percent means no relationship and -100 percent means a perfect negative relationship.

Why Are Banks Shuttering Branches?

From The St. Louis Fed On The Economy Blog

On Feb. 6, the Wall Street Journal published a startling statistic: Between June 2016 and June 2017, more than 1,700 U.S. bank branches were closed, the largest 12-month decline on record.1

Structural Shift

That large drop, while surprising, is part of a trend in net branch closures that began in 2009. It follows a profound structural shift in the number and size of independent U.S. banking headquarters, or charters, over the past three decades.

In 1980, nearly 20,000 commercial banks and thrifts with more than 42,000 branches were operating in the nation. Since then, the number of bank and thrift headquarters has steadily declined.

The reasons for the decline in charters and branches are varied. Regarding charters, the passage of the Riegle-Neal Interstate Banking and Branching Efficiency Act in 1994 played a significant role in their decline. Banks operating in more than one state took advantage of the opportunity to consolidate individual state charters into one entity and convert the remaining banks into branches. Almost all states opted in to a provision in the law permitting interstate branching, which led to a steady increase in branches.

Trend Reversal

Even before the number of charters declined, however, the number of branches grew steadily throughout the 1980s, 1990s and early 2000s. It peaked in 2009, when the trend reversed, as seen in the figure below.

Since 2009, the number of commercial bank and thrift branches has shrunk nearly 10 percent, or just over 1 percent per year.

The initial wave of closings can be attributed to a wave of mergers and failed bank acquisitions following the financial crisis. There was an immediate opportunity to reduce cost through the shuttering of inefficient office locations. Branch closings were also influenced by earnings pressure from low interest rates and rising regulatory costs.

More recently, changing consumer preferences and improvements in financial technology have further spurred the reduction in branches. Customers increasingly use ATMs, online banking and mobile apps to conduct routine banking business, meaning banks can close less profitable branches without sacrificing market share.

Uneven Changes

The reduction in offices has not been uniform. According to the Federal Deposit Insurance Corp., less than one-fifth of banks reported a net decline in offices between 2012 and 2017, and slightly more than one-fifth reported an increase in offices.

Just 15 percent of community banks reported branch office closures between 2012 and 2017. And though closures outnumber them, new branches continue to be opened. It’s also important to note that deposits continue to grow—especially at community banks—even as the number of institutions and branches decline.

The Industry of the Future

It seems inevitable that this long-term trend in branch closings will continue as consumer preferences evolve and financial technology becomes further ingrained in credit and payment services.

Although it is unlikely that the U.S. will end up resembling other countries with relatively few bank charters, it seems certain that consumers and businesses will increasingly access services with technology, no matter the size or location of bank offices. This change creates opportunities as well as operational risks that will need to be managed by banks and regulators alike.

US Mortgage Rates Continue To Climb

Mortgage rates continued higher following the release of the Minutes from the Federal Reserve’s (aka “The Fed”) most recent policy meeting.

The Fed was slightly more upbeat than markets expected, saying that most members agreed that a stronger economy increased the likelihood of further rate hikes.  Although the Fed Funds Rate doesn’t directly dictate mortgage rates, there is plenty of long-term correlation.  Because the Fed only meets 8 times a year to adjust rates (and rarely adjusts rates on all 8 occasions), bond markets (which include mortgage rates) are constantly adjusting to what the Fed will probably do in the future.


Of course, it could be argued that both the Fed AND financial markets are simply adjusting to the state of the economy, inflation, etc., but that’s more of a philosophical discussion (chicken vs egg type stuff).  What’s important is that financial markets saw a reason for the recent trend in rates to continue.  Unfortunately, today that meant rates moved to their highest levels in more than 4 years.  For what it’s worth, today’s rates are only microscopically higher than last week’s highs.

US Debt Will Grow, But It’s Mostly Government Borrowing

Moody’s says a possible $975 billion increase in U.S. government debt for fiscal 2018 would leave Q3-2018’s outstanding federal debt up by 5.9% annually. As of Q3-2017, federal debt outstanding grew by $597
billion, or 3.8%, from a year earlier.

Into the indefinite future, federal debt is likely to materially outrun each of the other broad components of U.S. nonfinancial-sector debt. Because of non-federal debt’s relatively slow growth, the private and public debt of the U.S.’ nonfinancial sectors may grow no faster than 4.3% annually during the year ended Q3-2018 to a record $50.77 trillion. For the year-ended Q3-2017, this most comprehensive estimate of U.S. nonfinancial-sector debt rose by 3.8% to $48.64 trillion.

Though expectations of faster growth for total nonfinancial-sector debt complements forecasts of higher short- and long-term interest rates for 2018, the quickening of total nonfinancial-sector debt growth may not be enough to sustain the 10-year Treasury yield above the 2.85% average that the Blue Chip consensus recently predicted for 2018.

The projected growth of nonfinancial-sector debt looks manageable from a historical perspective. For one thing, 2018’s projected percent increase by debt lags far behind the 9.1% average annual advance by U.S. nonfinancial sector debt from the five-years-ended 2007. Back then, unsustainably rapid growth for total nonfinancial-sector debt and 2003-2007’s 2.1% annualized rate of core PCE price index inflation supplied a 4.4% average for the 10-year Treasury yield of the five-years-ended 2007. By contrast, the 10-year Treasury yield’s moving five-year average sagged to 2.2% during the span-ended September 2017 as the accompanying five-year average annualized growth rates descended to 4.4% for nonfinancial-sector debt and 1.5% for core PCE price index inflation.

Westpac Says The Fed May Lift Rates Faster And Higher Than Markets Currently Expect

From Business Insider.

Now here’s an interesting paragraph from the minutes of the US Federal Reserve’s January FOMC meeting released on Wednesday.

Many participants noted that financial conditions had eased significantly over the intermeeting period; these participants generally viewed the economic effects of the decline in the dollar and the rise in equity prices as more than offsetting the effects of the increase in nominal Treasury yields.

So we know the question you’re asking — what are “financial conditions” and why is this interesting?

According to the St Louis Fed, financial conditions indices “summarise different financial indicators and, because they measure financial stress, can serve as a barometer of the health of financial markets”.

Using short and long-term bond yields, credit spreads, the value of the US dollar and stock market valuations, it attempts to measure the degree of stress in financial markets.

What the minutes conveyed in January was despite a lift in longer-dated bond yields, strength in stocks and decline in the US dollar suggest that financial conditions still improved.

So why is that important?

According to Elliot Clarke, economist at Westpac, it suggests the Fed may need to hike rates more aggressively than markets currently anticipate.

“That financial conditions have eased at a time when the FOMC is tightening policy will grant confidence that downside risks associated with further gradual rate increases and quantitative tightening are negligible,” he says.

“More to the point, this implies that risks to the FOMC rate view, and Westpac’s, are arguably to the upside.”

Adding to those risks, and even with the correction in US stocks seen after the January FOMC meeting was held, Elliot says in February “we have seen a further significant increase in government spending and signs of stronger wages”.

He also says the stronger-than-expected consumer price inflation in January — also released after the FOMC meeting was held — “will have also given the FOMC greater cause for confidence that inflation disappointment is behind them and that the risks are instead skewed to inflation at or moderately above target”.

As such, Elliot says the tone of the January minutes points to gradual rate rises from the Fed, mirroring what was seen last year.

However, the risk to this view, he says, is for more and faster hikes in the years ahead.

“In these circumstances, a continued ‘gradual’ increase in the fed funds rate through 2018 and 2019 — implying five hikes in total — is still the best base case,” he says.

“However, a careful eye will need to remain on financial conditions.

“Should they continue to move in the opposite direction to policy, a more concerted effort by the FOMC may prove necessary to keep the economy on an even footing.”

US Inflation Up 0.5% In January

More evidence of inflation lurking in the US economy, as the headline rate for January was higher than expected. This gives more support to the view the FED will indeed lift interest rates.

The Consumer Price Index for All Urban Consumers (CPI-U) increased 0.5 percent in January on a seasonally adjusted basis, the U.S. Bureau of Labor Statistics reported today. Over the last 12 months, the all items index rose 2.1 percent before seasonal adjustment.

The seasonally adjusted increase in the all items index was broad-based, with increases in the indexes for gasoline, shelter, apparel, medical care, and food all contributing. The energy index rose 3.0 percent in January, with the increase in the gasoline index more than offsetting declines in other energy component indexes. The food index rose 0.2 percent with the indexes for food at home and food away from home both rising.

The index for all items less food and energy increased 0.3 percent in January. Along with shelter, apparel, and medical care, the indexes for motor vehicle insurance, personal care, and used cars and trucks also rose in January. The indexes for airline fares and new vehicles were among those that declined over the month.

The all items index rose 2.1 percent for the 12 months ending January, the same increase as for the 12 months ending December. The index for all items less food and energy rose 1.8 percent over the past year, while the energy index increased 5.5 percent and the food index advanced 1.7 percent.

This Is Why Markets Have Gotten Jumpy

Back in April 2017, the IMF released a Financial Stability Report update which said that “in the United States, if the anticipated tax reforms and deregulation deliver paths for growth and debt that are less benign than expected, risk premiums and volatility could rise sharply, undermining financial stability”.

They said that more than 20% of US firms would find it hard to service their debts, if rates rose – and yes, now rates are rising! This puts pressure on companies, and on their banks.  This is no “flash crash”, it’s structural!

Under a scenario of rising global risk premiums, higher leverage could have negative stability consequences. In such a scenario, the assets of firms with particularly low debt service capacity could rise to nearly $4 trillion, or almost a quarter of corporate assets considered.

The number of US firms with very low interest coverage ratios—a common signal of distress—is already high: currently, firms accounting for 10 percent of corporate assets appear unable to meet interest expenses out of current earnings (Panel 5).


This figure doubles to 20 percent of corporate assets when considering firms that have slightly higher earnings cover for interest payments, and rises to 22 percent under the assumed interest rate rise. The stark rise in the number of challenged firms has been mostly concentrated in the energy sector, partly as a result of oil price volatility over the past few years. But the proportion of challenged firms has broadened across such other industries as real estate and utilities. Together, these three industries currently account for about half of firms struggling to meet debt service obligations and higher borrowing costs (Panel 6).

Volatility Rules

The latest print of the VIX or fear index highlights the switch in sentiment over the past week.

Given the ongoing gyrations in the major markets, (US down more than 4% today) it appears that the explanation of the correction as a flash crash thanks to programme trading is too simplistic.

This is going to play out over weeks and months, and it is all about interest rate hikes.

The Bank of England inflation statement over night also underscored rates are on the up, though they kept the rate at 0.5% and movements will be gradual

Any future increases in Bank Rate are expected to be at a gradual pace and to a limited extent. The Committee will monitor closely the incoming evidence on the evolving economic outlook, and stands ready to respond to developments as they unfold to ensure a sustainable return of inflation to the 2% target.

The US T10 Bond Yields are still elevated, and signals higher rates ahead.

The latest data from the US Bureau of Labor  signals more economic momentum, and supports the rate rise thesis.

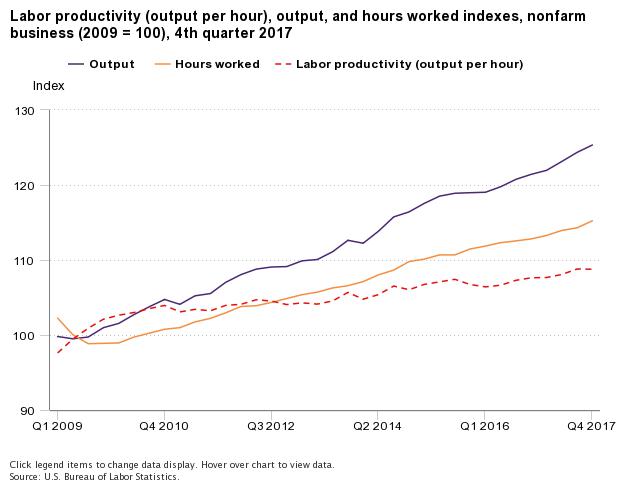
From the fourth quarter of 2016 to the fourth quarter of 2017, nonfarm business sector labor productivity increased 1.1 percent, reflecting a 3.2-percent increase in output and a 2.1-percent increase in hours worked. Annual average productivity increased 1.2 percent from 2016 to 2017.

See my comments from earlier in the week:


US Mortgage Rates Continue Higher Again

From Mortgage Rates Newsletter.

If you thought yesterday was bad for mortgage rates, you’re probably not going to be a big fan of today either.  And since today is the end of a week, we could similarly say you won’t like this week if you didn’t like the previous example.  That’s been true all year so far.  And hey!  Those week’s add up to a month (we’ll give yesterday and today a pass and consider them to be in the first month of 2018) so we can also say if you didn’t like the last month of 2017, you’re really going to hate the first month of 2018.

So what’s going on?  Nothing outside the ordinary.  The only problem is that “the ordinary” has involved bond market participants looking for almost every opportunity to sell bonds, thus pushing rates higher.  Today’s focal point was the big jobs report in the morning.  This data traditionally packs a big punch but it hasn’t been a big market mover recently.  That appeared to change today, but the rate spike had more to do with the fact that traders were intent on pushing rates higher anyway and simply waiting to make sure the jobs data didn’t throw a wrench in the works.  Granted, there was no way to know this would happen before it happened, but in any event, our default stance has been to assume rates will continue higher until they give us clear evidence to the contrary.  Needless to say, we’re nowhere close to amassing any such evidence after days like today.

Rates are now officially at the highest levels in more than 4 years.  The average lender is in the mid 4 percent range when it comes to quoting conventional 30yr fixed rates for well-qualified borrowers.

Federal Reserve restricts Wells’ growth

Responding to recent and widespread consumer abuses and other compliance breakdowns by Wells Fargo, the Federal Reserve Board on Friday announced that it would restrict the growth of the firm until it sufficiently improves its governance and controls. Concurrently with the Board’s action, Wells Fargo will replace three current board members by April and a fourth board member by the end of the year.

In addition to the growth restriction, the Board’s consent cease and desist order with Wells Fargo requires the firm to improve its governance and risk management processes, including strengthening the effectiveness of oversight by its board of directors. Until the firm makes sufficient improvements, it will be restricted from growing any larger than its total asset size as of the end of 2017. The Board required each current director to sign the cease and desist order.

“We cannot tolerate pervasive and persistent misconduct at any bank and the consumers harmed by Wells Fargo expect that robust and comprehensive reforms will be put in place to make certain that the abuses do not occur again,” Chair Janet L. Yellen said. “The enforcement action we are taking today will ensure that Wells Fargo will not expand until it is able to do so safely and with the protections needed to manage all of its risks and protect its customers.”

In recent years, Wells Fargo pursued a business strategy that prioritized its overall growth without ensuring appropriate management of all key risks. The firm did not have an effective firm-wide risk management framework in place that covered all key risks. This prevented the proper escalation of serious compliance breakdowns to the board of directors.

The Board’s action will restrict Wells Fargo’s growth until its governance and risk management sufficiently improves but will not require the firm to cease current activities, including accepting customer deposits or making consumer loans.

Emphasizing the need for improved director oversight of the firm, the Board has sent letters to each current Wells Fargo board member confirming that the firm’s board of directors, during the period of compliance breakdowns, did not meet supervisory expectations. Letters were also sent to former Chairman and Chief Executive Officer John Stumpf and past lead independent director Stephen Sanger stating that their performance in those roles, in particular, did not meet the Federal Reserve’s expectations.