FED Holds Rate This Month

The FED held their benchmark rate today, whilst still leaving the door open for rises later.

Information received since the Federal Open Market Committee met in December indicates that the labor market has continued to strengthen and that economic activity has continued to expand at a moderate pace. Job gains remained solid and the unemployment rate stayed near its recent low. Household spending has continued to rise moderately while business fixed investment has remained soft. Measures of consumer and business sentiment have improved of late. Inflation increased in recent quarters but is still below the Committee’s 2 percent longer-run objective. Market-based measures of inflation compensation remain low; most survey-based measures of longer-term inflation expectations are little changed, on balance.

Consistent with its statutory mandate, the Committee seeks to foster maximum employment and price stability. The Committee expects that, with gradual adjustments in the stance of monetary policy, economic activity will expand at a moderate pace, labor market conditions will strengthen somewhat further, and inflation will rise to 2 percent over the medium term. Near-term risks to the economic outlook appear roughly balanced. The Committee continues to closely monitor inflation indicators and global economic and financial developments.

In view of realized and expected labor market conditions and inflation, the Committee decided to maintain the target range for the federal funds rate at 1/2 to 3/4 percent. The stance of monetary policy remains accommodative, thereby supporting some further strengthening in labor market conditions and a return to 2 percent inflation.

In determining the timing and size of future adjustments to the target range for the federal funds rate, the Committee will assess realized and expected economic conditions relative to its objectives of maximum employment and 2 percent inflation. This assessment will take into account a wide range of information, including measures of labor market conditions, indicators of inflation pressures and inflation expectations, and readings on financial and international developments. In light of the current shortfall of inflation from 2 percent, the Committee will carefully monitor actual and expected progress toward its inflation goal. The Committee expects that economic conditions will evolve in a manner that will warrant only gradual increases in the federal funds rate; the federal funds rate is likely to remain, for some time, below levels that are expected to prevail in the longer run. However, the actual path of the federal funds rate will depend on the economic outlook as informed by incoming data.

The Committee is maintaining its existing policy of reinvesting principal payments from its holdings of agency debt and agency mortgage-backed securities in agency mortgage-backed securities and of rolling over maturing Treasury securities at auction, and it anticipates doing so until normalization of the level of the federal funds rate is well under way. This policy, by keeping the Committee’s holdings of longer-term securities at sizable levels, should help maintain accommodative financial conditions.

The U.S. productivity slowdown since the Great Recession

From The US Bureau of Labor Statistics.

In the span of just six quarters between 2007 and 2009, nonfarm business output declined by $753 billion and 8.1 million jobs were lost. This period, known as the Great Recession, was the worst American recession since the Great Depression. The U.S. economy has been recovering from this historic decline for 7 years and is now in the midst of the one of the longest business cycles of the post–World War II (WWII) era. At this point, there are enough data for us to see how this business cycle is shaping up compared with past cycles, and we may ask, “How well, exactly, are we doing?” and “How much have we recovered, up to this point in this cycle?” The productivity measures published by the Bureau of Labor Statistics (BLS) are very useful in addressing these questions, because they make connections between important economic indicators, including output, employment, labor hours, worker compensation, and inflation. With regard to labor productivity itself, it has become clear that the United States is in one of its slowest-growth periods since the end of WWII.

This issue of Beyond the Numbers analyzes the historically slow U.S. labor productivity growth observed during the current business cycle and addresses the implications for the U.S. economy.

What is labor productivity?

Labor productivity is a measure of economic performance that compares the amount of goods and services produced (output) with the number of labor hours used in producing those goods and services. It is defined mathematically as real output per labor hour, and growth occurs when output increases faster than labor hours. Labor productivity growth can be estimated from the difference in growth rates between output and hours worked. For example, if output is rising by 3 percent and hours are rising by 2 percent, then labor productivity is growing by 1 percent.

Technological advances, greater investment in machinery and equipment by businesses, increases in worker skill and experience, and other improvements to production can all lead to labor productivity growth. The labor productivity measure encompasses the overall contribution of all of these advances over a given period. BLS publishes quarterly and annual series of labor productivity for major sectors of the U.S. economy beginning with data for 1947.

So, why is it important to measure productivity? This is because productivity growth has the potential to lead to improved living standards for those participating in an economy, in the form of higher income, greater leisure time, or a mixture of both. With gains in labor productivity, an economy is able to produce increasingly more goods and services for a given number of hours of work. These gains in efficiency make it possible for an economy to achieve growth in labor income, profits and capital gains of businesses, and public sector revenue. Moreover, as labor productivity grows, it may be possible for all of these factors to increase simultaneously, without gains in one coming at the cost of one of the others. Also, looked at another way, gains in labor productivity may allow for increased leisure time because, with higher productivity, an economy can produce the same amount of goods and services in fewer work hours and, in some cases, even produce more goods and services in fewer work hours.

However, if productivity fails to grow significantly—as has been the case in recent years—those participating in an economy are left with a level of goods and services that fails to grow substantially, making it more difficult to attain widespread gains in income. It is thus important to track labor productivity, because it is the benchmark for potential gains in income of U.S. workers and shareholders.

How are we doing at this point in the current business cycle?

Now let us look at the productivity growth data of the current business cycle. Why are we looking at business cycles, you may be wondering? This is because, being based on the highly cyclical output and hours data, productivity data tend to possess a cyclical element. Thus, it makes sense to compare periods that take this feature of the data into account and that each contain one recession and one expansion. This approach allows for consistent and standardized comparisons of productivity trends through time.

During the current business cycle, which started in the fourth quarter of 2007, labor productivity has grown at an annualized rate of 1.1 percent. This growth rate is notably low compared with the rates of the 10 completed business cycles since 1947—only a brief six-quarter cycle during the early 1980s posted a cyclical growth rate that low (also increasing 1.1 percent). Of course, the current business cycle is not yet over, and its rate of growth is likely to change as more quarters of data are added. However, an analysis up to this point is warranted, given that this business cycle is now the fourth-longest cycle since 1947. In addition, comparing the current cycle with the completed cycles enables us to get a sense of the extent of the growth we will need to achieve during the remainder of this cycle in order to catch up to historical trends. Having this context will allow us to better gauge how well our economy is doing in the coming months and years.

The growth rates of labor productivity, output, and hours for all business cycles since 1947, including the average-cycle rates,5 are shown in chart 1. We see that the labor productivity growth rate (shown in red) for the current business cycle is the lowest productivity growth rate in the chart, sharing that distinction with a brief six-quarter cycle in the early 1980s which also had 1.1-percent growth. Also noteworthy is the output growth rate of the current cycle: at 1.4 percent, it is the second-lowest output growth rate of the historical period and well below the average-cycle output growth rate of 3.4 percent. Hours also had low growth, posting a 0.3-percent rate over the period, below its average-cycle rate of 1.1 percent.

While hours growth during the current business cycle was 0.8 percentage point below its business cycle average of 1.1 percent, output growth was 2.0 percentage points below its business cycle average of 3.4 percent. So, although both hours and output grew at below-average rates during this cycle, the fact that output grew notably slower than its historical average is what yields the historically low labor productivity growth rate of 1.1 percent.

Now let us look more deeply into the output and hours data and see how each has been moving during the current business cycle relative to its historical trend and how each of these series is reflected in the low labor productivity growth of this cycle.

Output growth in the current business cycle

The below-average rate of output growth in the current business cycle had contributions from both phases of the cycle: the Great Recession and the subsequent recovery. The Great Recession had the largest total decline in output of any recession in the post–WWII era (a 6.7-percent overall decline). Following that historic decline, the recovery has had the lowest output growth rate (2.6 percent per year) of any recovery since 1947. These two factors have combined to yield an output growth rate for this cycle (1.4 percent per year) that is very low by historical standards. Only the brief 1980 cycle had a lower rate, and all nine other cycles had growth rates of at least 2.5 percent, well above the output growth rate of the current cycle. (Compare the dark blue bars in chart 1.)

A key aspect of the recovery thus far is that, not only has output growth been well below historical trends, but it is even further behind the growth rates necessary to overcome the effect of the massive decline in output during the Great Recession. To counteract such a large decline and lift the current cycle’s growth rate back up to historical averages, output would have had to grow much faster than average during the recovery. But output has done the opposite thus far, growing more slowly than average during the recovery.

You may be wondering how large of an output growth rate during the recovery would have been required to lift this business cycle’s output growth back up to the long-term trend. The answer is that it would have taken a 5.5-percent growth rate up to this point in the current recovery to lift this cycle’s output growth rate up to the 3.7-percent long-term rate registered from 1947 to 2007. That 5.5-percent rate is 2.9 percentage points higher than the actual 2.6-percent growth rate of the recovery. We can also calculate the rate necessary to lift this cycle’s growth rate to that of the more recent trends. For example, to attain the 2.9-percent growth rate of the last business cycle—from the first quarter of 2001 to the fourth quarter of 2007—the current recovery would have needed a 4.5-percent output growth rate—1.9 percentage points higher than the growth rate posted thus far in this business cycle.

The gap between the current output series and historical trend rates can be seen in chart 2. The output series of the current business cycle is shown by the solid dark-blue line, and the dashed and dotted dark-blue lines show the trends in output for the entire historical period and the last business cycle. Comparing the current output series with the long-term output growth trend from 1947 to 2007 (the dashed dark-blue line), we can see that the current series lies well below this trend line and that the gap between the series has widened since the end of the recession. Put in dollar terms, the gap between the actual output and this hypothetical output if it had continued to follow the 1947-to-2007 output trend during this cycle is now more than $2.7 trillion, or over $22,900 in lost annual output per job in the nonfarm business sector. Comparing the current series with the trend rate from the previous business cycle (the dotted dark-blue line) also reveals that the output gap has widened since the end of the recession, although by less than the full historical trend indicates.

These historical comparisons make it clear that the shock to output growth which took place during the Great Recession has not been resolved. The fact that output growth has not risen above 3.2 percent in any single year since the recession underlines the fact that the higher-than-average growth rates which would be necessary for the U.S. economy to climb back to pre-recessionary trends have not been present during this recovery. At this point in the recovery, it would require a dramatic increase in output growth rates to resolve this situation.

Hours growth in the current business cycle

Just as with output growth, we can perform a long-term comparative analysis on the hours growth in the current business cycle. During the Great Recession, hours sustained an overall decline of 9.9 percent (or 19.4 billion labor hours) from the business cycle peak in the fourth quarter of 2007 until its subsequent low point in the third quarter of 2009. Following that decline, hours have grown during this recovery at an average annual rate of 1.9 percent. Chart 3 shows how hours have fared throughout this business cycle relative to historical trends. The first thing you might notice is that there is no gap in hours growth between this business cycle and the cycle that ran from the first quarter of 2001 to the fourth quarter of 2007. In fact—as can be seen by looking at the right side of the chart—hours growth in the current cycle (the solid light-blue line) has already surpassed that of the 2001–07 period (the dotted light-blue line). As of the third quarter of 2016, hours have grown during this business cycle at an annual rate of 0.3 percent, compared with 0.2-percent growth over the last cycle. The 1.9-percent hours growth rate during the current recovery was key to closing the gap in growth between this cycle and the last one.

You might also notice that the slope of the hours line of the current recovery is slightly steeper than the slope of the line representing the 1947-to-2007 trend (the dashed light-blue line). This relationship indicates that the current recovery’s hours growth has outpaced its long-term historical trend and has thus helped this business cycle’s growth rate begin to catch up to that long-term trend. However, a gap remains between the overall growth of the current cycle and hours growth over the long-term historical period. In order for the current-cycle hours growth to match the trend from 1947 to 2007, hours would have needed to grow 3.2 percent during the recovery thus far; this rate is 1.3 percentage points above the current-recovery rate of 1.9 percent. So, we can say that, although the hours growth rate up to this point in this business cycle is similar to the rate from the last cycle, hours have still grown at rates below the long-term historical trend.

Overall, hours have recovered much better than output, having fully caught up to the growth rate of the last business cycle and even having made some progress toward catching up to the long-term trend. Output, in contrast, is still far behind both its recent and its long-term trend, and has made no progress in catching up to those trends during its recovery, as is shown by the substantial gap in growth remaining as of the third quarter of 2016—a gap that is even larger than that existing at the end of the Great Recession. (See chart 2.)

Labor productivity growth in the current business cycle

Now let us look at how the growth in output and the growth in hours combine to yield the historically low labor productivity growth of the current business cycle. Chart 4 reveals that, through most of the Great Recession, labor productivity was relatively flat, as output and hours were declining simultaneously. However, as the recession was ending, productivity shot up when output stabilized while hours continued to fall. In fact, nearly half of the overall productivity growth during the current business cycle occurred in just the period from the fourth quarter of 2008 to the fourth quarter of 2009. The high productivity growth of that yearlong period comes from the fact that the largest overall output decline (–6.7 percent) since the Great Depression was surpassed by an even larger decline in hours worked (–9.9 percent). This example shows that, although productivity grows when output rises by a larger amount than hours, productivity also grows when output declines by a smaller amount than hours.

Following the spike in productivity which occurred in 2009, both output and hours grew at rates that were relatively similar to one another during the remainder of the recovery, resulting in the very low productivity growth seen during this period. Over the last 5 years shown in chart 4, labor productivity grew at an average rate of just 0.7 percent, with output growing 2.6 percent and hours growing 1.9 percent. The 0.7-percent labor productivity growth rate during these years is less than one-third the long-term rate of productivity growth of 2.3 percent posted from 1947 to 2007.

Just as we saw with output and hours, we can see how labor productivity has performed in the current business cycle relative to historical trends. Chart 5 shows labor productivity during this business cycle (the solid red line) compared with trends for the same historical periods that we used to analyze output and hours. Through most of the Great Recession, labor productivity lagged behind historical growth rates, but then it achieved above-average gains coming out of the recession and into the early quarters of the recovery. The U.S. economy actually caught up to the long-term historical trend (the dashed red line) in the fourth quarter of 2009, although it was still slightly behind the trend from the last cycle (the dotted red line) at that point. However, after 2010, productivity growth stagnated and a substantial deficit relative to historical trends developed over the next 5 years. By the third quarter of 2016, labor productivity in the current business cycle had grown at an average rate of just 1.1 percent, well below the long-term average rate of 2.3 percent from 1947 to 2007 and even further behind the 2.7-percent average rate over the cycle from 2001 to 2007.

Ultimately, the fact that labor hours have outpaced their historical trend during this recovery while output has fallen further behind its historical trend is what yields the low productivity of the current cycle. This combination is illustrated on the right side of chart 5, where the stagnation of labor productivity growth is plainly visible.

Dramatic gains in labor productivity growth would be required in coming years to counteract the stagnation of recent years and lift the series back up to the long-term historical trend. For example, it would require a constant productivity growth rate of 7.7 percent during each of the next 2 years in order to lift the labor productivity growth of the current cycle back up to the historical trend rate seen from 1947 to 2007. This rate of growth would be 7 times that of this business cycle thus far, and 11 times the rate experienced during the last 5 years.

Wage gap growth in the current business cycle

Sluggish productivity growth has implications for worker compensation. As stated earlier, real hourly compensation growth depends upon gains in labor productivity; thus, low labor productivity growth can limit potential gains for workers. During the current business cycle, real hourly compensation (the gold bars in chart 6) has increased 0.7 percent, which is low by historical standards. The rate is lower than the average real hourly compensation growth rate of 1.7 percent observed during other business cycles. The rate is also below the rates of all other cycles, except for a brief six-quarter cycle in the early 1980s. Note also that the low growth rate of the current business cycle is a near-continuation of the similarly low growth rate of the early-2000s cycle (0.8 percent).

There is, however, one interesting difference between the low real hourly compensation growth in the current business cycle and the low real hourly compensation growth in the last cycle. The “wage gap”—defined as the difference in the growth rates of labor productivity and real hourly compensation —for the current cycle is much smaller, at just 0.4 percent. (Compare the gray bars in chart 6.) In fact, the current U.S. business cycle is exhibiting the smallest wage gap since the 1960s. Note, however, that it has been the historically low productivity growth alone that has shrunk the wage gap in the current business cycle, as there were no improvements in real hourly compensation growth relative to the rates from recent cycles.

Looking forward

The historically low rate of labor productivity growth during the current business cycle has limited gains in living standards for Americans during this period. U.S. workers have had to work more hours in order to produce the current supply of goods and services than would have been the case with higher productivity growth. In addition, low productivity growth has limited potential gains in worker compensation and in shareholder profits; these income gains are ultimately dependent upon gains in goods and services produced per hour of work. Americans would be wise to pay attention to productivity trends in coming years, as these trends will figure prominently in our lives and in the lives of future generations.

The Trump effect on bond markets and trade

From Investor Daily.

The Australian bond market is likely to feel the effects of US President Donald Trump’s protectionist trade stance both directly and indirectly, writes Nikko Asset Management’s James Alexander.

The emergence of China is clearly of great importance to the economic fortunes of Australia, and as a result it may be tempting to downplay, or even overlook, President Trump’s agenda and its impact on Australia.

While our largest import and export partner is now China, Australia will still be impacted by US trade policy both directly and, perhaps more importantly, indirectly.

The difficulty for investors, however, is the general uncertainty around future US trade policy, and the impact the Trump administration will have on financial markets.

Uncertainty around trade

While most of President Trump’s comments so far have been directed at China and Mexico, we do know that he is not a fan of trade deals negotiated by others.

Trade deals he has criticised in which Australia has been involved include the Trans-Pacific Partnership (TPP), from which the US has just withdrawn, and the North American Free Trade Agreement (NAFTA).

The essential message here is that these are bad deals for the US, as opposed to future Trump-negotiated deals, which will of course be good for the US.

It is likely to be some time before we can reasonably assess the impact of changes to US trade policy with Australia directly, given their larger trade relationships are most certainly ahead of us in the queue.

This brings us to the indirect but significant impact of the US’ future trade relations with our biggest trading partner, China.

A tit-for-tat trade war is likely to be harmful to both the US and China, with Australia most certainly suffering some collateral damage.

It is too early to tell how this relationship will unfold but the early signs are not great, with President Trump taking every opportunity to criticise China.

These two economic heavyweights have plenty of tools to ‘penalise’ each other on trade, which could potentially hurt Australian trade in the process.

Rising bond yields

The other broad area where the impact of a Trump presidency is likely to be felt is in financial markets – more specifically, bond yields and foreign exchange rates.

Australia’s bond yields have historically been strongly correlated with US Treasury yields and this is likely to continue.

If the Trump agenda of lower taxes, increased infrastructure spending and more protectionist trade policy prove to be inflationary as we expect, US interest rates and bond yields are likely to be headed higher.

Australian bond yields will surely follow, as Commonwealth bond yields must remain globally competitive to ensure international investors continue to support our borrowing needs.

Another widely discussed by-product of Trump’s agenda is a stronger US dollar.

While the Australian dollar has fallen by around 2.5 per cent against the American currency, it has actually risen slightly on a trade-weighted basis since the presidential election in November.

This divergence, should it continue, will be one to watch carefully.

While a weaker Australian dollar would indeed help to counter any negative impact from higher bond yields, weakness that is mainly isolated to the US dollar is not nearly as helpful as weakness on a trade-weighted basis.

James Alexander is the co-head of global fixed income and head of Australian fixed income at Nikko Asset Management.

The Financing of Nonemployer Firms

From The St. Louis Fed Blog.

Nonemployer firms that applied for financing were more likely to operate at a loss, according to the recently released 2015 Small Business Credit Survey: Report on Nonemployer Firms.

This report, produced jointly by the Federal Reserve banks of St. Louis, Atlanta, Boston, Cleveland, New York, Philadelphia and Richmond, examined trends in businesses with no employees other than the owners. As the report noted, these businesses make up nearly 80 percent of all U.S. firms.

Applying for Financing

The report noted that 32 percent of survey respondents said they applied for financing in the previous 12 months. Among those who applied, the most common reason (66 percent) was to expand the business or to take advantage of a new opportunity. The next most common reason (38 percent) was to cover operating expenses. (Respondents could select multiple answers.)

Among those businesses that did not apply for financing, the top three reasons were:

  • Debt aversion (33 percent)
  • Already had sufficient financing (30 percent)
  • Believed they would be turned down (25 percent)

Profitability: Applicants vs. Nonapplicants

As the report noted: “Collectively, applicants were less profitable than the nonapplicants.” The figure below shows the difference.

profitability of small businesses that applied for financing

Financing Approval

Among firms that applied for financing, 41 percent were not approved for any of the funding they sought. The percentages of firms not receiving any funding grew smaller as firms grew larger: 48 percent of firms with less than $25,000 in revenue did not receive any funding, while only 28 percent of firms with revenues greater than $100,000 did not receive funding.

About 71 percent of firms received less financing than the amount sought. When asked about the primary impact of this financing shortfall, the top response (33 percent) said the firm had to delay expansion. Other top answers were that they used personal funds (22 percent), were unable to meet expenses (18 percent) and passed on business opportunities (13 percent).

Additional Resources

Real US GDP Drops in 4Q – Initial Estimate

US Real gross domestic product (GDP) increased at an annual rate of 1.9 percent in the fourth quarter of 2016 (table 1), according to the “advance” estimate released by the Bureau of Economic Analysis. In the third quarter, real GDP increased 3.5 percent.

The Bureau emphasized that the fourth-quarter advance estimate released today is based on source data that are incomplete or subject to further revision by the source agency. The “second” estimate for the fourth quarter, based on more complete data, will be released on February 28, 2017.

Real GDP: Percent Change from Preceding Quarter

The increase in real GDP in the fourth quarter reflected positive contributions from personal consumption expenditures (PCE), private inventory investment, residential fixed investment, nonresidential fixed investment, and state and local government spending that were partly offset by negative contributions from exports and federal government spending. Imports, which are a subtraction in the calculation of GDP, increased.

The deceleration in real GDP in the fourth quarter reflected a downturn in exports, an acceleration in imports, a deceleration in PCE, and a downturn in federal government spending that were partly offset by an upturn in residential fixed investment, an acceleration in private inventory investment, an upturn in state and local government spending, and an acceleration in nonresidential fixed investment.

Current-dollar GDP increased 4.0 percent, or $185.5 billion, in the fourth quarter to a level of $18,860.8 billion. In the third quarter, current dollar GDP increased 5.0 percent, or $225.2 billion.

The price index for gross domestic purchases increased 2.0 percent in the fourth quarter, compared with an increase of 1.5 percent in the third quarter (table 4). The PCE price index increased 2.2 percent, compared with an increase of 1.5 percent. Excluding food and energy prices, the PCE price index increased 1.3 percent, compared with an increase of 1.7 percent.

Personal Income

Current-dollar personal income increased $152.0 billion in the fourth quarter, compared with an increase of $172.3 billion in the third. The deceleration in personal income primarily reflected a deceleration in wages and salaries.

Disposable personal income increased $130.2 billion, or 3.7 percent, in the fourth quarter, compared with an increase of $141.5 billion, or 4.1 percent, in the third. Real disposable personal income increased 1.5 percent, compared with an increase of 2.6 percent.

Personal saving was $791.2 billion in the fourth quarter, compared with $818.1 billion in the third. The personal saving rate — personal saving as a percentage of disposable personal income — was 5.6 percent in the fourth quarter, compared with 5.8 percent in the third.

2016 GDP

Real GDP increased 1.6 percent in 2016 (that is, from the 2015 annual level to the 2016 annual level), compared with an increase of 2.6 percent in 2015.

The increase in real GDP in 2016 reflected positive contributions from PCE, residential fixed investment, state and local government spending, exports, and federal government spending that were partly offset by negative contributions from private inventory investment and nonresidential fixed investment. Imports, which are a subtraction in the calculation of GDP, increased.

The deceleration in real GDP from 2015 to 2016 reflected a downturn in private inventory investment, a deceleration in PCE, a downturn in nonresidential fixed investment, and decelerations in residential fixed investment and in state and local government spending that were offset by a deceleration in imports and accelerations in federal government spending and in exports.

Current-dollar GDP increased 2.9 percent, or $530.3 billion, in 2016 to a level of $18,566.9 billion, compared with an increase of 3.7 percent, or $643.5 billion, in 2015.

The price index for gross domestic purchases increased 1.0 percent in 2016, compared with an increase of 0.4 percent in 2015.

During 2016 (that is, measured from the fourth quarter of 2015 to the fourth quarter of 2016), real GDP increased 1.9 percent, the same rate as during 2015. The price index for gross domestic purchases increased 1.5 percent during 2016, compared with an increase of 0.4 percent during 2015.

Is Overvaluation Risk Real?

From Moody’s.

VIX Is Low, Overvaluation Risk Is Not

Overvaluation does not preclude an even higher market value of common stock relative to current and expected corporate earnings. Moreover, provided that the now extraordinarily low VIX index stays under 11.8, a further narrowing by corporate bond yield spreads is likely. However, an increasingly overvalued equity market favors a higher VIX index.

A convincing explanatory model for the high-yield bond spread employs measures of default risk and business activity, in addition to the VIX index. This model recently predicted a 411 bp midpoint for the high-yield spread, which eclipses its recent actual gap of 394 bp. By the way, the latter is the thinnest high-yield spread since September 2014.

What is now the lowest predicted midpoint since April 2015 owes much to an ultra-low VIX index. After removing the VIX index from the explanatory model, the predicted midpoint for the high-yield spread widens to 456 bp. (Figure 1.)

Record highs for stocks, not so for profits

For the first time ever, the blue-chip Dow Jones Industrial average broke above 20,000. Meanwhile, the market value of all US common stock as measured by the Wilshire Index set a new record high.

Nevertheless a popular measure of core profits, though improving, remains well under its apex. Since the moving yearlong estimate of pretax profits from current production peaked at the end of March 2015, the market value of US common stock has climbed higher by 10%. By contrast, the consensus estimates that for the year-ended March 2017, core pretax profits will still trail March 2015’s zenith by -5%. Moreover, the consensus does not expect yearlong profits to eclipse its record high until 2018’s second quarter.

As inferred from the different directions taken by share prices and profits since March 2015, the US equity market is richly priced, if not significantly overvalued. However, overvaluation does not promise impending doom for share prices.

For example, during 1998-2000’s stock market frenzy, though overvaluation first resembled today’s excesses in 1998’s second quarter, the market value of US common stock continued its ascent until March 2000 despite becoming increasingly overvalued. Amazingly, notwithstanding the accompanying -7% drop by yearlong profits from December 1997’s peak, the market value of US common stock managed to soar by a cumulative 49.5% from 1997’s final quarter through the first quarter of 2000.

Not surprisingly, March 2000’s unprecedented overvaluation of equities set the stage for a cumulative -43% plunge to October 2002’s bottom. Granted that today’s overvaluation falls considerably short of the excesses of late 1998 through early 2000, buying into an overvalued market necessarily entails above-average risk.

Based on the historical record, the current rally may not expire soon. Absent another extended bout of profits deflation, the US equity market is likely to set new records regardless of today’s overvaluation. For now, the consensus expects pretax operating profits to grow through 2018.
Interest rate risk now poses the biggest danger to stocks.

Nevertheless, substantially higher interest rates could temporarily drive the market value of US common stock down by at least -5%. Sharply higher interest rates previously outweighed the positive effect of profits growth and temporarily sank share prices in 1994 and late 1987. In both instances, deep declines by interest rates allowed profits to re-assume its leading role as the primary driver of equity valuation.

Incredibly, 1987’s outsized 19% annual advance by core profits was not enough to prevent a stock market crash of frightening severity. In late 1987, the market value of US common stock plunged by as much as -27% from its then record high largely because of a lift-off by the 10-year Treasury yield from a January 1987 average of 7.08% to the 10.36% of October 17, 1987.

In fact, it was at the morning of October 19, 1987’s infamous -18% daily plummet by the market value of US common stock that the benchmark Treasury yield was last above 10%. Who would have thought back then that 30 years later markets would fret over the possibility of a 3% benchmark Treasury yield?

Regarding 1994’s far less dramatic episode, a climb by the 10-year Treasury yield’s month-long average from October 1993’s 5.3% to April 1994’s 7.0% helped to sink the market value of common stock by -5.3% from its then record high despite an accompanying 19% annual advance by profits.

Do not underestimate the power of sharply higher benchmark interest rates to pummel share prices. The equity market sell-offs of both 1994 and 1987 occurred despite significant narrowings by medium- and low-grade bond yield spreads. Nor did the declining trends of high-yield defaults offset the selling pressure arising from fast rising Treasury yields.

As inferred from what occurred in 1987 and 1994, the 10-year Treasury yield may need to approach 3% for there to be at least a 50% likelihood of a 5% drop by equities amid profits growth. However, the record also makes clear that an especially disruptive ascent by benchmark yields is likely to be reversed. In order to stabilize share prices, the 10-year Treasury yield’s month-long average fell to 8.21% by February 1988 and to 5.65% by January 1996.

VIX Index stays low despite risks surrounding overvalued equities

Overvaluation warns of a painful correction in the event market sentiment worsens considerably. In recognition of ample downside risk, the VIX index has tended to be greater in richly priced equity markets, where above-trend VIX indexes have typically been joined by above-average corporate bond yield spreads. (Figure 2.)

In the current market, however, the VIX index has broken from the norm and remained unexpectedly low amid elevated ratios of equity’s market value to core profits. The market value of US common stock recently approximated 11.2-times the yearlong estimate for pretax profits from current production for the highest such ratio since the 11.5:1 of 2002’s second quarter. It was in 1998’s first quarter that common equity’s market value last climbed up to 11.2-times core profits. At that time, the VIX index averaged 21.3, which was far above its recent 10.8. Similarly, when the ratio of common equity’s market value to profits rose to Q4-2007’s previous cycle high of 10.3:1, the VIX index averaged a well above-trend 22.1. Thus, the longer elevated price-to-earnings ratios persist, the more likely is a climb by the VIX index that ordinarily is accompanied by wider corporate yield spreads.

On January 24, 2007 the VIX index closed at a record low 9.89. Ten years later the VIX index closed at the 10.83 of January 25, 2017. The latter was its lowest finish since the 10.32 of July 3, 2014, or when the high-yield bond spread was an exceptionally thin 322 bp. However, even that gap was wider than the 276 bp of January 24, 2007. Do not be surprised if an ultra-low VIX continues to lead the high-yield bond spread lower.

According to the historical statistical relationship, by itself, the recent VIX index of 10.9 predicts a 326 bp midpoint for the high-yield bond spread, which is much thinner than the recent 394 bp. As shown in Figure 3, exceptionally low readings for the VIX index have tended to prompt narrowings by the high-yield spread throughout the current business cycle upturn. (Figure 3.)


US Mortgage Rates Move Higher, Again

From Mortgage Rate Newsletter.

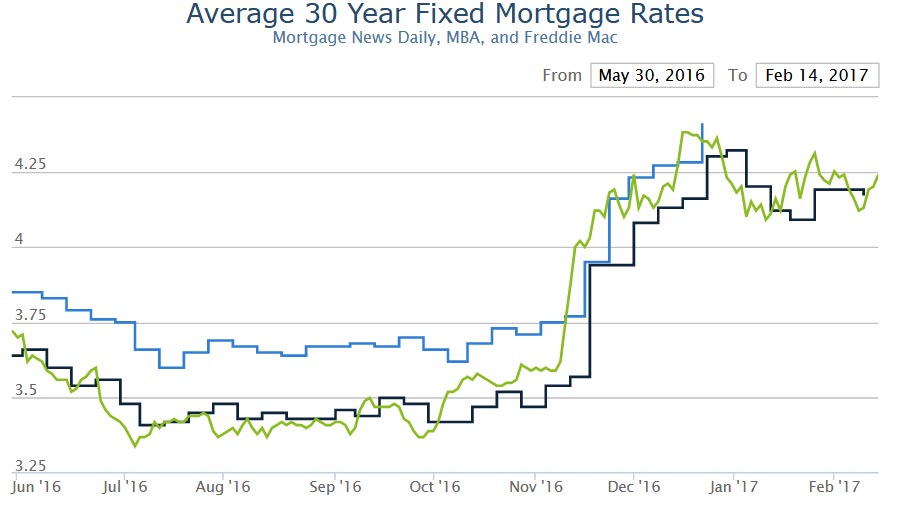
Mortgage rates moved higher for the 5th time in the past 6 business days.  The past 2 days have combined to bring rates a full .125% higher.  That’s the increment by which rates are most commonly divided (i.e. 4.0, 4.125%, 4.25%, etc.).  Under normal circumstances rates might move that much over 2 weeks as opposed to 2 days.  In fact, it happened twice in this most recent cycle (Jan 18/19, and Jan 24/25).  The only time we see rates moving any faster is during major blowouts like the weeks following the election or the 2013 taper tantrum.

The average lender is once-again quoting 4.25% on top tier conventional 30yr fixed scenarios.  This isn’t the first time we’ve seen 4.25% this year, but closing costs are slightly higher today.  That means effective rates are at 2017 highs.  Several lenders are already up to 4.375% and a scant few remain at 4.125%.

In the bigger picture, the recent weakness suggests a trend toward higher rates is taking shape after markets paused and corrected heading into mid-January.  This trend would have its most severe implications if rates break above mid-December’s highs, and it’s safest to assume that’s where we’re headed until/unless we see a big shift in the other direction.  Bottom line: early January was a nice break in the storm.  We knew the move toward lower rates would run out of steam at some point before retracing too many of the steps taken in late 2016.  The past few days increasingly confirm that break is over.

The Dow Crosses The 20,000 Rubicon

The Dow has now hit, and passed the 20,000 barrier.

It was supported by the lowest trading range in US history over the last month, and as a result the volatility index is also down.

Major shares, such as Goldman Sachs, JP Morgan, IBM and Boeing provided much of the action. The expectation of new business friendly policies, rising interest rates, and renewed economic activity are behind the moves. Not least traders hope the banks’ regulatory frameworks will be loosened.

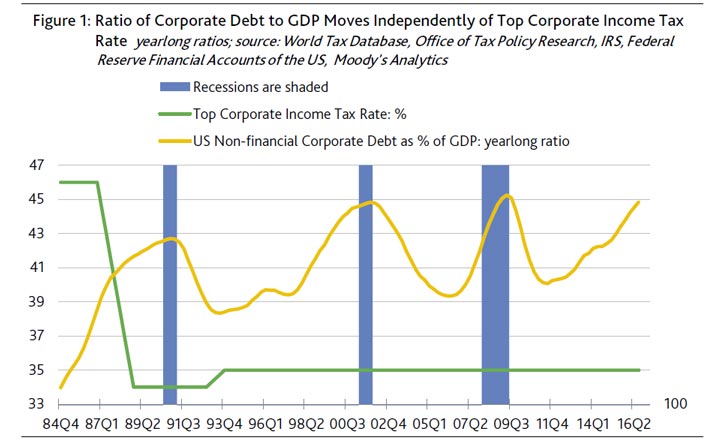
Has so much really changed in the past couple of months, or will the US debt overhang bite back?

A $90 Billion Debt Wave Shows Cracks in U.S. Property Boom

From Bloomberg.

A $90 billion wave of maturing commercial mortgages, leftover debt from the 2007 lending boom, is laying bare the weak links in the U.S. real estate market.

It’s getting harder for landlords who rely on borrowed cash to find new loans to pay off the old ones, leading to forecasts for higher delinquencies. Lenders have gotten choosier about which buildings they’ll fund, concerned about overheated prices for properties from hotels to shopping malls, and record values for office buildings in cities such as New York. Rising interest rates and regulatory constraints for banks also are increasing the odds that borrowers will come up short when it’s time to refinance.

“There are a lot more problem loans out there than people think,” said Ray Potter, founder of R3 Funding, a New York-based firm that arranges financing for landlords and investors. “We’re not going to see a huge crash, but there will be more losses than people are expecting.”

The winners and losers of a lopsided real estate recovery will be cemented as the last vestiges of pre-crisis debt clear the system. While Manhattan skyscraper values have surged 50 percent above the 2008 peak, prices for suburban office buildings still languish 4.8 percent below, according to an index from Moody’s Investors Service and Real Capital Analytics Inc. Borrowers holding commercial real estate outside of major metropolitan areas are now feeling the pinch as they attempt to secure fresh financing, Potter said.


The delinquency rate for commercial mortgages that have been packaged into bonds is forecast to climb by as much as 2.4 percentage points to 5.75 percent in 2017, reversing several years of declines, as property owners struggle with maturing loans, according to Fitch Ratings. That sets the stage for bondholder losses.

CMBS Record

Banks sold a record $250 billion of commercial mortgage-backed securities to institutional investors in 2007, and lax lending standards enabled landlords across the U.S. to saddle buildings with large piles of debt. When credit markets froze the following year, Wall Street analysts warned of a cataclysm, with $700 billion of commercial mortgages set to mature over the next decade.

“At the depths of the panic, it was just that: panic,” said Manus Clancy, a managing director at Trepp LLC, a firm that tracks commercial-mortgage debt. “That made people’s future expectations extremely bearish. Extremely low interest rates over the last four or five years have forgiven a lot of sins.”

The CMBS market roared back after an 16-month shutdown, and lenders plowed into real estate as an antidote to skimpy returns for other investments. The cheap loans helped propel property values to record highs in big cities such as New York and San Francisco, alleviating concerns about the mountain of debt coming due.

Credit for property owners has once again become scarce in some pockets. Borrowing costs jumped following the surprise election of President Donald Trump, and Wall Street firms are being more cautious as new regulations kick in requiring them to hold a stake in the mortgages they sell off. Other lenders are scaling back on commitments to property types and locations where problems have gotten harder to ignore.

Struggling Malls

Lenders are taking an increasingly dim view of retail properties — especially malls — as the growth of e-commerce eats into sales at brick-and-mortar stores. Malls tend to have higher loss rates than other property types after a default, increasing the stigma for lenders, according to Lea Overby, an analyst at Morningstar Credit Ratings LLC.

When malls “start to go downhill, if nothing is done to turn the ship around, they plummet,” Overby said. “The fate of some of these malls is very, very uncertain.”

The Sunset Mall in San Angelo, Texas, added a glow-in-the-dark mini golf course in June, part of a nationwide trend of retailers trying to lure customers with experiences they can’t find online. Yet when a $28 million mortgage came due in December, the borrower couldn’t refinance it, according to data compiled by Bloomberg. The debt, part of a bond deal sold by Citigroup Inc. and Deutsche Bank AG in March 2007, was handed off to a firm specializing in troubled loans.

A similar storyline is playing out at a 82,000-square-foot (7,600-square-meter) suburban office complex in Norfolk, Virginia, whose tenants include health-care services firms. The borrower stopped making payments on a $20 million loan that comes due next month and can’t refinance the debt, Bloomberg data show.

Representatives for the owners of the properties didn’t respond to phone calls seeking comment on the loans.

Manhattan Tower

Landlords that own high-profile buildings in big cities are faring better. At 5 Times Square, the Manhattan headquarters for Ernst & Young LLP, the owners are close to securing a five-year loan to pay off $1 billion in debt that comes due in March, according to Scott Rechler, chief executive officer of RXR Realty, which owns 49 percent of the building. RXR acquired its stake in the 39-story tower shortly after the building was sold to real estate investor David Werner for $1.5 billion in 2014.

“We are currently reviewing term sheets from a number of institutions and expect to settle on a lender within a week or so,” Rechler said.

Some borrowers chipped away at the maturity wall by retiring their mortgages early in order to take advantage of ultra-low interest rates. At the same time, landlords with the weakest properties have already defaulted, further reducing the pool of loans that need to be refinanced. The maturity wall has been whittled down to about $90 billion from $250 billion in 2008, according to data from Morningstar. The firm estimates that roughly half of the remaining loans will have difficulty refinancing.

S&P analysts are predicting that about 13 percent of real estate loans coming due will ultimately default, up from 8 percent over the past two years, according to Dennis Sim, a researcher at the firm. That’s their base case, but the default rate could be higher, he said.

“There are a lot of headwinds currently — with the interest-rate increase, with the new administration coming in, and also risk retention,” Sim said. “Those three wild-card factors could also play a role in how some of the better-performing loans are able to refinance or not.”

Trump Revamps U.S. Trade Focus by Pulling Out of Pacific Deal

From Bloomberg.

With the stroke of a pen, President Donald Trump abruptly ended the decades-old U.S. tilt toward free trade by signing an executive order to withdraw from an Asia-Pacific accord that had been promoted by companies including Nike Inc. and Wal-Mart Stores Inc. as well as family farmers and ranchers.

“Great thing for the American worker, what we just did,” Trump said on Monday after signing an order withdrawing the U.S. from the Trans-Pacific Partnership accord with 11 other nations. He didn’t take any step to initiate a renegotiation of the Nafta deal with Mexico and Canada, but an aide, who spoke on condition of anonymity, said action on the accord is still in the works.

“We’ve been talking about this a long time,” Trump said.

While Trump’s order doesn’t come as a surprise — he campaigned against the TPP and other trade deals during his campaign for the White House — the action rattled some Republicans and company executives who’ve built their businesses around decades of U.S. policy geared toward more open trade. Its unclear whether Trump will replace TPP with other, narrower trade deals. There also is concern about what more protectionist policies will mean for the modern economy, where goods can travel across more than a dozen borders before making their way to the consumer.

Turnabout

“Never has the president been the one to initiate protectionism or been so vocal about turning inward,” Dan Ikenson, the director of the Cato institute’s Herbert A. Stiefel Center for Trade Policy Studies. “U.S. Trade policy on a bipartisan basis since 1934 has been geared toward liberalization and accommodation and internationalism.”

An unlikely group of bedfellows supported and opposed the announcement. Among the supporters were labor groups, Democrats such as Ohio Senator Sherrod Brown and U.S. tobacco companies, which opposed the deal over a provision that would have prevented them from suing to challenge anti-smoking measures.

Expressing disappointment with the move were farm interests and some members of Trump’s own party, including Senator John McCain, who warned it would mean abandoning the U.S. strategic position in Asia, where China is ready to step into to any vacuum left by the American withdrawal.

“Abandoning TPP is the wrong decision,” said McCain, an Arizona Republican in a statement. “Moving forward, it is imperative that America advances a positive trade agenda in the Asia-Pacific that will keep American workers and companies competitive in one of the most economically vibrant and fastest-growing regions in the world.”

Beef Sales

The National Cattlemen’s Beef Association, a trade group representing 230,000 cattle ranchers and feeders, said not having a trade deal like TPP costs the industry $400,000 in sales a day and that Nafta has driven up U.S. beef exports to Mexico more than seven-fold. Without those deals in place, the price of U.S. beef would cost more oversees, putting them at a disadvantage.

“TPP and Nafta have long been convenient political punching bags, but the reality is that foreign trade has been one of the greatest success stories in the long history of the U.S. beef industry,” the group said in a statement.

U.S. agriculture exports have doubled since Nafta was signed by then-President Bill Clinton in 1993.

Trump’s decision to pull out of TPP eliminates potential savings on import tariffs for retailers like Foot Locker Inc. and Wal-Mart, and brands such as Nike, Adidas AG and Puma SE, according to data from Bloomberg Intelligence. The cut in import costs would have been $450 million a year, according to the Footwear Distributors and Retailers of America.

Company Support

The death of TPP is an especially bitter pill for Mark Parker, Nike’s chief executive officer. He has said TPP would help it add jobs in the U.S. because Nike would be able to use the savings from the deal to invest in the U.S. As the world’s largest sports brand, Nike sources about 40 percent of its shoes from Vietnam, a TPP member nation, and was very public supporter of the trade pact. Representatives from Nike didn’t respond to requests for comment.

Aldo Group, a Canadian footwear maker with a third of sales in the U.S., has been shifting production from China into Vietnam in anticipation of TPP being implemented in the hope of being able to take advantage of lower tariffs, said Bryan Eshelman, chief operating officer.

“TPP would have been fantastic’’ as the footwear industry pays on average as much as 18 percent of duty for imports to enter the U.S., Eshelman said in an interview before the executive order was signed. “In the short term, we are slightly disappointed that we can’t expect the duty relief that we were hoping for out of Vietnam.’’

Taxes, Regulation

But he said if the U.S. economy would grow faster because of some of Trump’s other policies such as regulation reduction and lower tax rates, that would be beneficial for the company.

“If that happens, forget tariffs reduction, our business will grow because the economy will grow and that would be a better outcome for us than lower duty imports into the U.S.,’’ Eshelman said.

The TPP, a 12-country deal that sought to liberalize trade between the U.S. and Pacific Rim nations including Japan, Mexico and Singapore, was a signature piece of former President Barack Obama’s attempt to pivot U.S. global strategy to focus on the fast-growing economies of Asia. The group that was part of the accord represents about 40 percent of the world economy. However, given rising opposition among Democrats and some Republican, it was never submitted for ratification.

The future of the TPP is now in flux. Japanese Prime Minister Shinzo Abe said in November that TPP without the U.S. would be “meaningless.” Still, multiple signatory countries including Vietnam and Australia have said they would stick to the deal even without the leading party of the agreement.

‘Good Result’

On Nafta, Trump said Sunday that he’ll meet with Canadian Prime Minister Justin Trudeau and Mexican President Enrique Pena Nieto to begin discussing the deal, which he has routinely blamed for the loss of U.S. jobs although there was little change to employment in the U.S. in several years after it went into effect. Trump signaled that he’s willing to work with the U.S.’s closest neighbors.

“We’re going to start renegotiating on Nafta, on immigration, and on security at the border,” Trump said at the start of a swearing-in ceremony for top White House staff. “I think we’re going to have a very good result for Mexico, for the United States, for everybody involved. It’s really very important.”

Officials in Canada, which is the biggest buyer of U.S. exports, have indicated they want to avoid getting entangled with the Trump administration’s targeting of imports from Mexico and China. The three countries are the biggest trading partners of the U.S.

David MacNaughton, Canada’s ambassador to the U.S., told reporters his focus is on avoiding Canada being “collateral damage” in trade talks.