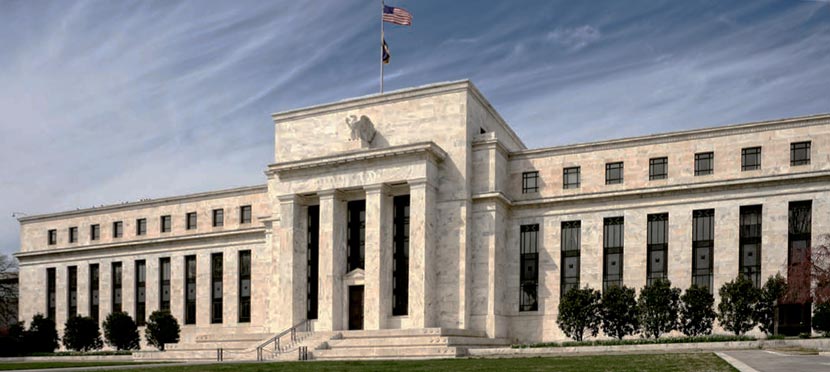
Trump Regulatory Changes May Not Be a Win for Banks

Fitch Ratings says US financial institution (FI) regulatory reform may feature as a priority legislative agenda item, reflecting the campaign of President-elect Donald Trump as well as the ongoing views of several key majority Congressional leaders.

USA-Economy-Pic

Fitch does not foresee any changes to US FI ratings as a result of the election. Changes that potentially reduce capital or liquidity requirements are likely to be a negative, but the impact on individual ratings will depend on how banks respond to this change. To the extent that capital or liquidity levels decline materially, that could result in negative rating implications, but Fitch views this scenario as unlikely.

The Dodd-Frank Act (DFA) has featured as a target in President-elect Donald Trump’s campaign statements, but most aspects of DFA have been implemented, and it is unclear whether a wholesale repeal could pass or what a partial repeal may encompass.

The Consumer Financial Protection Bureau is a relatively high-profile target for those opposed to the DFA, but its elimination on its own would be unlikely to have a material impact for banks in the aggregate. Notably, there has been little specific discussion of peeling back the Volcker Rule or Resolution Authority, some of the more costly aspects of the DFA. Fitch notes that the reduction in proprietary trading activity linked to Volcker has been largely positive for banks, while the resolution process has been largely positive for banks’ governance.

Anti-Wall Street sentiment has been a recurring theme in the presidential campaign for both candidates, so it remains an open question as to the likelihood or urgency of any proposed financial sector regulatory reform or repeal. Smaller regional or community banks may be viewed as more worthy beneficiaries of regulatory relief than money center banks. In addition, the reintroduction of Glass-Steagall (GS) is unlikely to be a policy priority. The reintroduction of some elements of GS was included in both parties’ platforms, but it was not a prominent theme in the campaign. The industry is likely to continue to strenuously oppose regulation that would re-impose restrictions that had existed under GS.

It is also important to note that capital and liquidity requirements have not historically been dictated by the Legislature but through banking regulators in the US. The US has adopted Basel III and those requirements will continue to be implemented, regardless of the administration. Therefore, while aspects of the DFA may be peeled back, core banking regulation is unlikely to change.

Generally, US financial institutions’ performance tends to be correlated with the overall US macroeconomic environment, particularly as it relates to economic growth. Judging by the campaign, the new administration’s economic policy is likely to revolve around tax cuts, renegotiating trade agreements, de-regulation and higher infrastructure spending. However, it remains to be seen the degree to which Trump will implement or be able to carry out his policy initiatives and the long-term effect policy changes will have on growth.

In the near term, increased policy uncertainty could dampen prospects for private investment growth. If the Fed judged these effects were likely to outweigh the impact of any additional fiscal easing, it may prompt them to raise rates at a slower pace than previously expected over the coming year. This would delay any positive operating leverage from rate hikes out further, as the impact tends to be lagged. Overall, Fitch expects that incremental interest rate increases would be positive for banks’ net interest margins.

Aging Boomers May Stymie Trumponomics

Moody’s says not only did the wide majority of experts incorrectly predict the outcome of the US Presidential election, pundits also were far off the mark regarding how markets might react to an improbable Donald J. Trump victory. Instead of conforming to pre-election expectations of an equity market sell-off and lower interest rates, both share prices and bond yields have soared since Trump’s victory. Whether they remain higher depends on a widely anticipated acceleration by business sales vis-a-vis employment costs that may not materialize.

economics-pic

As inferred from recent market performance, the economic, taxation, and regulatory policies of the past eight years curbed business activity considerably and, by doing so, reined in the growth of attractive job opportunities. To the degree existing policies limited US business activity, they very much facilitated Donald Trump’s Presidential upset. Perhaps, “secular stagnation” is partly the offshoot of suboptimal government policies that helped to slash US real GDP’s average annual growth rate from the 3.3% of the 10-years-ended 2006 to the 1.3% of the 10-years-ended 2016.

Nevertheless, unprecedented demographic change that is beyond the scope of an immediate government remedy is one of the major drivers of “secular stagnation”. The aging of the US population complements the deceleration of growth quite nicely.

When the US economy grew by 3.3% annually during the 10-years-ended 2006, the number of Americans aged 65 years and older rose by 310,000 annually, on average, while the number aged 16 to 64 years — a proxy for the working-age population — expanded by a much greater 2.36-million annually. By the 10-years-ended 2016, the average annual increase in the number aged at least 65 years soared to 1.28 million as the annual addition to the working-age population sagged to the same 1.28 million.

Notwithstanding the likely implementation of more stimulatory policies, US growth during the next 10-years-ended 2026 will still be constrained by projected average annual increase of only 470,000 for the number of 16- to 64-year old Americans, which is far less than the forecasted average annual addition of 2.05 million to the ranks of those 65-years and older.

If, as expected, the US working-age population grows by 0.5% annually during the next 10-years, then a likely range of 1.0% to 1.5% for the average annual rate of labor productivity growth suggests that US real GDP will increase by between 1.5% and 2% annually through 2026, which is much slower than its 3.2% average annualized increase of the 25 years ended 2006.

Older workforce may keep 10-year Treasury yield under 3% to 5% range. In addition to the overall population, the US workforce is also getting older in a manner never seen before. Since June 2009’s end to the Great Recession, the cumulative 8.5% growth of household-survey employment was unevenly split between a 3.9% increase in the number of employees aged less than 55 years and a 28.0% surge for the employment of Americans aged at least 55 years.

If employment growth remains skewed toward older workers, part-time workers will probably constitute an above-trend share of employment, while the growth of both personal income and household spending will be slower than otherwise. The underlying growth of both income and spending slowed as the share of workers aged at least 55 years soared from October 1996’s 12.1% to October 2016’s 22.8% of total US employment.

Some now warn of an impending climb by the 10-year Treasury yield to a range of 3% to 5%. However, an older workforce weighs against a much higher benchmark Treasury yield. An older workforce and an aging population are expected to limit the upsides for inflation risk, private-sector borrowing, and household expenditures growth by enough to prevent the 10-year Treasury yield from becoming stuck in a range of 3% to 5%.

Credit Markets Review and Outlook

As illustrated by Figure 1, the 10-year Treasury yield maintains a strong correlation of -0.84 with the share of employment aged at least 55 years. Getting to a forecast midpoint of 3% for the 10-year Treasury requires that the employment of Americans aged at least 55 years drop from October 2016’s 22.8% to roughly 20% of total employment. Such a rejuvenation of US employment is highly unlikely. The impossibility of making America young again renders it all the more difficult to make America great again. (Figure 1.)

trump-boomers
Equity rally helps to drive benchmark yields sharply higher

Thus far, earnings-sensitive markets view the Republican sweep of the House, Senate, and Presidency positively. Since November 8’s election, the market value of US common stock was recently up 1.9%. Moreover, after the VIX index’s average soared from October 2016’s 14.6 points to the 20.0 points of November’s first eight days, this equity market “fear factor” subsequently dropped to a recent 14.6. The latter has been statistically associated with a 430 bp midpoint for the high-yield bond spread, which was thinner than November 9’s band of 508 bp.

The post-election equity rally stems from improved prospects for business activity and profits. The Republican sweep boosts the odds favoring a fiscal stimulus package that includes lower tax rates on personal and corporate income, as well as stepped-up infrastructure spending. Moreover, a much reduced rate of taxation on the repatriation of corporate cash held overseas is probable.

In addition, business operating costs are likely to be effectively reduced by the repeal of the Affordable Care Act and a broad-based easing of federal regulations. On the regulatory front, Bloomberg reports that Trump’s Financial Services Policy Implementation team will devise a strategy that aims to dismantle 2010’s Dodd-Frank Act. Expectations of both Dodd-Frank’s demise and Fed rate hikes have driven the KBW index of bank stock prices up by more than 9% since November 8.

Nevertheless, upwardly revised outlooks for business activity and corporate earnings quickly drove the 10-year Treasury yield up by 27 bp from November 8’s close to a recent 2.13%. Not since January 2016 has the 10-year Treasury yield been this high.

Recent auctions of new 10- and 30-year Treasury bonds were weak. The 2.22:1 bid-to-cover ratio for November 9’s $23 billion auction of 10-year Treasury notes was the lowest since March 2009. In addition, foreign participation was weak at both sales. Trump’s surprising victory may have temporarily scared off foreign buyers of US Treasuries.

Nevertheless, the dollar exchange rate has climbed higher since the election. The recent widening of the yield spreads between US Treasuries and the sovereign government bonds of other advanced economies may help to further firm the dollar exchange rate, where expectations of an even stronger dollar may contain Treasury yields by (i) reducing inflation expectations, (ii) boosting foreign purchases of US Treasuries, and (iii) lowering the outlook for US corporate earnings.

Credit Markets Review and Outlook

Despite a costlier dollar exchange rate, industrial metals prices have soared. On November 9, Moody’s industrial metals price index was up by 29.4% from a year earlier.

However, the still relatively modest pace of global industrial activity questions the sustainability of the latest surge by base metals prices. Perhaps, speculative buying in anticipation of a lively rejuvenation of global industrial activity now drives base metals prices higher. If the world’s consumers fail to cooperate and spending does not rise by enough to support costlier base metals, base metals price deflation will return.
Given the persistent price deflation afflicting tangible consumer goods, manufacturers will have difficulty passing on higher materials costs to final product prices. In October, the annual rates of price deflation were -2.3% for the consumer durable goods’ component of the PCE price index and -0.6% for the core consumer goods price index. The underutilization of the world’s production capabilities should continue to contain prices of internationally tradable products regardless of forthcoming stimulus and deregulation.

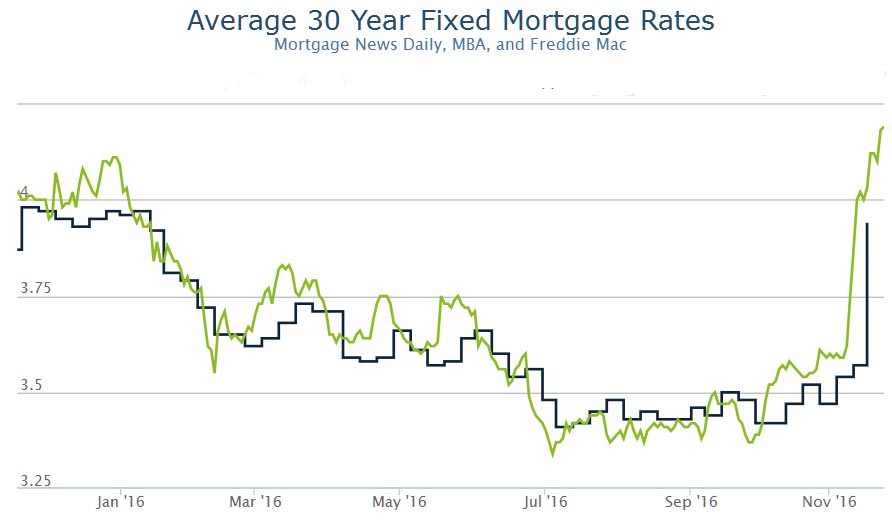
A fundamentally excessive climb by Treasury bond yields could sink share prices and widen spreads. Thus, credit-sensitive activity may offer insight as to how high interest rates might climb. In view of how unit home sales recently slowed amid a less than 3.5% mortgage yield, an impending climb by the mortgage yield to a range of 3.75% to 4% risks an outright year-over-year contraction by home sales.

Trade with China or security with the US? Australia will have to choose

From The Conversation.

Donald Trump’s victory promises a further departure from the traditional Asia-Pacific order created during the Cold War years. This was when the US provided military and economic dominance through a system of defence alliances with the major trading partners in the region, including Australia.

The old Asia-Pacific order was based on the exchange of security for free trade. With the demise of the Soviet Union and the rise of China’s market economy, the Asia-Pacific order is now in an evolutionary phase.

Now the hierarchy of countries is splitting between security – still dominated by the US, and the economic order- which is being overtaken by China.

In the middle of this competition between the US and China, there are the Asia-Pacific countries dealing with China for economic gains without giving away American security patronage. Japan and Australia best exemplify these countries.

For example, both are negotiating the Trans Pacific Partnership and the Regional Comprehensive Economic Partnership, while keeping vast numbers of US troops and nuclear armaments on their soils. Both clearly benefit from the status quo and don’t wish for the day to come when they have to choose a bundled security-economic dependency with either the US or China, in Cold War-like dynamics.

The stability of the current dual order between the US and China depends first and foremost on the US ability and willingness to provide its Asia-Pacific allies with a security bulwark against destabilising actors (for example, North Korea, ISIS, and the various nationalistic forces). Trump’s isolationist foreign policy may put an abrupt end to this dynamic.

Recent issues in the South China Sea show that China may grow impatient in sharing the limelight with the US. Reuters

On the other hand, it’s still not clear whether China is going to be satisfied with economic dominance alone and with its current geopolitical restraint with its trading partners in the region. China may soon gradually use its trade and investment might to push smaller Asian countries away from their strong bilateral security ties with the US, in exchange for tighter multilateral economic cooperation.

The perfect example of this new dynamic is the recent alignment of the Philippines with China. Philippines President Rodrigo Duterte claimed that “America has lost” both militarily and economically.

China’s elites have long held the view of the US as a declining power and China as its natural heir in the region. Long-established research in political science and economics shows countries rise as they use asymmetric trade relations to turn economic dominance into a military dominance for geopolitical gains.

China’s world trade policy is to assert regional leadership to integrate and upgrade in the global economy. China will eventually seek to translate this trade leadership into regional security and then political dominance also at a global level, as the Asia-Pacific region carries the bulk of world economic growth.

However there is an increasing co-dependency between China and other countries in trade dynamics, particularly in the natural resources sector and in foreign direct investments tied to global supply chains.

On the one hand, this co-dependency restrains China from an exceedingly aggressive foreign policy, but on the other hand is pushing China’s strategic interests out of the Asia-Pacific regional shell. In fact, as early as November 2014, China’s President Xi Jinping openly advanced the idea of a “major-power diplomacy with Chinese characteristics”. In other words, to secure national interests with a more assertive foreign policy reflecting China’s rising economic power.

With Trump’s victory, and also considering the recent issues in the South China Sea, it would be hard to believe that China is going to be satisfied in a dual order under the US security umbrella. The ultimate issue is whether China will decide to pursue hardline policies to push the US outside of Asia in the short term, or instead patiently wait for the US to naturally recede from the region as its economic power wanes.

Before Trump’s victory, there was reason to believe that Xi Jinping and the Chinese government would opt for the latter option. This was because it’s not in China’s best economic interest to ignite geopolitical tensions in Asia, especially as the American retreat may lead Japan to reinstate a significant military capability.

As China currently benefits from a stable, open and secure system of free trade, Trump’s trade protectionist agenda may instead push China towards hardline foreign policies. This would compel its co-dependent trading partners like Australia to soon make a clear choice between the US and China.

Author: Giovanni Di Lieto, Lecturer, Bachelor of International Business, Monash Business School, Monash University

US Consumer Credit Growth Strong

The latest data from the US Federal Reserve shows that consumer credit increased at a seasonally adjusted annual rate of 7 percent during the third quarter. Revolving credit increased at an annual rate of 5-1/4 percent, while nonrevolving credit increased at an annual rate of 7-1/2 percent. In September, consumer credit increased at an annual rate of 6-1/4 percent.

consumer-credit-oct-2106-usFurther evidence supporting a rate rise in December?

Political Uncertainty, Low Rates Will Weigh on 4Q U.S. Bank Earnings

Fitch Ratings says U.S. banks experienced modest earnings expansion in the third quarter of 2016 (3Q16) relative to 2Q16; however, earnings will not materially expand in the near term given political uncertainties, prolonged low interest rates, modest economic growth and softness in key economies globally, according to their 3Q16 U.S Banking Quarterly Comment which reviews the largest 17 U.S. banks.

calc-pic

“Political uncertainty has resulted in softer demand for commercial credit from businesses, particularly in the middle-market, which resulted in sluggish loan growth for most U.S. banks and could extend into 4Q16,” said Bain Rumohr, Director, Fitch Ratings.

After a strong start to the year, loan growth was muted, particularly for commercial loans. Fitch also believes a regulatory commercial real estate (CRE) regulatory guidance from December 2015 has impacted CRE loan growth. However, banks are increasing their consumer lending efforts with many growing credit card balances and mortgage portfolios while pulling back from indirect auto lending which has shown recent signs of weakness. Large mortgage originators all reported growth in originations and applications in 3Q16. Despite sluggish loan growth, deposit growth continues to be strong as consumers and businesses remain relatively less levered.

Overall most banks with large loan portfolios reported sequential improvement in loan losses, but Fitch expects losses to deteriorate from currently unsustainably low levels. Median credit losses for the group have been 50-60 bps lower than the FDIC long-term average over the last five quarters.

Citing a slowdown in growth and broad credit improvement some banks released loan loss reserves this quarter; however, JP Morgan Chase and Citi both built reserves tied to credit quality expectations and growth in consumer portfolios going forward.

Following a good 2Q16, capital markets results for the large global trading and universal banks were once again strong in 3Q16, relatively flat to 2Q but increasing 20% from the year-ago quarter. Higher revenues from FICC trading, drove the growth while equities trading remained relatively muted.

“As we expected, most banks reported flat or compressed net interest margins for the quarter and Fitch reiterates that a sustained and consistently steep yield curve will be critical to improving NIMs for a meaningful period and the shape of the curve to be more important than the level of short-term interest rates,” added Rumohr.

Given this persistently low rate environment banks of all sizes have been especially focused on controlling and/or cutting expenses. During the 3Q16 earnings season, many large U.S. banks pointed to new or expanded cost cutting measures to be carried out going forward In general, Fitch believes that many of the easier cost cuts have already been executed on and that incremental savings will be more difficult to produce going forward.

Overblown Inflation Fear Roils Markets – Moody’s

Thus far, according to Moody’s, US financial assets have fared poorly during the fourth quarter. Fear of a fundamentally unwarranted climb by Treasury yields has weighed on the performance of earnings-sensitive securities.

USA-Economy-Pic

The latest climb by the 10-year Treasury yield from a September 2016 average of 1.63% to a more recent 1.81% has been ascribed to expectations of a series of Fed rate hikes in response to a possibly much faster than 2% annual rate of CPI inflation. Though the current bout of inflation anxiety may be overblown, holders of earnings-sensitive securities worry about long-term borrowing costs reaching burdensome levels. In addition, higher yielding Treasury securities will drive up the returns investors demand from other assets. And, the surest way to boost an asset’s future prospective return is to lower its current price.

Since the end of September, the market value of US common stock was recently down by -4.0%. The accompanying -7.3% dive by the Russell 2000 stock price index shows that the prospective loss of liquidity to higher interest rates may weigh more heavily on small- to mid-sized companies.

For businesses incurring flat to lower sales volumes, higher borrowing costs make absolutely no sense. It should be noted that the NFIB’s survey of small businesses found that the net percent of polled firms reporting a three-month increase by sales volumes sank from the -5.5 percentage points, on average, of the year-ended June 2016 to the -7.8 points of Q3-2016. (When the net percent is negative, the number of surveyed firms incurring a decline by sales volumes tops the number reporting an increase.)

Only once during the current recovery has the sales volume statistic’s moving three-month average achieved a positive reading — the +1.1 points of the three-months-ended May 2012. For the current recovery, the sales volume index has averaged a woeful -9.4 points, which was worse than its insipid +1.0 point average of 2002-2007’s upturn.

Housing-sector share prices plunge

The fourth-quarter-to-date’s -8.0% plunge incurred by the PHLX index of housing-sector share prices reflects considerable worry over a possible ascent by benchmark yields that will stifle housing activity. Markets remember all too well how a climb by mortgage yields during the “taper tantrum” of 2013 reduced home sales.

Yes, the 10-year Treasury yield could jump up to 2% or higher, but its stay will be limited if housing buckles under the weight of higher mortgage yields. The fact that housing did not get more of a boost from a -50 bp drop by the 30-year mortgage yield from a Q3-2015 average of 3.95% to the 3.45% of Q3-2016 warns of an annual contraction by home sales if the 10-year Treasury yield remains above 2%.

Housing’s muted response to a less than 3.5% 30-year mortgage yield suggests only a limited upside for the 10-year Treasury yield. After surging by +16.1% year-over-year during the year-ended June 2016, dollar outlays on single family home construction dipped by -0.8% year-over-year during Q3-2016.

In addition, the year-over-year percent increase for unit sales of new and existing homes slowed from the 4.9% of 2016’s first half to the 1.6% of the third quarter. Looking ahead, a slowdown by the annual rise for the index of pending home sales from first-half 2016’s 1.7% to the third quarter’s 1.2% signals a slowing by home sales that risks deteriorating into an outright contraction if mortgage yields jump higher.

Inflation worries overlook deep pockets of deflation

Forecasts of a 10-year Treasury yield noticeably above 2% are derived from expectations of faster price inflation. Nevertheless, exaggerated fears of faster price inflation have surfaced at various times during the current recovery. Remember those earlier off-the-wall predictions of Weimar-like hyperinflation for the US economy? Forecasts of persistently rapid price inflation have proven to be so very wrong largely because US consumers have lacked the cash needed to fund runaway price inflation. In addition, the aging of both the US population and the US workforce add to the difficulty of sustaining accelerations by consumer prices.

Price inflation now lacks breadth. If the Fed decides to fight headline inflation, the plight of those having exposure to tangible consumer goods is likely to worsen. Third-quarter 2016’s PCE price index rose by 1.0% annually, which was well under the Fed’s 2% target for PCE price index inflation. Moreover, the third-quarter’s yearly pace for the Fed’s preferred index of consumer prices contained major pockets of consumer-goods price deflation.

For example, Q3-2016’s price index for durable consumer goods was down by -2.3% from a year earlier, while the price index for consumer nondurable goods fell by -1.3% annually. By contrast, the consumer services’ component of the PCE price index rose by 2.3% annually. Thus, consumer service price inflation explains Q3-2016’s 1.7% annual increase by the core PCE price index, which excludes food and energy prices.
Many fret over an increase by the annual rate of core CPI inflation from September 2015’S 1.9% to September 2016’s 2.2%. However, that quickening was largely the consequence of an increase by core consumer service price inflation from 2.7% to 3.2% that differed radically from an accompanying deepening of core consumer goods price deflation from -0.5% to -0.6%.

The rise by the annual rate of core consumer service price inflation was driven by increases in (i) medical-care service price inflation from September 2015’s 2.4% to September 2016’s 4.8% and (ii) shelter cost price inflation from 3.2% to 3.4%. Excluding shelter costs, the annual rate of core CPI inflation rose from September 2015’s 1.0% to a still very low 1.3% for September 2016.

Shelter cost inflation may peak soon

Recent data favor a slowing of shelter cost inflation from September’s 3.4% annual pace. The National Multifamily Housing Council (NMHC) compiles an index describing the tightness of apartment market conditions for the US. The rate of change for apartment rents tends to respond with a lag of 12 to 15 months following a major swing by the index of apartment market tightness.

After most recently peaking at the 89.7 of Q1-2011, the apartment market tightness index has subsequently plunged to the 28.0 of Q3-2016. The latter was the index’s lowest reading since the 20.0 of Q2-2009, or the final quarter of the Great Recession. (Figure 1.)

moodys04novEach previous drop by the apartment market conditions index to a reading of less than 30 was followed by a significantly slower rate of growth for rents and, in turn, the shelter cost component of the core CPI. For example, in response to Q2-2009’s ultra-low apartment conditions index, the average annual rate of rent inflation sank from the 3.1% of 2009’s first half to the 0.2% of April 2010 through December 2010. Thus, rent inflation is likely to slow noticeably from Q3-2016’s 3.7%.

Other forthcoming sources of consumer price disinflation include autos (owing to a glut of used vehicles and sweetened sales incentives) and restaurant meals (stemming from an excess supply of eateries).

In summary, if Treasury yields extend their latest climb absent indications of much improved profitability, the recent sell-off of high-yield bonds may continue. After bottoming at October 25’s 6.10% — the lowest reading since May 2015 — the composite speculative-grade bond yield rapidly ascended to November 2’s 6.63%. In response, the accompanying high-yield bond spread widened from 478 bp to 531 bp. The latter is very close to the spread’s predicted value of 529 bp mostly because of the return of an above-trend VIX index. To the degree Treasury yields rise faster than what is warranted by business activity, higher yields practically assure lower prices for equities and lower-grade corporates.

Initial US Q3 Growth Estimate Higher

The US Bureau of Economic Analysis says real gross domestic product increased at an annual rate of 2.9 percent in the third quarter of 2016, according to the “advance” estimate. In the second quarter, real GDP increased 1.4 percent.

However a key inflation indicator in the GDP report, the personal consumption expenditures price index, slowed from the second quarter to a 1.4 percent annual rate. The Fed has focused its easy money policy on boosting inflation to 2.0 percent, based on the broader PCE price index.

The Bureau emphasized that the third-quarter advance estimate released is based on source data that are incomplete or subject to further revision by the source agency. The “second” estimate for the third quarter, based on more complete data, will be released on November 29, 2016.

Real GDP: Percent Change from Preceding Quarter

Real GDP: Percent Change from Preceding Quarter

The increase in real GDP in the third quarter reflected positive contributions from personal consumption expenditures (PCE), exports, private inventory investment, federal government spending, and nonresidential fixed investment that were partly offset by negative contributions from residential fixed investment and state and local government spending. Imports, which are a subtraction in the calculation of GDP, increased.

The acceleration in real GDP growth in the third quarter reflected an upturn in private inventory investment, an acceleration in exports, a smaller decrease in state and local government spending, and an upturn in federal government spending. These were partly offset by a smaller increase in PCE, and a larger increase in imports.

Current-dollar GDP increased 4.4 percent, or $201.1 billion, in the third quarter to a level of $18,651.2 billion. In the second quarter, current dollar GDP increased 3.7 percent, or $168.5 billion.

The price index for gross domestic purchases increased 1.6 percent in the third quarter, compared with an increase of 2.1 percent in the second quarter (table 4). The PCE price index increased 1.4 percent, compared with an increase of 2.0 percent. Excluding food and energy prices, the PCE price index increased 1.7 percent, compared with an increase of 1.8 percent.

Personal Income

Current-dollar personal income increased $153.6 billion in the third quarter, compared with an increase of $153.1 billion in the second.

Disposable personal income increased $125.3 billion, or 3.6 percent, in the third quarter, compared with an increase of $140.6 billion, or 4.1 percent, in the second. Real disposable personal income increased 2.2 percent, compared with an increase of 2.1 percent.

Personal saving was $800.6 billion in the third quarter, compared with $793.5 billion in the second. The personal saving rate — personal saving as a percentage of disposable personal income — was 5.7 percent in the third quarter, the same as in the second.

China Oceanwide Acquires Genworth For $2.7 Billion

From Zero Hedge.

China Oceanwide Holdings Group agreed to buy troubled US insurer Genworth Financial Inc. for $2.7 billion in cash, pledging to help the U.S. firm manage its debt and strengthen life insurance units after it was hurt by higher-than-expected losses tied to long-term care coverage. A China Oceanwide investment platform will pay $5.43 per share, the companies said Sunday in a statement. That’s 4.2% more than Genworth’s closing price of $5.21 Friday. The buyer also promised to provide $600 million to Genworth to address debt maturing in 2018, as well as $525 million to strengthen the life insurance businesses.

genworth“Genworth is an established leader in both mortgage insurance and long-term care insurance, which are markets that present significant long-term growth opportunities,” China Oceanwide Chairman Lu Zhiqiang said in the statement. “We are providing crucial financial support to Genworth’s efforts to restructure its U.S. life insurance businesses.”

In recent months, Genworth CEO Tom McInerney has been selling assets to ensure the insurer has sufficient liquidity after it was hit by losses on its long-term care coverage, which pays for home-health aides and nursing home stays, and as low interest rates crimp returns. At that point, it was almost as if a white knight emerged for the troubled company, one from across the Pacific. China Oceanwide plans to let Richmond, Virginia-based Genworth operate as a standalone company after the takeover with senior management still in place, according to the statement. “Genworth is an established leader in both mortgage insurance and long-term care insurance, which are markets that present significant long-term growth opportunities,” China Oceanwide Chairman Lu Zhiqiang said in the statement. “We are providing crucial financial support to Genworth’s efforts to restructure its U.S. life insurance businesses.”

A quick prime on what Oceanwide’s $2.7 billion in cash will buy it:

Genworth writes mortgage insurance in the U.S., and has stakes in a Canadian and an Australian home-loan guarantor. Mortgage insurers cover losses for lenders when homeowners default and foreclosure fails to recoup costs. This deal gives China Oceanwide the chance to benefit from gains in the U.S. housing market.

McInerney has been seeking to free up capital to pay bonds coming due, and has also been boosting capital by selling assets. He struck a deal in 2015 to sell a European mortgage unit to AmTrust Financial Services Inc. and also agreed to have Axa SA buy a European unit that offers customers protection against the financial impact of major illness, accident or death. He’s also been working to restructure the business units in a way that’s acceptable to regulators, and won approval from bondholders earlier this year to reorganize some of its units.

The deal will help give Genworth the finances to separate a life and annuity operation from another life insurance arm, according to the statement. Lu said the transaction was structured to make it easier to obtain regulatory approval.

According to Bloomberg. the deal is expected to close by the middle of 2017.
Genworth received advice from Goldman Sachs Group Inc., Lazard Ltd., Willkie, Farr & Gallagher LLP, and Weil, Gotshal & Manges LLP, while the board of directors sought guidance from Richards, Layton & Finger. China Oceanwide was advised by Citigroup Inc., Willis Towers Watson Plc, Sullivan & Cromwell and Potter Anderson & Corroon LLP.

Should the deal close, it will likely unleash a surge of more Chinese acquisitions of questionable US companies, leading to even more short squeezes on concerns that the “Chinese are coming.”

M&A Is In Very Late Cycle Mode Says Moody’s

Mergers, acquisitions and divestitures tend to accelerate when profits are nearing a cyclical peak says Moody’s.

Once it becomes apparent that organic revenues will fall short of expanding rapidly enough to supply sufficient earnings growth, companies often either look to the outside to acquire growth or attempt to divest underperforming businesses.

The previous two record highs for yearlong M&A activity involving at least one US-based company as either buyer or target occurred in the third quarter of 2007 and 2000’s first quarter. The cycle peaks for the yearlong averages of pretax profits from current production were set prior to the tops for M&A, in Q4-2006 and Q4-1997, respectively.

Between the peaks for profits and M&A, yearlong M&A posted scintillating average annualized growth rates of (i) 32.5% from Q4-2006 to Q3-2007 and (ii) 37.2% from Q4-1997 to Q1-2000. Similarly, M&A advanced by 15.9% annually, to a record $3.325 trillion, between profits’ latest peak of Q1-2015 to Q1-2016’s new zenith for M&A.

moodys-ma1Latest Ratio of M&A to Profits Hints of Final Stage for Current Upturn

Since 1988, the ratio of M&A to pretax operating profits has averaged 90%. Nevertheless, the ratio of M&A to profits changes considerably throughout the business cycle. For example, the ratio of M&A to profits increased from its 73% average of the first four years of 2002-2007’s business cycle upturn to 121% during the recovery’s final two years. Moreover, after averaging 58% of profits during the first seven years of 1991-2000 economic recovery, M&A soared to 197% of profits during the upturn’s final three years.

The current recovery has followed the same pattern. Through the first five years of the current recovery through June 2014, M&A averaged 74% of pretax profits from current production. However, for the following two years ended June 2016, M&A averaged 144% of profits. As inferred from the recent historical trend, the 154% ratio of M&A to profits for the year-ended June 2016 suggests that the current business upturn is much closer to its demise than to its inception.

Rebound by Equities Contradicts What Occurred Following M&A’s Prior Two Record Highs

The continuation of subpar profitability offers no assurance of new record highs for M&A, especially if some combination of higher share prices amid above-average earnings uncertainty increases the risk of overpaying for business assets. At some difficult to define inflection point, persistently soft profits begin to weigh on M&A.

The previous two record highs for M&A suggest that M&A is likely to recede amid below-trend profits once the market value of US common stock crests. Immediately after M&A’s yearlong sum peaked in Q3-2007, the market value of US common equity set a new record high in October 2007. Similarly, March 2000’s then record high for the market value of US common stock occurred at the very end of an earlier record high for the yearlong sum of M&A.

moodys-ma2 Though the moving yearlong sum of M&A is likely to continue to fall from its latest zenith of Q1-2016, the market value of US common stock’s moving 20-day average has rebounded by 16% from its most recent low of February 15, 2016. Nevertheless, M&A has been unable to respond positively to higher share prices owing to how both business sales and profits have yet to convincingly establish rising trends. The fact that Q3-2016’s moving yearlong sum of M&A was down by -12% from its Q1-2016 peak hints of a growing sense among prospective buyers that business assets are grossly overvalued. The longer M&A slides amid a rising trend for share prices, the greater the likelihood that an equity market bubble has formed.

California Attorney General Launches Criminal Probe Into Wells Fargo Over Fake Accounts

From Zero Hedge.

John Stumpf is now gone from Wells Fargo, but his – and the bank’s – problems may be just starting.

According to a report by the LA Times, California Department of Justice is investigating Wells Fargo on allegations of criminal identity theft over its creation of millions of unauthorized accounts, according to a search warrant sent to the bank’s San Francisco headquarters this month. The warrant and related documents, served Oct. 5 and obtained by The Times through a FOIA request, confirm that California AG Kamala Harris, in the final weeks of a run for U.S. Senate, has joined the growing list of public officials and agencies investigating the bank in connection with the accounts scandal.

calc-pic

As Reuters adds, the AG warrant seeks to seize documents at Wells, and cites probable cause that felonies were committed at the bank.

Harris’ office demanded the bank turn over a trove of information, including the identities of California customers who had unauthorized accounts opened in their names, information about fees related to those accounts, the names of the Wells Fargo employees who opened the accounts, the names of those employees’ managers and emails or other communication related to those accounts.  Her office is also requesting the same information about accounts opened by Wells Fargo workers in California for customers in other states.

While on the surface this would be an admirable move, it appears to be merely the latest attempt by a politician to score brownie points with voters. According to the LA Times, Harris has made her combat of wrongdoing in the financial services industry one of the themes of her Senatorial campaign. She has especially pointed to her role in negotiating $20 billion in relief from banks for California homeowners who lost homes or suffered losses in the housing bust. But that deal failed to live up to promises she had made to send those responsible to jail, opening her up to some criticism.